Overview
Semiconductor manufacturers and OEMs demand tighter process control solutions that increase wafer throughput, reduce chemical costs and prevent wafer scrap. Each requires a precise concentration monitor for BEOL (back-end-of-line) processing chemicals, such as oxide/metal etchants, post-CMP cleaners, photo-resist strippers and surface prepa-ration solutions. The right concentprepa-ration monitor must exceed current technology, yet be cost-effective to implement.
Entegris offers InVue™ CR288, a highly accurate, in-line, real-time concentration monitor that meets these stringent requirements for improved BEOL process efficiency by allowing users to:
• Precisely monitor and control the chemical dilution and blending
• Increase chemical bath lifetime, which reduces chemical usage and disposal costs
• Detect chemical excursions, such as mechanical component failures
• Collect real-time data for optimizing a process or tool, such as the actual homogenization within a chemical blend
The CR288’s IoR (index of refraction) technology uniquely measures concentration based on the fluid’s IoR. These real-time, in-situ concentration measurements maintain a high degree of accuracy, precision and resolution. The ability to calibrate the CR288 in the field eliminates the need to have pro-prietary chemistry sent to the factory, and without consumable parts, little or no maintenance is nec-essary. The CR288 offers a wide dynamic range that is insensitive to bubbles and color, and guarantees an immediate return of investment.
Figure 1. InVue CR288 liquid chemical concentration monitor shown with two flow cells
INVUE™ CR288 CONCENTRATION
MONITOR APPLICATION NOTE FOR
BEOL SEMICONDUCTOR PROCESSING
2 APPLICATION NOTE ENTEGRIS, INC.
Typical Installation
The illustration below shows a typical blending application. In general, the concentrated chemical is diluted using DI water (DIW) before it is either placed directly on the wafer, or it is diverted to a holding tank where the chemistry is being recirculated in process. CR288 Process tool Recirculation loop Conc entr at ed chemistr y DI wa te r
Figure 2. Typical blending application
Case Studies
HF DilutionsThis graph compares the CR288's connectivity capability to measure concentration of HF dilutions from 1:100 to 1:1000. The conductivity signal saturates at approximately 5000 ppm. CR288 can measure the entire range (0 – 49 wt%), as well as the signal with more resolution, and has the potential for measuring dilutions lower than 1:1000.
Figure 3. HF dilutions 6000 5000 4000 3000 2000 1000 0 HF Co nc entr ation ( ppm ) 13:16:19 13:17:02 13:17:46 13:18:29 13:19:12 13:19:55 2500 mL/min; 1:100; 1:500; 1:750; 1:1000; HF:DI 1:100 1:500 1:750 1:1000 CR288 Conductivity sensor Time (hour/min/sec)
Photoresist Strip Dilutions
The CR288 offers continuous precision while con-ductivity cannot correctly measure photoresist strip in solution because photoresist strip is often a non-conductive chemical.
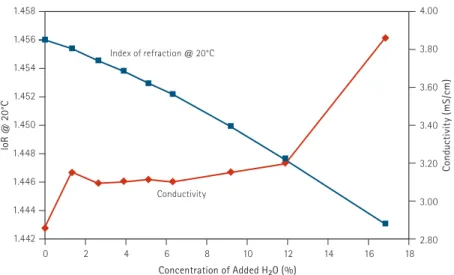
The plot in Figure 4 shows the CR288 IoR compared to a conductivity sensor output, both plotted as a function of time. The x-axis is the percentage of water added to the photoresist strip.
NOTE: The CR288 measures photoresist strip correctly throughout the process range.
In contrast, the conductivity sensor is completely insensitive to the changes in concentration. It is only once the water concentration reaches a sufficient level that the conductivity sensor can measure anything at all.
The CR288 inherently outperforms conductivity in this critical metric.
Figure 4. CR288 index of refraction vs. conductivity
1.458 1.456 1.454 1.452 1.450 1.448 1.446 1.444 1.442 4.00 3.80 3.60 3.40 3.20 3.00 2.80 lo R @ 20°C Cond uc tivi ty (m S/c m) 0 2 4 6 8 10 12 14 16 18 Index of refraction @ 20°C Concentration of Added H2O (%) Conductivity
4 APPLICATION NOTE ENTEGRIS, INC.
IoR Precision of Measurement for Post-CMP Cleaner, ESC-784
In this study the CR288 kit2 was installed at the point-of-use (POU) on a post-CMP cleaning tool that dilutes the post-CMP cleaner at POU using two flowmeters. One sensor head was installed in each cleaning tank. The results show that the CR288 pre- cisely monitored the POU dilution of the post-CMP cleaner in real time to at least the resolution of the flowmeters (0.1 wt%) with measurement resolution for even greater dilutions.
NOTE: Incoming chemical is highly concentrated and diluted to the target concentration of 2.78 wt%.
The CR288 monitors the POU blend to ensure that the target concentration of 2.78 wt% is met prior to wafer cleaning.
Figure 5. CR288 measurements of ESC- ‐784 post- CMP cleaning chemistry
3.50 3.30 3.10 2.90 2.70 2.50 2.30 19.35 19.15 18.95 18.75 18.55 18.35 18.15 17.95 Conc entr ation (w t% ) Te mp er at ur e (° C) Time (seconds) Fluid temperature New concentration 2.78% 3.08% 2.98% 2.88% 0 1000 2000 3000 4000 5000 6000
CR288 Millisecond Measurement in HF/SC1 in Single Wafer Tool
While the OEM used the CR288 in an FEOL envi- ronment, the example applies equally to BEOL. The monitor shows three wafers being processed. A single flow cell was installed at the POU and mea- sured premixed concentrations of distilled water, dilute HF, and SC1. The data demonstrate that: • Using a single sensor, the CR288 can monitor
the chemical that was dispensed at the POU as it switches between RCA cleaning chemistries. • The CR288's nearly instantaneous measurement
allows users to measure the chemistry on each wafer. The NIR measurement takes two minutes to achieve the required resolution while produc- tion continues.
• Conductivity could only be tuned for one of the chemicals, not all three.
Figure 6. Three wafer cycles of HF, DIW and SC1 dispense: 30-second chemical dispense; 0.1 sec CR288 response time
1.3350 1.3345 1.3340 1.3335 1.3330 1.3325 1.3320 1.3315 Inde x of Re fr ac tion 300 270 240 540 210 510 180 480 150 450 120 420 90 390 60 360 30 330 0 1:2:50 SC1 Time (seconds)
Note: Fluid Temperature Compensation (Tcc) optimized for both HF and SC1. Recommend for tool manufacturer to allow Tool PLC to “swap” individual Tcc values for the two blends.
CR288 loR
DIW 1:50 HF
DIW
ENTEGRIS, INC.