ULT Performance Testing
ULT Freezer Performance Testing
Emerson Design Services Network Project # 111686
Design Services Network
November 16, 2011
Test Performed by:
Dan Rice & Don Wenrich
Design Services Network
Report Prepared by:
Robert V. Nash, Jr.
Design Services Network
1351 North Vandemark Road
Sidney, Ohio 45365
(937) 493-2747
Prepared for:
November 16, 2011
Page 2 of 11
Table of Contents
1.0 Overview ... 3
2.0 Test Setup & Procedure………..…..3 - 6 2.1 Equipment Tested (ULT Freezer) ... 3
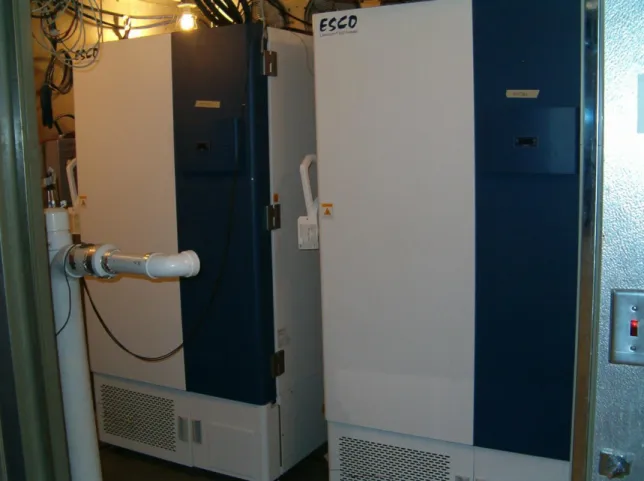
Figure 1: Test Units in Environmental Test Room………...3
Figure 2: View of Inside the Unit………4
Figure 3: Test Live Load………...4
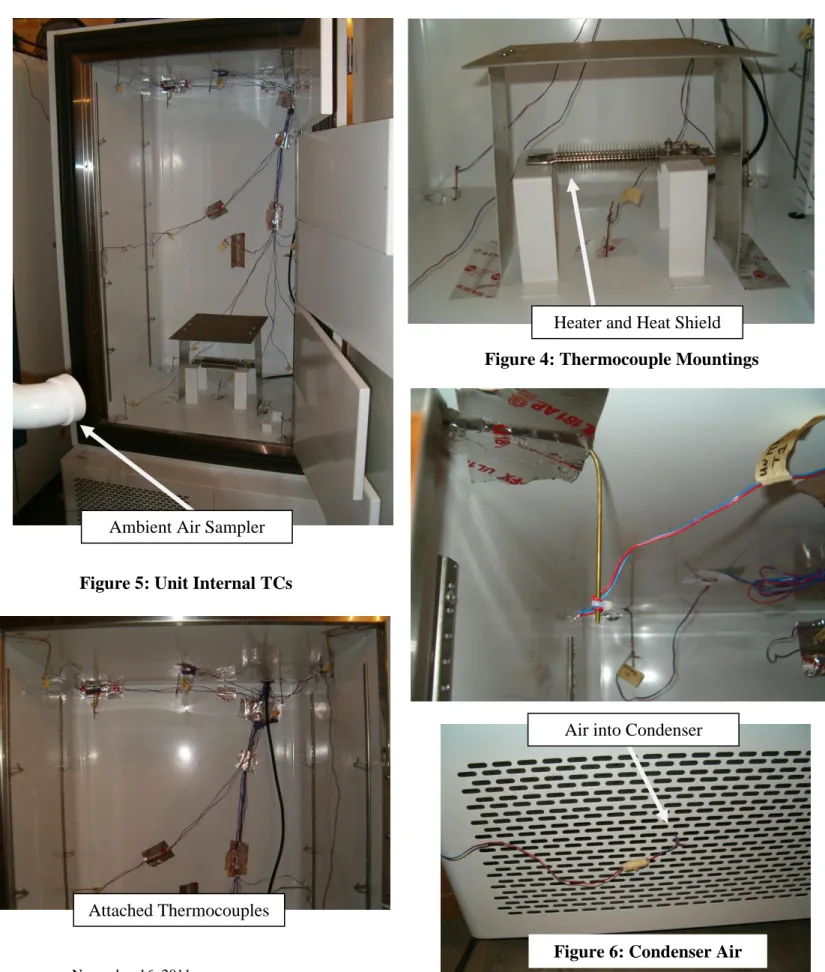
Figure 4: Thermocouple Mountings………4
Figure 5: Unit Internal TCs………..………4
Figure 6: Condenser Air………..…………4
2.2 Instrumentation ... Error! Bookmark not defined. Figure 7: Instrumentation Table.………..…………5
2.3 Test Conditions ... Error! Bookmark not defined. Figure 8 : Test Conditions Table………..…………...5
2.4 Test Procedure/Test Methods ... Error! Bookmark not defined. 3.0 Executive Summary of Test Results………..………....….6-9 3.1 Test Results...………..………..Error! Bookmark not defined.-9 Figure 9: Table of Energy and Warm-Up Comparisons………...6
Figure 10 Table of BOT and Reserve Comparisons………....7
Figure 11: Energy Consumption Comparison Chart………...7
Figure 12: Warm-Up Based on T16 Comparison Chart………...8
Figure 13: Warm-Up Based on T-1 to T16 Comparison Chart ………..8
Figure 14: BOT & Reserve Based on T16 Comparison Chart ………...9
Figure 15: BOT & Reserve Based on T-1 to T16 Comparison Chart……….9
4.0 Performance Data………...………...10
Appendix Attachemnt A – TC Calibration..……….………...10
Appendix Attachement B – Test Plan ... 10
Appendix Attachement C – BOT & Reserve Testing ... 10
Appendix Attachement D –Resere Testing ... 10
Appendix Attachment E –Energy Testing ... 10
Appendix Attachment F – Warm Up Testing ... 10
1.0
Overview
The scope of this project was to determine the performance of two ULT, cascade refrigerated, bio-medical type reach-in freezers. To determine the performance of the units a BOT (Bottom Out Test), a Btu Reserve Test, an Energy Consumption Test and a Warm-up Time Test were completed. A customized test plan in conjunction with the ANSI/ASHRAE 72 -2005 and ARI 1200-2006/2008 Standards were utilized to perform the testing. This report shows the out come of the testing.
2.0
Test Setup & Procedure
2.1 Equipment Tested (ULT Reach-in Freezers)
The equipment tested were two ULT reach-in freezers manufactured by ESCO. They had solid doors with secondary section doors and without interior lighting. The Model Number of the units is UUS-668A-1 with a Serial Number of 2011-54637 for unit #1 and 2011-55099 for unit #2. The cascade condensing units were pre-installed and charged by the manufacturer.
The evaporator coil is a cold wall type and was assembled by ESCO. The temperature control is by a controller supplied with the unit. There is no defrost control. The unit was tested without shelving and without product simulators. A resistive heater was utilized for the reserve capacity test as a live load.
November 16, 2011
Page 4 of 11
Figure 2: View of Inside of the Unit Figure 3: Test Live Load
Figure 4: Thermocouple Mountings
Product Simulators 24 Locations –
4 Hidden Behind Center Partition 12 Hidden in Back
Ambient Air Sampler
Heater and Heat Shield
Attached Thermocouples
Air into Condenser
Figure 5: Unit Internal TCs
2.2 Instrumentation
Temperatures inside the case and the air entering the condenser were measured using calibrated Type “T” thermocouples. The thermocouples inside the case were calibrated at -80°C and the condenser air at 20°C. See “Appendix Attachment A”. Ambient temperature was measured using an air sampler with matching calibrated RTD sensors for dry bulb and wet bulb. The total unit amperage/voltage/wattage (Energy consumption) was taken with transducers calibrated to NIST standards. For the formal instrumentation plan see “Appendix Attachment B”. All the Design Services Network supplied data logging equipment and instrumentation is
calibrated by traceable labs several times a year and is audited by outside agencies in order for the lab to obtain and keep its ISO-17025, CEC, UL, NSF and ARI accreditation. The
temperature devices are checked and calibrated with instruments traceable to NIST standards for accuracy before each new test set-up.
The accuracy of all the instrumentation exceeds the requirements of all UL, CSA, ANSI, ASHRAE and ARI standard requirements for the testing of HVACR and Laboratory type equipment.
The data as shown below was measured and recorded at 10 second intervals.
Measurement Description Units
1 Electrical Freezer Current Amps
2 Electrical Freezer Voltage Volts
3 Electrical Freezer Power Watts
4 Temperature Ambient dry bulb temperature (RTD) °C
5 Temperature Ambient wet bulb temperature (RTD) °C
6 -22 Temperature Inside Case #1 -16 & Condenser Air In #17 °C
2.3 Test Conditions
The refrigerator was tested inside an ISO-17025 and UL/ARI/NSF approved environmental room with controlled temperature. The room was controlled as follows:
Condition Value
Ambient Dry Bulb Temperature 25.00C ± 1.0C
Ambient Wet Bulb Temperature (Equivalent to 60% RH± 5%) 19.44C ± 1.0C Air Flow around Test Unit (for all testing) Less than 50 fpm
Illumination 74.4 foot-candles
Radiant Temperature + 21.1C
Supply Voltage to Unit on Test 230 Volts ± 2% (50hz)
The airflow, lighting, and radiant conditions are measured before, during and after the testing. The ambient and voltage are recorded as data in 10 second intervals with the room/voltage being within the standard required conditions during the test period with an average ambient of
November 16, 2011
Page 6 of 11
2.4 Test Procedure/Test Methods
The test standards where applicable, were followed in accordance to ANSI/ARI-1200-2010 and ANI/ASHRAE 72-2005. The in-depth test procedures as completed can be observed in
“Appendix Attachments B”.
The ambient condition was maintained at 25.0C ± 1.0C dry bulb, and 19.4C ± 1.0C wet bulb (60% RH ± 5%) during all the testing. Data was taken throughout the testing every 10 seconds. After room stabilization was achieved, the units were turned on and the controllers set to -100°C so that the units would not cycle off for the Bottom Out Test. The units were allowed to run until they bottomed out and then run for another two hours.
After the BOT was completed the Reserve Capacity Test was started by applying the live load heaters at the BOT point. First 40 watts was applied and the units allowed to stabilize in temperature and run for another 2 hours. At this point 60 watts of heat was added and the units allowed to stabilize in temperature and run for another 2 hours. This was repeated for 90 watts and then again for 120 Watts.
The heaters were then turned off and the controllers set for -80°C. The units were allowed to control unit temperatures were stabilized and then the Energy Test was started by monitoring the energy consumption of the units for a ten hour period after stabilization.
After the Energy Test, at a point when the controller had cycled the refrigeration systems off, the Warm Up Test was started by shutting the power to the units shut off. They were allowed to warm up and monitored to find the time it took the units to reach the -50°C point at the control sensor and by the average of the inside thermocouples .
3.0
Executive Summary of Test Results
The purpose of this portion of the report is to show in summary the results of the performance testing of the two ESCO units.
3.1 Test Results:
Manufacturer Model Wmain[kW] Time[min] Time[min]
Sanyo MDF-U73V 60Hz 1.11 123.30 111.83
So-Low U85-25 60Hz 1.19 133.16 105.50
Haier DW-86L626 1.02 111.50 102.83
Thermo Scientific Forma 906, 50/60Hz 0.82 210.50 192.50
Thermo Scientific Revco ULT2586-10-D 0.97 192.33 179.83
ESCO USS-668A-1 SN # 2011-54637 Unit #1 0.79 254.50 215.33
ESCO USS-668A-1 SN # 2011-55099 Unit #2 0.71 243.83 213.00
ULTs Comparison Table Energy
Consumption
Warm-Up to -50°C (Sensor TC T16)
Warm-Up to -50°C (Avg. of TCs T1~T16)
Manufacturer Model 0[W] (BOT) 40[W] 60[W] 90[W] 120[W] 0[W] (BOT) 40[W] 60[W] 90[W] 120[W]
Sanyo MDF-U73V 60Hz -88.63 -84.19 -82.21 -77.27 -65.90 -87.27 -81.30 -78.75 -72.72 -62.62
So-Low U85-25 60Hz -89.26 -86.58 -85.45 -83.53 -77.72 -82.19 -78.31 -76.57 -75.26 -68.15
Haier DW-86L626 -85.50 -79.30 -77.35 -73.47 -67.39 -80.68 -76.27 -74.54 -70.69 -67.28
Thermo Scientific Forma 906, 50/60Hz -88.60 -85.41 -84.15 -81.64 -74.92 -84.61 -79.97 -78.36 -75.88 -73.98 Thermo Scientific Revco ULT2586-10-D -89.10 -84.58 -83.18 -81.01 -73.20 -85.81 -80.23 -78.95 -76.93 -73.63 ESCO USS-668A-1 SN # 2011-54637 Unit #1 -92.66 -87.49 -84.44 -79.91 -75.51 -88.88 -84.39 -81.51 -76.95 -72.65 ESCO USS-668A-1 SN # 2011-55099 Unit #2 -89.26 -86.10 -85.17 -83.77 -82.35 -85.97 -82.44 -81.23 -79.18 -76.92
ULTs Comparison Table BTU Reserve
Sensor TC T16 (°C)
BTU Reserve Average of TCs T1~T16 (°C)
November 16, 2011
November 16, 2011
Page 10 of 11
4.0
Performance Data:
The following attached data is the actual data collected during the testing and a comparison of related units.