An Energy Aware Network Management Approach
using Server Profiling in ‘Green’ Clouds
C. Peoples, G. Parr, S. McClean,
B. Scotney and P. Morrow
School of Computing and Information Engineering University of Ulster
Coleraine, Northern Ireland, United Kingdom {c.peoples; gp.parr; si.mcclean; bw.scotney;
pj.morrow}@ulster.ac.uk
S. K. Chaudhari and R. Theja
Department of Computer Science and Engineering Indian Institute of Technology of Madras
Chennai, India
{chaudari; ravitheja}@cse.iitm.ac.in
Abstract—Clouds and data centres are significant consumers of power. There are however, opportunities for optimising carbon cost here as resource redundancy is provisioned extensively. Data centre resources, and subsequently clouds which support them, are traditionally organised into tiers; switch-off activity when managing redundant resources therefore occurs in an approach which exploits cost advantages associated with closing down entire network portions. We suggest however, an alternative approach to optimise cloud operation while maintaining application QoS: Simulation experiments identify that network operation can be optimised by selecting servers which process traffic at a rate that more closely matches the packet arrival rate, and resources which provision excessive capacity additional to that required may be powered off for improved efficiency. This recognises that there is a point in server speed at which performance is optimised, and operation which is greater than or less than this rate will not achieve optimisation. A series of policies have been defined in this work for integration into cloud management procedures; performance results from their implementation and evaluation in simulation show improved efficiency by selecting servers based on these relationships.
Keywords—autonomic content distribution; cloud data centre; context awareness; dynamic configuration; energy tolerance; policy-based management; NS-2; Opnet; self-managing platform.
I. INTRODUCTION
Blade servers, intelligent workload allocation, autonomic content distribution, adaptive virtualised infrastructures and cloud computing technologies are examples of techniques and strategies deployed across data centres to improve operational efficiency in their service provision [1] [2]. Developments in this area are a priority given increase in the number and scale of data centres worldwide to accommodate growth in online services and government reaction to environmental challenges associated with increased carbon emissions [3] [4]. Use of shared resources in clouds and their dynamic re-allocation in response to application workload overcomes the effects of redundancy typically associated with data centres and the cost excesses which are otherwise incurred. Workload allocation schemes for example, consolidate traffic on fewer network devices, allowing portions of unused capacity to be switched off to reduce management costs. In addition, advancements
have also been made in the design of management strategies (e.g., in [5]). From these examples, it therefore becomes obvious that the research community has provided a range of hardware and software solutions to respond to energy efficiency challenges associated with cloud operation.
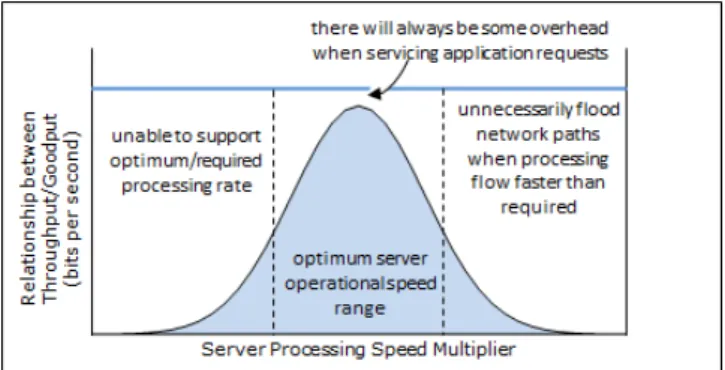
In this paper, we contribute to network management approaches applicable in the data centre and cloud domain, and describe a context aware solution that optimises cloud efficiency by exploiting relationships between server speed and traffic arrival rate – this relationship allows performance and carbon cost to be optimised. Context is collected on the real-time cloud condition, which includes operational characteristics of hardware resources and average traffic flow rates. Load is subsequently allocated in response to energy efficiency concerns and performance requirements. The specific approach followed is based on the following assumption: It may be assumed that the fastest operational speed available is the optimum to respond to client requests most quickly and exploit opportunities where it is possible to improve upon the latency Quality of Service (QoS) requested. We recognise however, that in certain circumstances a higher operational speed will lead to increased energy consumption through influence on packet drop, congestion in the network and subsequent overhead by flooding network links and devices. We therefore acknowledge that there are a range of server speeds for which performance may be optimised when measured in relation to application traffic volume and its transmission rate. Below this speed, servers will be unable to support the optimum/required processing rate, and above this rate, they may unnecessarily flood network paths (Figure 1). A relationship of one between throughput and goodput is optimum, with all throughput being goodput. In reality, however, there will be some deviation from one; the further from one, the less optimum the scenario and the increased need to exploit opportunities to improve operational efficiency. In response to simulation experiments in Opnet [6] which exemplify this situation, we propose a series of policies to select cloud server resources as a result of their operational speed and ability to support application traffic. This algorithm is inserted within an energy efficient Context Aware Brokering (e-CAB) algorithm, proposed by the authors and described in detail in earlier work [7], which is responsible for controlling context collection and enforcing informed decisions
Figure 1 Server Selection Strategy as Function of Speed in response across data centres and clouds. The network management function is presented in this paper with focus on server selection as a function of server profiling characteristics for energy efficiency and application performance objectives.
The paper continues as follows: In Section II, related work is reviewed with the objective of outlining power-aware Management Information Base (MIB) structures, discovery processes which collect context efficiently and operations to achieve energy efficiency. Section III includes a definition of the problem domain to reinforce the way in which we are considering the problem and its influence on the research approach. A network management framework proposed by the authors is defined in Section IV. Its operation is considered across clouds in Section V in response to relationships defined between traffic volume and server operational speed. An algorithm is subsequently proposed; its implementation and experimental results are presented in Section VI, and conclusions and future work are presented in Section VII.
II. RELATED WORK
A number of network management standards for energy monitoring and improved operational efficiency in general have been outlined. The Advanced Configuration and Power Interface Specification (ACPI) [9] for example, defines operational states for power management purposes; system states include ‘Working’, ‘Sleeping’ (and variations), ‘Soft Off’ and ‘Mechanical Off’. A successful ACPI implementation manages the operating system, BIOS and adapter cards. The ACPI is however, not implemented in applications, resulting in inability to manage these components in parallel. If, for example, a device is sent into a sleep state deeper than its bus is expecting, the bus assumes that the device has been removed from the system as opposed to simply sleeping. This therefore occurs in spite of the fact that demand requires components to be managed as a single system to optimise efficiency and operational performance. The Distributed Management Task Force (DMTF) [10] defines the Common Information Model (CIM) [11] which supports power characteristics to manage networks. Devices are specified using the CIM according to whether or not power management is supported, power management capabilities and real-time power state. Benefits of using this system include cost advantages, speed and ease of rolling out a standardised approach to network management. The Common Diagnostic Model (CDM) is an extension of the CIM and defines the health of computer systems across multi-vendor networks. DiagnosticTest is the core class of the CDM;
diagnoses relate to fault analysis and health history, such as error frequency, warnings, test time and resource allocation.
A number of industry-specific power management strategies also exist. Intel’s Intelligent Power Node Manager [12] and Data Centre Manager (DCM) [13] for example, achieve up to a twenty per cent reduction in power use without impact on performance [14]. The DCM performs power and temperature monitoring and management of servers and racks. It summarises network flows recorded by systems managed using the Power Manager and allows network operators to define caps on performance based on server utilisation, the business condition and power consumption. As another example, IBM’s PowerExecutive 2.0 [15] provides capability to manage power consumption in data centres through real-time metering and trending operation over real-time. The system also takes the environmental temperature into account to optimise operation for improved efficiency objectives.
With regard to Management Information Base (MIB) development for energy awareness, several documents have been published as ‘work in progress’ Internet Drafts, such as the ‘Energy-aware Networks and Devices MIB’ [16] and ‘Power and Energy Monitoring MIB’ [17]. These are used in general, to monitor power state and energy consumption of network elements, and maintain detail in a central repository for querying by the network management system to enforce intelligent actions in response. Context discovery processes provide functionality to collect MIB data and a number are identified in the literature, deployed in networks across domains to improve real-time understanding of the network condition. In [18], for example, ‘hello’ messages collect detail on the network condition. Nodes are characterised according to their hop count from the sink, with this information distributed in the ‘hello’ packet. If a node learns that it has a neighbour with a better hop count, it distributes this information in the next series of ‘hellos’ so that an overall network impression may be gained. In terms of energy management policies and actions, there are examples with regard to use of network control for improved efficiency. In [19], for example, service selection occurs as a function of the energy characteristics of mobile devices when a service is requested which could be fulfilled by one of multiple remote devices. Objectives of the policies include optimising the length of time which a service and device are available.
Each of these examples use environment context to apply actions optimised for the networking domain, in general; it is in a similar vein that our work is described here in terms of the evaluation of real-time context for improved cloud operational efficiency. We contribute to related work by identifying a unique approach to allocate load across clouds with the objective of restricting throughput and maximising QoS. Subsequent schemes for improved efficiency may then also be rolled-out for further optimisation, such as shutting down entire network regions and exploiting the cost advantages achievable.
III. DEFINITION OF CLOUD EFFICIENCY PROBLEM From the perspective of calculating power costs in clouds, let us consider a data centre composed of racks containing one or more servers, and switches which inter-connect racks. Each
rack is networked using switches to which all cloud servers are connected. Servers may exist in different operational states for improved efficiency; regardless of the number of active servers however, we assume a constant minimum management cost per rack. We also assume that servers across clouds operate at a range of speeds, and that operational ability of each is not consistent. The way in which these characteristics affect operational cost and the research solution developed in response is considered further in following sections.
A. Server Speed & Influence on Energy Consumed Energy cost at a server is defined in this work using:
serverE = w x pb (1)
where w is the number of operational ports at a device, b the bit rate per port and p the power consumed per unit of data processed at server serverE. Although not considered as explicit
components of the energy cost model in this work, server cost can be further amplified by consideration of the number of packets dropped from the queue due to an insufficient service rate and power consumed per packet before doing so. Furthermore, the energy cost per bit is variable depending on the state in which servers operate (we acknowledge that server power cost varies as a function of its operational mode), and overall server cost includes energy to transition between states. We make the assumption however, that these additional aspects of cost are constant across all servers under consideration in this work and need therefore not be explicitly accommodated.
Carbon cost to operate devices can therefore be affected by physical construction and configuration of hardware. A faster CPU enables faster response time; in certain circumstances, it will however, contribute to higher overhead and longer queuing where links are flooded when packets are pushed out of the device at a rate which cannot be supported. We are therefore interested in identifying those server speeds which reflect its ability to support traffic and influence packet passing onto network links where throughput increases involve application traffic only (goodput) and minimal overhead.
We acknowledge that a range of factors contribute to overall cloud cost, such as the management procedures which allocate workload to servers and more generally, identify faults, monitor performance and dynamically allocate resources. Additional network power will also be required to keep track of all metrics used to drive the management process. Other management costs incurred across the cloud relate to server operation, file/datastore presence and facility operation in the data centre plant supporting the cloud. Inclusion of these attributes will affect results when exploring cloud efficiency in terms of server cost to operate. These characteristics are not, however, taken into account in our model. Instead, we assume that they are constant so that the aspects we are interested in are highlighted. Additionally, the wider range of characteristics associated with general cloud operation and management may not be explored in this work, given use of a simulated as opposed to a live testbed. This is a suitable approach: Our objective is to understand relationships between this attribute range such that they may be applied in management schemes which accommodate a wider metric range.
IV. RESEARCH PROPOSAL
The research approach, the energy efficient Context Aware Brokering (e-CAB) algorithm, is a network management solution proposed for application across domains in converged networks which benefit from improved energy awareness and efficiency due to carbon emissions and operational lifetime concerns. Context awareness describes the real-time state of system conditions so that decisions may be made autonomously and accurately in response to application requests. The ultimate goal is an overall higher level of performance when responding to application requests. Other operational objectives may also be accommodated as a consequence of autonomy driven by context awareness such as, from the perspective of this work, improved operational efficiency. Context awareness is particularly important across clouds, the resources of which are provided using virtualisation strategies. The full benefits of virtual resources can be realised when they are provisioned rapidly, a characteristic made possible by autonomous capability, with performance heightened by the accuracy of decisions made.
The algorithm is presented in this work from the perspective of a module incorporated within the overall e-CAB framework to perform load allocation across clouds as a consequence of server profiling experimentation. This technique is appended to other approaches described in earlier papers (e.g., in [7] and [8]) for application in data centres so that a more thorough strategy, which accommodates a range of challenges across data centres and their associated clouds, may be deployed. In previous work, the objective has been to deploy a management solution which is responsible for influencing the suitability of decisions involving data centre selection when resources in a pool of centres may each be equally able to respond to client requests. The objective in previous work was to make this decision so that lower cost data centres are selected to optimise the overall cost associated with data centre operations, while maintaining a level of performance which, at a minimum, fulfills the requested SLA. In this work, we therefore expand upon the thoroughness of the management solution presented, with a coarse grain technique to select the data centre cloud, and finer grain mechanisms to schedule workload to a specific server.
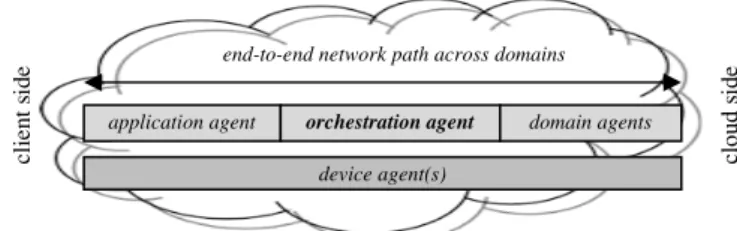
The overall architecture contributing to the research solution consists of several components distributed across end-to-end network paths which are used to achieve context awareness and energy efficiency management (Figure 2). Application agents reside on-board client devices which communicate with data centre cloud servers. Once a device indicates a request to communicate, an on-board device agent becomes responsible for enforcing intelligent configuration
Figure 2 End-to-end e-CAB Architecture application agent orchestration agent domain agents
device agent(s)
end-to-end network path across domains
cl ie n t si d e cl o u d s id e
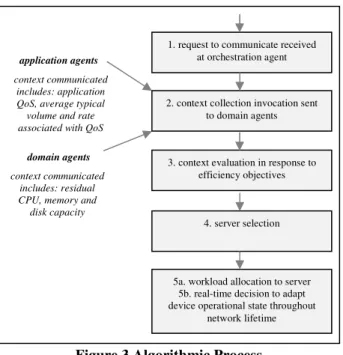
Figure 3 Algorithmic Process
actions such as context collection, transmission configuration and manipulation of device state depending on observed traffic flow rate. MIB attributes are retained for both application (e.g., optimal response latency) and device (e.g., residual battery capacity) agents on the client side of the network, and decisions enforcing efficient actions may be applied to both the application (e.g., transmit now) and device (e.g., request that power supply is connected) entities. Domain agents reside on devices (e.g., servers, routers) deployed in the domain with which communication is occurring, namely clouds within this paper’s research focus, and are responsible for enforcing context collection from each. Context collected from both client and domain sides is returned to the Orchestration Agent (OA), an algorithmic process in the intermediary environment between client and data centre cloud sides, which is responsible for instructing context collection in response to a transmission request from an application agent and its evaluation (Figure 3). Real-time ability to achieve QoS while optimising network efficiency within operational constraints is determined; the network and cloud state definition is made and management decisions involving data centre and path selections are defined. Once transmission begins, attribute monitoring begins to optimise ability to maintain energy awareness and efficiency. Alarms protect against exposure to network events with negative consequences, and action can subsequently be invoked to optimise energy consumption in relation to network constraints and application requirements. The e-CAB’s overall objective is to assess real-time ability to achieve QoS while enforcing decisions which achieve energy efficiency within network and data centre constraints.
A. Server Selection: e-CAB Policies invoked in Clouds for Optimised Performance and Efficiency
A series of policies are proposed within the context of this work for application by the cloud manager, the orchestration agent. When selecting resources across a cloud, consideration must be given to the range of virtualisation actions which may be enforced: A device may, for example, be operating in one of
a number of states for improved efficiency. Such a characteristic should therefore be used in the evaluation process to determine overall device suitability. When selecting a server within a cloud, a server is considered suitable if:
1. The server is in an operational state and power draw is less than power draw by other servers in the cloud; 2. The server possesses capability to respond to
application request, either through default capability or provision of application-specific virtual machine; 3. The server is in hibernation state, all other servers in
the cloud are experiencing the maximum number of I/O operations possible, and the power required to wake and distribute load here is less than the cost to wait for operational servers to become available; 4. The server is in operational state, power drawn by it is
less than power drawn by other servers in cloud, and it has residual resources (queue, memory, CPU) to respond within application QoS requirements;
5. The server has an operational speed which will allow traffic processing within an acceptable latency given application requirements, will not contribute negatively to increasing network overhead in response to the traffic volume arriving, and allows task processing time to be optimised towards a minimum; 6. Switches on path to server are operational and the
power cost per packet is less than the power cost per packet at other switches on network path;
7. Queuing delay at switches on path to server is less than that incurred at other switches in network; 8. Bandwidth availability on path to server is sufficient
to support application requirements.
This series of policies is specific to the challenge of load assignment in response to job arrival rate, workload volume and server operational speed, and are chronologically executed to allow an optimised decision to be made. Policies which are important from the context of our work also accommodate the server speed in the decision-making process. A more diverse range of policies are therefore shown here to reflect contributors of the overall framework for completeness.
V. OPNET IMPLEMENTATION &EXPERIMENTAL RESULTS Relationships can be defined between performance attributes to understand the impact of traffic flow on network operation given the way it has been physically configured. In certain circumstances it is possible to optimise operational efficiency by influencing paths and devices used as a function of their operational capability and characteristics. A device with residual memory and CPU processing capability insufficient given the volume of traffic arriving for example, may experience higher power consumption in relation to the level of service achieved by attempting to service traffic arriving. In this section, we therefore explore these relationships such that policies may be defined to optimise operation in relation to traffic flow. This relates specifically to the cloud and data centre domain in terms of load allocation as a function of the
domain agents application agents
context communicated includes: application QoS, average typical volume and rate associated with QoS
context communicated includes: residual CPU, memory and disk capacity
1. request to communicate received at orchestration agent
2. context collection invocation sent to domain agents
3. context evaluation in response to efficiency objectives
4. server selection
5a. workload allocation to server 5b. real-time decision to adapt device operational state throughout
server processing speed multiplier. The overall research objective is to achieve a scenario where server task processing time, end-to-end communication time and network overhead are minimised while CPU utilisation and volume of application traffic arriving at the client are improved.
To assist policy definition for autonomic cloud management by the e-CAB, experiments in Opnet [6] explore the effect of server speed in relation to traffic volume, impact on application performance and any negative impact on throughput. Experiments are conducted with the premise that if servers are configured to higher/lower speeds than required given the packet arrival rate, the rate at which jobs are processed and task response time will be affected; in certain circumstances this will also contribute negatively to overhead. It is our objective to define policies which minimise this effect.
A. Experimental Set-up (Opnet)
Simulation configurations in Opnet therefore include a variable CPU speed, which is a configurable attribute in this modelling environment. We distinguish between two rates of operation at servers. Their operational speed, defined in Megahertz or Gigahertz, conveys ability to process workload per unit of time (typically one millionth or billionth of a second). This server speed can however, also be adapted using a multiplier to ramp up the actual operational rate. We make an assumption work that the base server speed is constant across all devices. As the multiplier is the variable element between servers, it is on this characteristic that decisions are made by the management system when allocating workload. Multiplier speeds of 0.5, 1, 2, and 5 have been applied to demonstrate operation under a range of conditions. Servers selected in Opnet include HP, IBM and Dell models, and are connected to a client via a 100BaseT (100Mbps) Ethernet link. Consistency of CPU speed between real and simulated server models has been validated to ensure accuracy of models in our experimental set [20]-[22]. Thirty-six load volumes are applied as application flows, which comprise Opnet’s default FTP, HTTP and e-mail traffic patterns. Loads are transmitted in ‘low’, ‘medium’ and ‘high’ volumes: ‘high’ FTP flow for example, comprises a constant 50,000 byte transmission with an inter-request time of 360 seconds. ’Low’ e-mail flow on the other hand comprises constant 500 byte files, with an exponentially distributed send inter-arrival time of 3,600 seconds. Performance attributes of interest in this experimental set include application load arriving at clients from servers, traffic volume passing through server transmitters, server task processing time, MAC queue size, TCP/IP load, and variation of these attributes as server speed increases. Where increases in TCP load are observed, for example, the optimum scenario is one where this occurs in parallel with increase in application load. Those multiplier speeds where TCP load increases at a rate which is not proportional to the rate of increase in application load will indicate those which are not optimum. B. Experimental Results (Opnet)
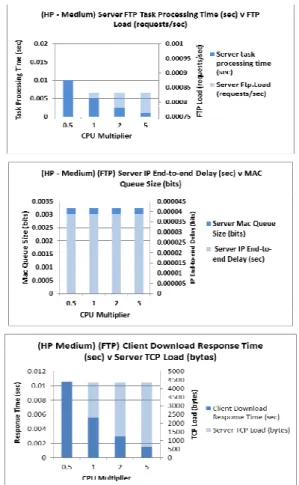
Experimental results highlight instances where server speed is not influential over performance given traffic volume and network conditions. In such circumstances, server task processing time and CPU utilisation are inversely proportional
to the multiplier speed (1/α CPU speed) while traffic volumes are constant (Figure 4). As speed increases, servers process traffic more quickly, packets spend less time retained in the device, and minimum overhead is transmitted due to ability to respond to packets without delay. MAC queue size is constant because there is not any change in client IP traffic. The CPU multiplier in this instance will not affect traffic volume but processing time because residual resources accommodate all traffic fully without loss or delay other than that incurred when traversing links. Client download and upload response times are the only attributes affected. As this is in a positive manner, we conclude that server operational speed need therefore not be taken into account in such scenarios.
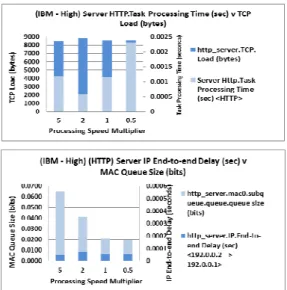
As volume and rate of traffic sending increases, operational change in network performance is observed (Figure 5). Under these operating conditions, relationships between performance attributes are not directly proportional and do not change as clearly in parallel with processing speed. Server task processing time for example, is lowest when the speed of two, and not when the maximum of five, is applied. The volume of HTTP load supported at the server is consistently high for both scenarios which use processor speeds of two and five. The volume of overhead traffic transmitted (server TCP load (bytes)) however, and end-to-end delay associated with IP traffic is highest when a speed of two is applied and lower with a speed of five. IP traffic volume across the network is highest when the multiplier speed of five is applied. The operational
Figure 4 HP Server – FTP ‘Medium’ Load – Key Performance Indicators (KPI)
Figure 5 IBM Server – HTTP ‘High’ Load - KPIs speed of two more closely matches the rate at which packets are transmitted during the HTTP transfer. Overhead is therefore that which is necessary to support application requirements. As the processing speed multiplier increases however, the volume of IP traffic sent increases, as do task processing time and MAC queue size. Network ability to support the application transmission rate and a higher degree of overhead and latency is observed. The cost overhead of selecting a server which operates at a faster rate therefore compromises the efficiency with which operation takes place.
As a consequence of such relationships, we suggest optimum servers in each scenario (Table 1). In the case of the FTP ‘low’ scenario for example, the highest volume of traffic is passed between server and client with the lowest TCP overhead load when the multiplier speed 0.5 is applied. This is therefore the optimum configuration for this scenario. A higher multiplier speed is closer to optimal as traffic volume and its sending rate increases. Server selection procedures may therefore be generalised into policy rules based on an understanding of network operation. Where packet arrival rate is less than the minimum speed of any servers available, the server may be selected as a function of other characteristics such as, for example, CPU utilisation, environment temperature or network faults. As the transmission rate increases to one which exceeds the minimum processing rate at any server, one should be selected which most closely meets the packet transmission rate. Where the packet transmission rate exceeds the maximum processor speed multiplier available, the fastest server may be selected and the associated costs incurred when this is the only option. Selecting the highest processing speed multiplier is not the optimal situation: in certain circumstances, this contributes negatively to overall network operation.
VI. PROOF OF CONCEPT
As a consequence of Opnet findings, the context-aware e-CAB algorithm has been designed for intelligent server selection (Figure 6). Within this algorithm, it is important to first identify if servers possess sufficient residual capacity to support application workload before speed is considered. Regardless of its operational speed, this will be irrelevant if it
cannot support load arriving. In a strategy developed to optimise the efficiency of operations, this decision to prioritise analysis of server capacity recognises that energy efficiency should not be achieved at the expense of application QoS – it is more important to achieve application QoS and contribute to user Quality of Experience (QoE) than maximise energy efficiency in all instances. In the event that sufficient residual capacity does not exist at operational servers, ability to wake a sleeping server is reviewed. Once sufficient residual capacity at a device has been identified, server speed is next evaluated. Servers are selected as suitable if:
1. They operate at a rate greater than the rate at which packets arrive and there are other servers present which operate at faster speeds, or
2. There are not servers which operate at faster speeds than the rate at which packets arrive and the fastest server being considered is the maximum available. Resources are then evaluated in terms of server power draw, utilisation (where utilisation is the relationship between the number of jobs in the server queue (bytes) divided by the queue service rate (bytes processed per second)), power cost per packet, and performance and operational characteristics on the path to the server. The server and path selected is the one which best meets the traffic arrival rate and is the lowest cost path overall. In instances of elastic network traffic which uses the maximum amount of bandwidth available, the selection of a
Table 1 Optimum Server Selections in Opnet Scenarios Increasing transmission volume ->
E-mail FTP HTTP
High 0.5 1 5
Medium 0.5 0.5 1
Low 0.5 0.5 0.5
Context known in advance of transmission configuration: Total volume of traffic leaving client
for 1->n, where n is total number of awake servers within cloud do 1. Identify (awake) servers with residual capacity to fulfill application volume
If residual queue (bytes) > application queue requirements (bytes) then if job will be passed through queue within latency acceptable to application when
measured as a function of current utilisation and service rate then Identify operational speed of servers; calculate relationship to determine overall
operational rate r of server: r = c x s
where c is the CPU speed of server and s the multiplier speed (CPU speed is constant for all servers and it is assumed that c = 1000pkt/sec)
Select server with operational speed which can best meet application requirements: Cloud capacity considered in terms of server operational speed: low (0.5), medium (1/2/3) and high (5/6); Applications classified according to traffic volumes: low (4-384 kbps), medium (10KB-10MB) and high (10MB+). The solution matches low application
volumes with low server speeds, and so on. if several suitable servers exist then
Select that which is physically closest and which will allow utilisation to be further increased within its recommended maximum utilisation (with the design objective of
avoiding under-utilising a greater number of server devices, and allowing some to be turned off when their residual processing capacity is not required)
or: 2. Evaluate ability to wake sleeping servers
With server selected based on relationship between server speed and traffic volume, using strategy outlined above
Output: Server selection which best meets application requirements such that cloud throughput associated with application transmission overall will be minimized and
QoS of the application request maximized; direct client transmission here
server based on traffic arrival rate remains suitable: Where the maximum amount of bandwidth is consumed, the server operational rate which most suitably accommodates the traffic arrival rate will be selected to service arriving workload.
As a consequence of Opnet findings, the e-CAB algorithm has been designed for intelligent server selection. From the design of this algorithm, it becomes obvious that it is proposed on the basis that it is not our research objective to dynamically reconfigure servers based on throughput patterns but rather to allocate load across clouds based on server configuration as a function of their speed. (We acknowledge that it is not possible to dynamically change the multiplier, and its setting occurs as a one-off operation during the BIOS configuration.)
A. Experimental Set-up (NS-2)
The e-CAB algorithm has been implemented in NS-2 [23] due to its extensibility specific to our research objectives. In the implementation, we assume constant server characteristics across the cloud, varying only in the multiplier speed. Extensions to the modelling environment therefore include provision of a multiplier to influence queue processing, making the assumption that overall service rate is proportional to queue service rate. We also assume that client transmission volume is known in advance of its arrival at the cloud, that context is collected prior to job arrival, that servers may exist in one of three operational states (awake, idle and sleep), and that all servers are equally able to respond to client requests.
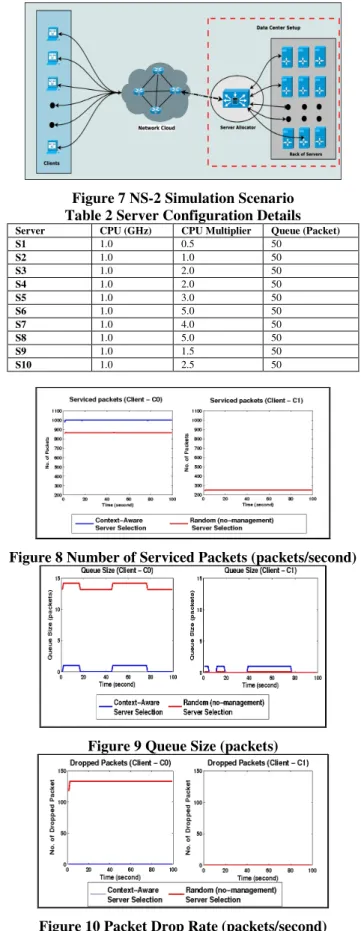
The simulation set up (Figure 7) shows a Server Allocator which assigns servers to clients according to service requirements. For evaluation, a scenario comprising ten servers, each with a maximum queue length of fifty packets, is configured for communication with clients operating at a rate of 8 (client C0) (1000 packets/sec) and 2 (client C1) (250 packets/sec) Mbps respectively. We assume a CPU speed multiplier applied to a service processing rate of 1,000 packets per second. Performance is evaluated when intelligent server selection occurs in relation to instances when context awareness is not applied. Multiplier speeds between 0.5 to 5.0 have been applied across servers (Table 2).
B. Experimental Results (NS-2)
From the performance analysis, we found that when servers are allocated randomly (without management) to a client request, there is an increase in packet drop, whereas when servers are allocated using a context-aware approach, the utilisation of servers is increased and there are fewer packet drops. Figure 8 shows the number of serviced packets for context-aware versus random server allocation; the number of serviced packets for client (C0) is comparatively higher for context-aware server selection whereas it is almost same for client (C1). This is because when a server is allocated in respect of client traffic load, the server is able to accommodate full load whereas the server allocated otherwise does not match the processing rate as closely. Figure 9 shows the queue size for both server selection methods. For client (C0), there is either 1 or 0 queue size at the intelligently-selected server whereas a larger queue builds at the randomly-allocated server. Also, there is no packet loss when the server is allocated using the context-aware approach (Figure 10). The complete results
presented (Table 3) are averaged over 15 runs. The results show that there is 13.32% packet drops when random server allocation method is applied. This network management
Figure 7 NS-2 Simulation Scenario Table 2 Server Configuration Details
Server CPU (GHz) CPU Multiplier Queue (Packet)
S1 1.0 0.5 50 S2 1.0 1.0 50 S3 1.0 2.0 50 S4 1.0 2.0 50 S5 1.0 3.0 50 S6 1.0 5.0 50 S7 1.0 4.0 50 S8 1.0 5.0 50 S9 1.0 1.5 50 S10 1.0 2.5 50
Figure 8 Number of Serviced Packets (packets/second)
Figure 9 Queue Size (packets)
Table 3 Simulation Result Summary
Server Selection Method Client
ID Total Packet Count Packets Serviced (%) Packets Dropped (%) Context Aware C0 99,900 100 0 C1 24,975 100 0 Random C0 99,900 86.68 13.32 C1 24,975 100 0
approach therefore improves cloud efficiency by maximising resource utilisation and optimising cloud operation in more general configuration procedures.
There are subsequent implications on operational efficiency of the overall cloud as a consequence of server allocation in response to application requests. Where devices are not able to service applications at a rate sufficient given the pattern of packet arrival, inefficiencies result from increased dropping and subsequent contribution to throughput in addition to goodput. In this network management approach, validation of improved operational efficiency in clouds by observing relationships between traffic volume and server operational speed is therefore achieved.
VII. CONCLUSION &FURTHER WORK
Through experimental work in Opnet and NS-2 simulation environments, we have gained appreciation of the effects of server operational speed on ability to respond to application requirements, the effect of this relationship on network throughput, and subsequent implications on the operational efficiency of clouds. An algorithm designed to allocate workload as a function of application traffic volume and server speed devices demonstrates ability to positively influence efficiency within the cloud by restricting packet loss and ensuring that residual server capacity is appropriately assigned to traffic patterns. Two different simulators were used to support investigation in this work due to the capabilities of each and their extensibility for our research requirements. Opnet, for example, supports ability to experiment with adaptation of server processing speed and server ability to support the traffic arrival rate. NS-2, on the other hand, supports an easily extensible operating environment which accommodates our research objectives.
Performance results captured in this work are effective estimators of impact on energy consumed due to use of a simulated as opposed to a live testbed. Traffic flow patterns reflect energy consumption due to the energy model used in this work (Eq. (1)): We do not accommodate server cost to transition between modes of operation, for example, when evaluating overall cloud cost. The performance metrics used are therefore effective in relation to our research objectives.
In exploring the problem through simulation, we are unable to model all impacts on cloud operation which arise from intelligent load allocation in relation to server operational speed which may affect power consumption and energy efficiency. These include for example, the effect of traffic flow increase on environment temperature and the carbon cost disadvantages that this introduces. In order to make a more definitive impact with regard to load allocation strategies for improved efficiency as a function of server speed and traffic
volume, integration of the network management approach will ideally be applied within a live test bed as part of future work.
ACKNOWLEDGMENT
This research is supported by the India-UK Advanced Technology Centre of Excellence (IU-ATC) in Next Generation Networks, Systems and Services, funded by the UK EPSRC Digital Economy Programme and Government of India Department of Science and Technology.
REFERENCES
[1] A. Mehta, M. Menaria, S. Dangi and S. Rao, “Energy Conservation in Cloud Infrastructures,” in Proc. of IEEE Int. Systems Conf., Apr. 2011, pp. 456-460.
[2] U. Lee, I. Rimac, D. Kilper and V. Hilt, “Toward Energy-Efficient Content Dissemination,” in IEEE Network, Mar/Apr. 2011, Vol. 25, Iss. 2, pp. 14-19.
[3] HM Treasury, “Autumn Statement 2011,” Nov. 2011; Available: www.hm-treasury.gov.uk.
[4] Government of India, “Key Features of Budget 2012-2013,” Mar. 2012; Available: indiabudget.nic.in.
[5] M. Adachi, T. Hiraoka and N. Komatsu, “A Study on a Resource Allocation Algorithm for On-demand Data Center Services,” in Proc. of Int. Conf. on Advanced Comm. Technology, Feb. 2008, pp. 295-300. [6] Opnet, “Opnet Modeler Accelerating Network R&D (Network
Simulation)”; Available: http://www.opnet.com/.
[7] C. Peoples, G. Parr and S. McClean, “Context-aware Characterisation of Energy Consumption in Data Centres,” in Proc. of IEEE Int. Workshop on Management of the Future Internet, May 2011, pp. 1250-1257. [8] C. Peoples, G. Parr and S. McClean, “Energy-aware Data Centre
Management,” in Proc. of National Conference on Communications, Jan. 2011, pp. 1-5.
[9] Hewlett-Packard Corporation, Intel Corporation, Microsoft Corporation, Phoenix Technologies Limited, and Toshiba Corporation, “Advanced Configuration and Power Interface Specification,” Revision 4.0a,. 2010. [10] Distributed Management Task Force; Available: www.dmtf.org. [11] Distributed Management Task Force, “CIM Schema,” Feb. 2011. [12] Intel, “Intel Intelligent Power Node Manager”; Available:
www.intel.com/technology/nodemanager/.
[13] Intel, “Intel Data Center Manager”; Available: software.intel.com/. [14] Intel, “Data Center Energy Efficiency with Intel Power Management
Technologies”; Available: http://software.intel.com/. [15] IBM, “IBM PowerExecutive”; Available: www-03.ibm.com.
[16] J. Parello and B. Claise, “Energy-aware Networks and Devices MIB,” ‘work in progress’ as IETF Internet Draft, Oct. 2011.
[17] M. Chandramouli, B. Schoening, J. Quittek, T. Dietz and B. Claise, “Power and Energy Monitoring MIB,” ‘work in progress’ as IETF Internet Draft, May 2011.
[18] A. Barnawi and R. Hafez, “A Time and Energy Efficiency Topology Discovery and Scheduling Protocol for Wireless Sensor Networks,” in Proc. of Int. Conf. on Computational Science and Engineering, Aug. 2009, pp. 570-578.
[19] J. Furthmüller and O. P. Waldhorst, “Energy-aware Resource Sharing with Mobile Devices,” in Proc. of Int. Conf. on Wireless On-Demand Network Systems and Services, Jan. 2011, pp. 52-59.
[20] Dell, “Dell PowerEdge 6600 and PowerEdge 6650 Servers”; Available: www.dell.com/downloads/global/products/pedge/en/66x0_specs.pdf. [21] HP, “HP Rack-optimised Servers Build your Always-on Infrastructure”;
Available: http://www.spectra.com/pdfs/rp5430_rp5470.pdf.
[22] IBM, “pSeries 640 Model B80”; Available: http://www-03.ibm.com/systems/power/hardware/pseries/entry/p640/index.html. [23] NS-2, The Network Simulator; Available: http://www.isi.edu/nsnam/ns/.