Broadband Internet Access, Awareness, and Use:
Analysis of United States Household Data
Dale Hatfield, Michele H. Jackson, Tom Lookabaugh Scott Savage, Doug C. Sicker, Donald Waldman
University of Colorado, Boulder
Abstract
Data obtained from a nationwide survey of US residences during 2002 are used to investigate household awareness of high-speed Internet access, profile Internet access and use, and gain insight into how important “always on”, cost, speed, installation and reliability attributes are in choice of service. Preliminary analysis suggests relatively high awareness of cable modem and DSL availability. Almost 19 percent of the sample have high-speed connectivity, and the mean price paid per month for dial-up and high-speed access is $17.51 and $40.76, respectively. Preference for high-speed access is apparent among households with higher income, college education, and multiple PCs. 63 percent of high-speed users have more than five years of online experience, compared to 48.2 percent of dial-up users, and high-speed users are two times more likely to share music files and photos, bank, trade stocks and pay bills “many times a week” than dial-up users. Reliability of service, speed, and always on are important attributes to high-speed and experienced online users.
February 8, 2003
We thank seminar participants at the PTC Conference 2003, Honolulu, January 19-23, 2003, for helpful
comments. Contact: Scott Savage, Department of Interdisciplinary Telecommunications, University of Colorado, Boulder, CO, 80309-0530.
I. Introduction
There is some ambiguity about the current state of residential broadband deployment and uptake in the US. Recent estimates from the BLS (2001), Grant (2002), NTIA (2002) and FCC (2002a) paint a reasonably conservative picture, indicating about 10 to 15 percent of
households subscribe to broadband Internet at 2002/03. Pepper (2002) is more upbeat and suggests broadband Internet subscription rates during the “early adopter” period from 1998 to 2001 have outpaced color television, cellular telephone, pagers and VCRs. In a similar vein, J.P. Morgan (2001) forecast strong growth in residential broadband subscribers to 48 percent of households in 2005. The policy debate on US broadband uptake depends, in part, on sound empirical analysis of broadband Internet awareness and access, and specific information about consumer behavior toward broadband Internet subscription. Besides econometric studies of Internet access choice by Goolsbee (2000), Rappoport et al (2002), and Varian (2002), which consider the trade-off between access speed and subscription price, there is limited objective research examining the service attributes preferred by consumers, and their demographics.
This study uses data obtained from a nationwide mail survey of US residences during September and October 2002 to examine residential demand for broadband Internet access. Survey data are used to investigate consumer awareness of Internet access service, profile residential Internet access and use, and gain insight into how important “always on” connectivity, cost, speed, installation and reliability attributes are in household’s choice of service. Empirical results provide information for the design, pricing and marketing of more effective Internet access services, and may also prove useful for policy makers debating the “digital divide” and policies that promote access to the Internet, e-commerce, e-government, e-health and educational opportunities. Section II provides a user’s definition of broadband,
and a discussion of broadband Internet attributes, applications and content is provided in Section III. Section IV describes the survey questionnaire and data collection. A profile of residential Internet awareness, access and use is provided in Section V, and Section VI presents conclusions
II. Broadband Internet
Broadband (or, high-speed) Internet access can be up to 50 times faster than dial-up access so that interactions such as downloading a web page are noticeably quicker. Broadband is always on, meaning that a user does not need to make a dial-up telephone call to connect to the
Internet. Further, the user is not required to purchase an additional telephone line (i.e., separate line with a different number) or cable line for transport between the home and the Internet backbone.
Two common ways to obtain broadband Internet access are with a cable modem provided by a cable company, or a digital subscriber line (DSL) provided by a telephone company, and signing up for a service plan at additional cost over traditional cable-TV and telephone services from these providers. DSL uses copper telephone wires with a computer digital network to provide high-speed Internet access without the need for a fiber optic
transport line from the residence or place of business. Cable uses the traditional coaxial cable for transport to and from the residence.1 In some geographical areas, broadband is also available through fixed wireless and satellite providers. With wireless, line-of-sight
transmission towers connected to the Internet send and receive information to and from your
1 Note that some communities do not consider DSL or cable modem rates as being sufficiently high to be called
broadband. For instance, Technet define broadband as 100 Mbps. While recognizing there is variation in the bit rates used by academia, industry and policy makers, we employ the FCC’s (2001) definition of high speed services (at least 200 kbps in at least one direction), which is consistent with DSL and cable modems.
personal computer (PC) and the Internet backbone. Satellite Internet is similar to satellite TV. Users send and receive information to the Internet backbone via their satellite dish and a receiver in space.2
Although exact capabilities vary by service provider and the type of service purchased, high-speed Internet access is often used for web browsing with quick response times, transfer of video images and CD quality audio files over the Internet, quick downloads of large files, playing real-time interactive games with people in different locations, and providing efficient access for others on the Internet to large audio, text and video stored on local PCs.3 Broadband opens up a new multimedia world that provides all Internet users with access to large audio, graphic, text and video files stored on local PCs. That information can then be translated into traditional forms of entertainment and information such as TV shows, movies and radio.
III. Internet Attributes and Applications
Microeconomic theory states that rational consumers prefer goods and services that maximize their utility. The decision process starts with an awareness of a particular need. After some search and learning, the consumer forms a utility function which involves the valuation of goods and attributes, and the trading off of attributes involved in the decision process. The utility function provides a preference ordering for goods or attributes which allows the consumer to decide which goods to purchase given income, time and other constraints. A
2 While some satellite systems still use a telephone line back channel, many of the newer systems use a satellite
back-channel with VSAT technology.
3 Many industry players and associations overstate current high-speed capability when they say DSL and cable
modems are capable of transferring “crisp” video images. Cable modems are theoretically capable, but it depends on the traffic engineering, throttling, and channel sharing, and the kind of sustained rates needed for good video are probably rarely obtainable. DSL is often sold at rates that simply can t deliver high quality video.
summary of important Internet access attributes is provided below, along with a brief description of potential Internet applications and content.
A. Attributes
Internet access costs include the access price, and switching costs incurred when choosing a new access plan over an existing plan. The price of Internet access has two components. The first component is the transport cost from the home PC to the Internet backbone which is typically paid to traditional telephone and cable companies such as Qwest, Verizon, AT&T Broadband, Time-Warner Cable (TWC), etc. Many dial-up users purchase a second telephone line solely for Internet access and leave their primary telephone line for voice traffic. For these users, Hausman et al (2001) estimate the marginal cost of transport to the Internet backbone (i.e., the cost of an additional line dedicated to Internet access) is $7.70 to $47.62 at August 1999 with installation costs varying from $16.90 to $55.30. For residential customers who do not use a second line, the marginal cost of transport is zero. High-speed customers are usually only provided a service with a single bandwidth level. Those wanting more speed must pay a higher monthly price for service with greater bandwidth.4 The second price component is the monthly subscription charge to Internet service providers (ISPs), such as AOL, MSN, and Roadrunner, who provide “user-friendly” portals to the wide array of activities, information, and services available on the Internet and world wide web. The predominant ISP pricing plan is a flat monthly subscription charge that offers unlimited access and use of the Internet for a given level of bandwidth.
4 Cable and telephone companies “version” services by offering different prices for different bandwidths with the
Flat-rate subscription charges range from $15 to $25 per month for dial-up Internet access and approximately $10 to $200 per month for broadband (Ames 2002).5 At December 2001, monthly prices for cable and DSL access averaged $39.40 (compared to $44.22 in
January 2001) and $51.67 (compared to $47.18 in January 2001), respectively. Consumers can purchase packages which include both the transport line and the ISP. For example, Qwest offer “MSN broadband” which includes DSL transport from Qwest and MSN ISP service for $39.95 per month for 256 kilobits per second (kbps)/256kbps. Alternatively, consumers can purchase DSL transport from Qwest for $21.95 and select their own ISP.6 Installation costs for cable and DSL include about $100 to $200 for a modem, $50 to $100 for installation, and a $0 to $50 for account activation. Both cable and DSL providers offer many different promotions and service tiers which leads to large variation in installation costs across consumers. For instance, Qwest provide unlimited use of a DSL modem for $49.95 per month instead of $39.95 when the modem is purchased, while customers using AT&T Broadband’s modem pay $45.95 per month instead of $35.95 when they purchase their own modem.
Switching costs derive from contractual commitments, installation costs (including the implicit costs from concern about technical difficulty of installation), training costs (including implicit costs from concern about the technical difficulty of learning and maintaining the service), search costs, and psychological costs (for instance, consumers may not trust their local-exchange carrier (LEC) or may be uncertain about the financial viability of new DSL market entrants). Changing from one ISP to another also requires subscribers to change their
5 Some consumers are able to obtain discounted broadband access by buying two or more services from their cable
company. For instance, TWC customers who purchase a package of broadband Internet access through Road Runner and digital cable pay about $40 per month for Internet access compared to non-digital cable subscribers who pay about $50 per month (Black 2001).
6 Large cable multiple system operators (MSOs) such as AT&T and TWC have exclusive contract rights with Excite@Home (now AT&T Broadband Internet service) and RoadRunner, respectively, to provide residential broadband services access over their transport facilities. To access an alternative broadband ISP instead of the ISP affiliated with the cable provider, a user of broadband cable access has to pay ‘twice’ (Hausman et al 2001).
email address. Here, switching costs include a charge to have future emails re-directed, the costs of informing all correspondents of your new address, and potentially, the cost of lost business. Switching costs may be mitigated to some extent for dial-up users by the reduction in ISP costs and the removal of the unneeded second line.
Speed describes the time it takes to send and receive information to and from the home computer and/or device. Different providers of service can supply different amounts of bandwidth and speed. Dial-up service is typically provided through a analogue telephone line and modem with limited capacity and relatively slow data transmission rates (28 to 56 kbps) (GAO 2001). Broadband connection, provided by DSL, cable modem, fixed wireless and satellite, offers transmission rates up to 20 to 50 times faster than a traditional dial-up connection, and better access to bandwidth-intensive content. Broadband definitions vary widely but generally refer to “significantly faster data rates than narrowband” with always on and two-way functionality. With respect to transmission rates, the FCC (2001) define
broadband as having the capability of supporting, in both the provider-to-consumer
(downstream) and the consumer-to-provider (upstream) directions, a speed in excess of 200 kbps in the last mile. Most cable and DSL service packages are asymmetric with the
downstream speed faster than the upstream. While downstream speeds for cable are extremely high at around 1.5 megabits per second (mbps), upstream speeds are often in the range of 128 to 384kbps. A basic DSL account with ISP at $49.95 typically has downstream and upstream speeds of 640kbps and 256kbps, respectively. Symmetric speeds for DSL can be obtained by spending about $66 per month (640kbps) and $88 per month (1mbps) on premium plans. Limitations in actual upstream and downstream speeds of existing services may affect
broadband subscription rates, and the pricing of different service levels – consumers may be concerned that existing services are not really “broadband enough.”
Always on functionality provides users with Internet connectivity whenever their computer is on, and saves about 30 to 45 seconds from dialing-up a telephone call and establishing connection. Always on eliminates the risk that a connection will not be made (since most dial-up ISP s use shared modem pools and occasionally they simply cannot make the connection), and the risk that ISP’s will use “timeouts” to log people off dial-up
connections. Since broadband Internet access is always on and allows simultaneous
transmission of Internet and voice traffic, the always on attribute has also become synonymous with the convenience of using the Internet and making telephone calls at the same time. Integrated delivery of data, video and voice services eliminates busy signals and dropped connections during Internet sessions, and eliminates the need for an extra telephone line dedicated to Internet access.7 Dial-up Internet users may be able to create a similar feature by linking “call diversion” and “call waiting” to cellular telephones and V.92 modems. V.92 is being marketed as a less expensive “broadband like” experience, promising residential
consumers faster Internet connections of about ten to 15 seconds, faster upstream transfers, and simultaneous access to the Internet and the telephone. While always on can potentially
introduce additional privacy and security concerns, consumers can alleviate these concerns by installing software to “firewall” customer equipment for relatively small cost of $20 to $50. Telecommuters will have to consider more advanced and costly means for home network security, online reliability and even privacy protection to secure sensitive data files.
7 Always on can increase Internet use. Crandall and Jackson (2001) suggest that when a user has a quick impulse
to check the www for data, using a connection that is already established, rather than establishing a dial-up connection, improves the response time by nearly tenfold.
Some Internet access plans are very reliable. Users can count on the service being available whenever they want to use it, and any problems that do arise are immediately handled by good customer service. Other plans are less reliable. The user may occasionally be
disconnected (i.e., a service outage), delivered access may not meet advertised speeds and functionality (for instance, the ability to support multiple PCs through home networks), customer service is slow, and accounts may be transferred from one company to another. Concerns about the behavior and sustainability of firms in a chaotic industry with many recent bankruptcies and company consolidations has potential to undermine consumer confidence in broadband. Further, with many DSL providers exiting the market in 2000 and 2001, consumers may be wary of new entrants. This leaves consumers with fewer choices and means the
incumbent LECS such as SBC, Qwest, BellSouth, or Verizon are perhaps perceived the most reliable DSL providers.
Ease of installation reflects the time, cost and complexity of ordering and installing a broadband connection. While DSL installation has historically been associated with
configuration problems, trouble-shooting, and repeated visits by under-trained technicians, both cable and DSL providers appear to have streamlined this process in more recent times.
Nevertheless, it can take up to two weeks to get a technician-assisted installation (“truck-roll”) for DSL, while the average wait for cable is about two days. Many cable and DSL providers will provide free installation, but this does not free the residential consumer from the
inconvenience costs of on-site visits. A trend toward self-installation kits and “plug-and-play” modems reduces company and consumer monetary and time costs by reducing the number of truck rolls (Gill 2002).89 Cable providers sell do-it-yourself installation packages at electrical
8 Plug and play installation provides automatic configuration of computer hardware, software and devices.
retail stores for around $30. While DSL is not exactly plug and play, technically astute consumers may be able to complete their own setup since some DSL providers sell self-installation kits with modem, cables, and necessary software, while others waive self-installation fees when you do it on your own. For most users, installation of broadband access will require a technician to visit their home and install new wires and equipment. Sometimes the technician may have to return several times to solve configuration problems, and for trouble-shooting.
B. Applications and Content
Though many customers are enthusiastic about always on, high-speed Internet access, broadband specific applications such as real-time video programming, video on-demand (VoD), customized music and video sharing, real-time radio programming, interactive multi-player gaming, high-speed telecommuting, and interactive advertising and e-commerce videos are sparse (Backover 2002, Hausman et al 2001). Many of the consumer applications driving broadband access such as e-mail and instant-messaging (IM), electronic stock brokerage, financial services, consumer travel, online shopping, interactive TV and entertainment, gambling, and Internet and video telephony are available though dial-up access (BLS 2001, Hellerstein 2001, Ordover and Willig 1999). Given current broadband content and
applications, many users may be satisfied with their connection at work for IM and bandwidth intensive applications, and use dial-up at home for e-mail.10 Here, it may be significantly cheaper to pay for a second telephone line than upgrade to a broadband connection.
technician. You just connect your computer to the phone jack, insert the appropriate software, and within 15 minutes you have access to the Internet.
9 Road Runner’s cable installation involves installation of hardware and software necessary to use their service, a
brief training session, and the presentation of manuals and guides for the new subscriber.
10 Broadband is particularly helpful for IM, since IM relies on always on functionality to distinguish it from email
Many industry analysts argue that no “killer app” has been developed that justifies the cost of broadband access when consumers primarily use the Internet for e-mail, IM, and online shopping. Napster’s inability to provide a legally viable service that allows online users to share copyrighted music shows how legal uncertainty can curtail a bandwidth-intensive service. At its peak in 2000, Napster had 64 million users trading billions of MP3 encoded files a
month. To download, store and listen to the file, consumers purchased CD burners and larger hard drives, and high-speed cable modems and DSL connections to get the songs in the first place (Varian 2002, Borland 2001). As such, there may be a perceived, or real, absence of interesting content or applications that need broadband access speeds. Despite such concerns, it may not be necessary for a killer app to emerge at this time since the cumulative effect of improved application usability over the normal applications employed by a dial-up or
broadband user may be sufficient to motivate broadband adoption. In fact, we almost have to assume this is the case to understand why broadband adoption is currently occurring at all.
IV. Survey Questionnaire and Data Collection
Data are obtained from a nationwide mail survey of US residences during September and October 2002. The survey questionnaire comprised of three sections: cognitive buildup; choice task; and demographics. Cognitive buildup asks respondent’s 15 questions about their access and use of IT and the Internet, and provides them with information to form preferences about Internet access service. Respondents are then required to evaluate eight choice questions, and provide answers to nine demographic questions. Prior to implementation, the survey
PA Consulting Group administered the survey. Advance postcards were mailed on September 3 informing residents that they will receive a survey in the mail in a few days, and requesting their cooperation in completing the survey. The initial survey package with questionnaire, $2 incentive, and postage-paid return envelope was mailed on September 6. Thank you/reminder postcards were sent on September 13 to thank residences who had responded and remind those who had not to please do so. Finally, follow up surveys and postage-paid return envelopes were sent to all non-respondents on October 3. When the survey closed on October 25, 378 completed questionnaires were obtained for a response rate of 32 percent.
V. Survey Results
Data from the cognitive buildup and demographic sections of the survey data are used to
examine respondent’s demographics, their awareness, access and use of IT and the Internet, and their attitude towards various Internet attributes. Many of the findings below are “sensible”, and support prior studies and theory about new technology adoption.
A. Demographics
Survey data provide a profile of the representative household respondent. The average
respondent is a white, 50 year old male, with a two year degree at a college or technical school, who resides in a household with 1.7 other members. He was employed last month at a location outside of the home, and has annual household income of $71,934. A description of how
Internet access varies by income, race, household size, age, education and employment status is provided below.11
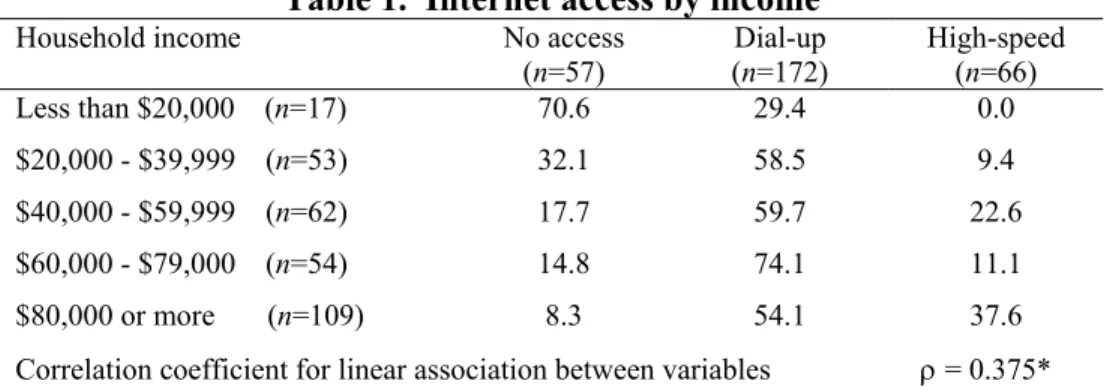
Household income. Table 1 presents a cross-tabulation between household income and type of Internet access for all respondents, and shows that Internet access is positively
associated with income. 70.6 percent of respondents with household income below $20,000 have no Internet access. Dial-up access is more prevalent for respondents with income from $40,000 to $80,000, and the income group with the most high-speed access is $80,000 or more.
Table 1. Internet access by income
Household income No access
(n=57) (Dial-up n=172) High-speed (n=66) Less than $20,000 (n=17) 70.6 29.4 0.0 $20,000 - $39,999 (n=53) 32.1 58.5 9.4 $40,000 - $59,999 (n=62) 17.7 59.7 22.6 $60,000 - $79,000 (n=54) 14.8 74.1 11.1 $80,000 or more (n=109) 8.3 54.1 37.6
Correlation coefficient for linear association between variables ρ = 0.375*
Note. Cells are percent of respondents in the access category. * is significant at the five percent level.
Household size and race. Table 2 indicates that Internet access is more likely in
households with two or more occupants, and high-speed access is relatively low for one person households. In Table 3, data provide prima facie evidence that Internet access is consumed by at least 50 percent of the population across all racial groups. High-speed access is extremely low for Native Americans and Hispanics. However, any conclusions here should be qualified because of the relatively low number of Native American and Hispanic respondents.
Table 2. Internet access by household size
Household size No access
(n=74) (Dial-up n=210) High-speed (n=75) 1 (n=51) 39.2 54.9 5.9 2 (n=148) 23.6 56.1 20.3 3 (n=67) 10.4 58.2 31.3 4 (n=57) 8.8 68.4 22.8 5 or more (n=36) 19.4 58.3 22.2
Chi-square test for independence of the variables χ2(8) = 26.87*
Correlation coefficient for linear association between variables ρ = 0.179*
Note. Cells are percent of respondents in the access category. * is significant at the five percent level.
Table 3. Internet access by race
Race No access (n=75) (Dial-up n=209) High-speed (n=75) Asia (n=3) 0.0 66.7 33.3 Native American (n=2) 50.0 50.0 0.0 Black (n=16) 25.0 56.3 18.8 White (n=332) 20.8 57.8 21.4 Hispanic (n=6) 16.7 83.3 0.0
Note. Cells are percent of respondents in the access category.
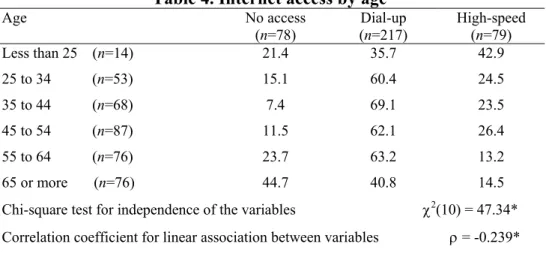
Household age. Internet access is negatively associated with household age, with Table 4 showing “younger households” are more likely to have Internet access. Further, 42.9 percent of households where the respondent is less than 25 years of age, 24.5 percent of respondents aged from 25 to 34, and 26.4 percent of respondents aged 35 to 44, have high-speed access.12
12 Carey (1991) and Madden et al (2000) find younger persons are more open to learning about new technologies
Table 4. Internet access by age Age No access (n=78) (Dial-up n=217) High-speed (n=79) Less than 25 (n=14) 21.4 35.7 42.9 25 to 34 (n=53) 15.1 60.4 24.5 35 to 44 (n=68) 7.4 69.1 23.5 45 to 54 (n=87) 11.5 62.1 26.4 55 to 64 (n=76) 23.7 63.2 13.2 65 or more (n=76) 44.7 40.8 14.5
Chi-square test for independence of the variables χ2(10) = 47.34*
Correlation coefficient for linear association between variables ρ = -0.239*
Note. Cells are percent of respondents in the access category. * is significant at the five percent level.
Household education and employment status. Table 5 presents Internet access by level of education, and shows a positive association between access and education. A large
percentage of respondents with high school education or less do not have Internet access. High-speed access is relatively higher among respondents with college and graduate degrees, perhaps reflecting familiarity with technology, and also a strong recognition of the money and time that can be saved from broadband delivered education and information services. An insignificant chi-square (χ2 = 9.210) statistic indicates employment is not related to access.
Table 5. Internet access by education
Education No access
(n=77) (Dial-up n=214) High-speed (n=77)
Less than high school (n=17) 64.7 11.8 23.5
High school (n=59) 32.2 61.0 6.8 Some college (n=141) 20.6 58.2 21.3 College (n=102) 9.8 65.7 24.5 Graduate degree (n=49) 16.3 55.1 28.6 Chi-square test for independence of the variables χ2(8) = 40.84*
Correlation coefficient for linear association between variables ρ = 0.227*
Table 6. Internet access by employment status
Education No access
(n=33) (Dial-up n=145) High-speed (n=51) Self employed, away from home (n=28) 21.4 42.9 35.7 Self employed, work at home (n=10) 30.0 60.0 10.0 Employed, away from home (n=182) 12.6 67.0 20.3 Employed, work at home (n=9) 11.1 55.6 33.3 Chi-square test for independence of the variables χ2(6) = 9.210 Note. Cells are percent of respondents in the access category. * is significant at the five percent level.
Social disadvantage. The “digital divide” debate refers to the perceived gap in computer and Internet use between high and low income households, educated and less educated populations, white and minority populations, urban and rural areas, etc. (Compaine 2001, NTIA 2000). Table 7 summarizes information from Table 1 through Table 6 and shows type of Internet access by various measures of social disadvantage. The percentage of
respondents with no access is relatively high for less educated, senior, and lower income groups. High-speed access is low for less educated and lower income groups, and no lower income respondents have high-speed access to the home.
Table 7. Internet access by measures of social disadvantage
Disadvantaged groups No access Dial-up High-speed Less educated (high school or less) 39.5 50.0 10.5 Senior (age greater than 65) 44.7 40.8 14.5 Lower income (income less than $20,000) 70.6 29.4 0.0
Minority (non-white) 22.2 63.0 14.8
Women (women head of household) 26.5 58.9 14.6
Total (all households) 28.3 51.5 18.8
B. Computers and Telephones
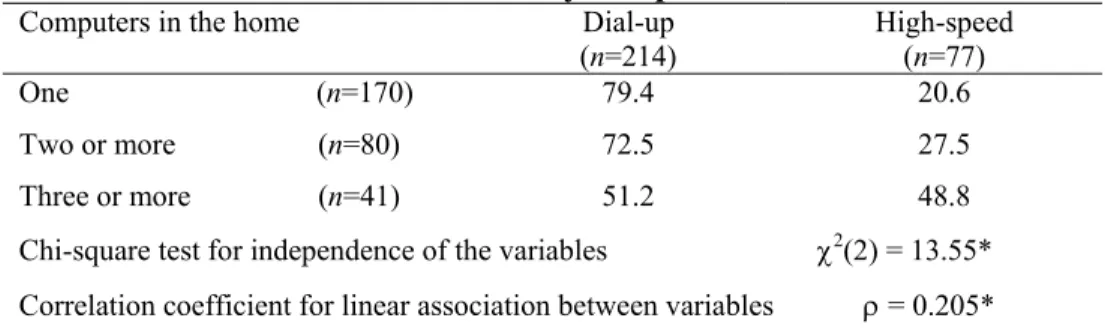
78 percent of all respondents have at least one PC or laptop in the home, while 32.6 percent have two or more PCs or laptops in the home. Table 8 presents a cross-tabulation of the number of computers in the home and type of Internet access for respondents with Internet access. High-speed Internet access is positively associated with the number of computers in the home. 20.6 percent of respondents with one computer have high-speed Internet access, 27.5 percent of respondents with two computers have high-speed access, and 48.8 percent with two or more computers have high-speed access. The prevalence of two or more computers in homes with high-speed access is supports “home networking” practices, with households defraying the cost of access over several users in the home.
Table 8. Internet access by computers in the home
Computers in the home Dial-up
(n=214) High-speed (n=77)
One (n=170) 79.4 20.6 Two or more (n=80) 72.5 27.5 Three or more (n=41) 51.2 48.8 Chi-square test for independence of the variables χ2(2) = 13.55*
Correlation coefficient for linear association between variables ρ = 0.205*
Note. Cells are percent of respondents in the access category. * is significant at the five percent level.
88.7 percent of respondents have at least one telephone line from the home, and 24.1 percent have a second line. The most frequently sited reason for a second line is “for dial-up Internet access – to free up the primary telephone line for voice calls” (48 percent of homes provide this reason), followed by “work-at-home/home business” (21.4 percent of homes provide this reason). The average price paid per month for a second telephone line is $25.38,
which is somewhat higher than estimates of $7.62 per month from Crandall and Jackson (2001), but in the range of $7.70 to $47.62 provided by Hausman et al (2001).
C. Internet Awareness, Access and Use
Awareness of service availability. Table 9 shows responses to the question “which ways of getting high-speed access are available in your neighbourhood.” Responses provide a more precise measure of availability than the FCC (2002b) “zip code data” and various search engines (such as www.broadbandcompass.com) since the respondent is actually informed of service availability in their area, perhaps by a neighbour or by the marketing efforts of ISPs and/or access providers. Awareness of high-speed service availability is relatively high for cable modem and DSL technology. 15.3 percent of respondents replied “not sure” for cable modem, 30 percent for DSL, 64.7 percent for fixed wireless, and 68.1 percent for satellite.13 Further, 51.3 percent of respondents with no Internet access are aware that at least one type of high-speed access technology is available in their neighbourhood, as are 80.6 percent of respondents with dial-up access.
Table 9. Awareness of high-speed Internet access
Access technology Available Not
available Not sure
Cable modem (n=352) 73.0 11.6 15.3
DSL (n=333) 57.7 12.3 30.0
Fixed wireless (n=311) 15.8 16.1 68.1
Satellite Internet (n=317) 27.4 7.9 64.7
Note. Cells are percent of respondents answering “available”, “not available”, or “not sure.”.
13 The importance of access to advanced communications for continuing socioeconomic progress is reflected in
recent remarks by President Bush (2002) who states that the US “must be aggressive about the expansion of broadband technology.” Federal Communications Commission (FCC; 2001 & 2002c) data indicate about 70 percent of US households have access to cable modem service, and 45 percent have access to DSL at 2001.
Internet access. 71.7 percent of homes connect to the Internet. 71.8 percent of these homes access the Internet with a dial-up connection, two percent use WebTV, and 26.2 percent use a high-speed connection. Survey data suggest that 18.8 percent of the population have a high-speed connection at home.14 The most frequently sited reason for high-speed Internet access is “speed is appropriate” (34 percent of homes), followed by “I like the always on connection” (24.5 percent of homes), and “to free up my telephone line for voice calls” (24.3 percent of homes).
The mean price per month for dial-up and high-speed access, respectively, is $17.51 and $40.76. These prices are similar to estimates by Glasner (2001) and Ames (2002) at December 2001 of $15 to $25 per month for dial-up, $39.40 for DSL, and $51.67 for cable Internet. Interestingly, 41 survey respondents that have dial-up access and a second telephone line dedicated primarily to dial-up access pay an average price of $45.03 per month to simulate the broadband experience – i.e., $23.75 for dial-up and $21.78 for a second telephone line. Since 90 percent of these respondents are aware that at least one type of high-speed technology is available in their neighbourhood, “lack of access” does not adequately explain their reluctance to subscribe to high-speed access service. Switching costs and attributes other than speed and always on may be inhibiting their high-speed Internet uptake.
Internet activity and experience. On average, 2.28 household members go online from home for a total of 14.35 hours per week. High-speed users are more active with 19.44 hours of online activity per week compared to dial-up users with 12.55 hours of online activity. Including home, school, work and other locations, high-speed users have been going online for
14 Estimates of PC ownership and Internet access similar to the UCLA Center for Communication Policy (CCP;
2001), but slightly higher than the BLS (2001) at September 2001, and FCC (2002a) at June 2002. BLS indicate that 64.4 percent of the population have a computer or laptop in the home, and 51.8 percent connect to the Internet from home.
3.48 years compared to 3.22 years for dial-up users. Further, 63.3 percent of high-speed users have more than five years of online experience, while only 48.2 percent of dial-up users have the same experience.15 When asked whether they use a high-speed Internet connection at any location outside of the home, 94.6 percent of all respondents (i.e., those with and without Internet access at the home) indicate they have used high-speed Internet at either a cyber café, library, place of employment, school, friend/relative’s house, or other location. As such, it can be inferred that a reasonably large segment of the population have experienced high-speed Internet access service.
Internet activity data are obtained by asking respondents “how often do you and other household members do each of the following activities: email and IM; use search engines or purchase products; play games or gamble; share music files or photos; banking, trading stocks, or bill payment; and download movies to view on the PC.” Table 10 and Table 11 show Internet activity for the most extremes responses, “many times a week”, and “never”,
respectively. Email and IM, and search engines and product purchases are frequent activities for both dial-up and high-speed users, which is consistent with findings from the BLS (2001). As suggested above by the number of hours online per week, high-speed users are more active than dial-up users. The percentage of high-speed users answering “many times a week” (“never”) is higher (lower) for all Internet activities. High-speed users are two times more likely to share music files and photos, bank, trade stocks, and pay bills many times a week than dial-up users.
15 36 respondents (about 10 percent of the sample) have never used the Internet to go online. Of these, 10 indicate
Table 10. Frequency of Internet activity – “many times a week”
Activity All Dial-up High-speed
Email & instant messaging 71.4 68.5 79.7 Search engines & purchase products 37.8 29.5 60.8
Play games & gamble 21.0 17.7 30.8
Share music file or photos 10.1 6.8 19.5
Banking, trading stocks, or bill payment 9.8 7.4 16.5
Download movies to view on PC 1.0 0.9 1.3
Note. Cells are percent of respondents using the activity “many times a week.”
Table 11. Frequency of Internet activity – “never”
Activity All Dial-up High-speed
Email & instant messaging 2.7 2.7 2.5
Search engines & purchase products 6.4 8.2 1.3
Play games & gamble 51.3 53.2 46.2
Share music file or photos 38.4 42.3 27.3
Banking, trading stocks, or bill payment 52.7 56.7 41.8 Download movies to view on PC 95.3 97.7 88.5
Note. Cells are percent of respondents who “never” use the activity.
Content. Content providers, such as ABC, Cartoon Network, CNN, ESPN, and
RealNetworks Inc. are currently working on entertainment packages with games, music, sports and news clips for high-speed Internet users (Grant 2002). Network economics suggests a critical mass of users is required to leverage the complementarity (i.e., positive network effects) between high-speed demand and the provision of entertainment content.16 Some insight into this relationship is gleamed from the survey question “what would need to change for you to use the Internet to view entertainment video such as a full-length movie or TV show?” Table 12 indicates that industry players have considerable work to do to convince households to use
16 Network effects are less prominent when entertainment content produced for other distribution media is simply
PCs and the Internet to view entertainment content. After excluding almost half of the respondents who state they “would not use their PC and the Internet to view entertainment content”, Table 12 shows the most important reason is the “ability to view in convenient location (for instance, your TV in your living room).” “More awareness of how to find
interesting content”, and “access to a wider range of content” are more important to high-speed users.
Table 12. Change needed to use Internet to view entertainment content
Answer All No access Dial-up High-speed
Nothing, I would not 46.4 62.5 48.5 30.9
Nothing, I already do 2.3 0.0 1.5 5.9
Ability to view in a convenient location 29.5 20.0 30.5 32.4 Access to a wider range of interesting content 2.6 2.5 2.0 4.4
Better quality picture 4.5 2.5 3.5 8.8
Awareness of how to find interesting content 4.9 5.0 3.0 10.3
Other 9.7 7.5 11.0 7.4
Note. Cells are percent of respondents providing a single answer only.
D. Internet Access Attributes
The “Internet Access Attributes” section of the questionnaire informs respondents about Internet access attributes. Respondents consider their preferences for different attributes when answering the question “how important is (or would be) the attribute of Internet access to you.” A single answer is selected for each question from the following choices, “not important”, slightly important”, “somewhat important”, “very important”, and “extremely important.”
Table 13 shows the percent of respondents who indicate the attribute is either a very important or extremely important part of their Internet access. Speed, reliability, and always on functionality are clearly important to high-speed users. Interestingly, reliability of service is
important for respondents with no access, dial-up access, and high-speed access. This latter finding supports anecdotal evidence that consumers desire a service they can count on being available whenever they want to use it, with consistent speed (that is as fast as advertised), and any problems that do arise are immediately handled by good customer service. Savage and Waldman (2002) suggest that households that are more skillful online will value broadband attributes always on and speed higher. Table 14 shows the importance of access attributes by online experience, a reasonable approximation to household online ability or skillfulness. Almost half of all respondents who value the five attributes as extremely important or very important have five or more years of online experience. Always on functionality and speed are clearly important to “experienced” online users. Finally, Table 14 shows about 20 percent of respondents have less than three years of online experience. More experience, along with specific marketing and educational programs that highlight the functionality and benefits of Internet access, will help users become more skillful online and value important broadband attributes such as always on and speed higher.17
Table 13. Importance of attributes by Internet access
Attribute All No access Dial-up High-speed
Always on 49.1 40.3 39.0 87.3
Cost 59.6 48.6 64.6 58.3
Speed 53.6 38.1 46.2 92.4
Installation 33.6 34.2 26.0 54.4
Reliability 66.3 52.0 64.1 89.9
Note. Cells are percent of respondents who indicate attribute is “extremely important” or “very important.”
17 Many industry commentators argue that DSL access providers have little incentive to actively market
high-speed Internet service as it would reduce the demand for additional lines previously used for dial-up. Note, however, that J.P. Morgan (2001) estimate only half of the second lines are being shut off as broadband is taken up, which suggests additional lines are shared with other services such as fax or voice.
Table 14. Importance of attributes by online experience
Attribute Years of online experience
< 1 year 1-3 years 3-5 years > 5 years
Always on 3.4 16.8 26.3 53.6
Cost 3.8 18.3 29.6 48.4
Speed 3.5 16.0 25.5 55.0
Installation 3.3 20.7 28.1 47.9
Reliability 3.7 16.9 28.8 50.6
Note. Cells are percent of respondents who indicate attribute is “extremely important” or “very important.”
VI. Conclusions
Data obtained from a nationwide mail survey of US residences during September and October 2002 are used to investigate consumer awareness of high-speed Internet access, profile
residential Internet access and use, and gain insight into how important “always on” connectivity, cost, speed, installation and reliability attributes are in household’s choice of service. Preliminary analysis of survey data suggests that household awareness of high-speed service availability is relatively high for cable modem and DSL technology.
Preference for high-speed access is apparent among households with higher income, a college education, and multiple PCs. 18.8 percent of the sample have a high-speed connection, and the mean price paid per month for dial-up and high-speed access is $17.51 and $40.76, respectively. On average, 2.28 household members go online from home per week – 19.44 hours for high-speed users and 12.55 hours for dial-up users. 63 percent of high-speed users have more than five years of online experience, compared to 48.2 percent of dial-up users. Email and IM, and search and product purchases are very frequent activities for dial-up and high-speed users. High-speed users are two times more likely to share music files and photos, bank, trade stocks and pay bills “many times a week” than dial-up users.
Speed, reliability of service, and always on functionality are important to high-speed users. In particular, reliability is important for respondents with dial-up, high-speed, and no access. This finding suggests consumers place greater weight on a service they can count on when they want to use it, and has consistent speed with good customer service. Always on functionality and speed are clearly important to experienced online users. While survey results provide prima facie evidence that reliability, speed, and always on are important attributes for household choice, estimation of utility functions provides more precise information on
consumer preferences for Internet attributes.
Although the main purpose of this study is to provide timely empirical data for policy discussion, it is possible to make some general inferences about residential awareness of high-speed Internet service availability, and the marketing and promotion of high-high-speed service. Survey respondents are reasonably well aware of high-speed service availability. Over half of the sample households with no Internet access aware that at least one type of high-speed technology is available in their neighbourhood, as are 81 percent of respondents with dial-up access. In most urban neighbourhoods, awareness and access do not appear to be a significant inhibitor to high-speed uptake. While residential broadband uptake has progressed reasonably well during the early adopter phase, the immediate challenge for managers and policy makers is broader adoption throughout the US population. Marketing strategies need to be more effective in highlighting reliability of service and the current “real” benefits of high-speed access – a “killer ad” may go along way toward stimulating interest and demand for high-speed service. Universal service policies would promote wider adoption, but advocates of these policies need to demonstrate public benefits and appropriate funding mechanisms. Here, use of broadband infrastructure to promote greater educational and health care opportunities, delivery of
government services, and national security may substantiate arguments for universal broadband service.
Future research will use survey data from the “choice task section” of the survey to estimate household’s willingness to pay for improvements in access attributes. Willingness to pay estimates are obtained for the representative user, as well as users with high and low income, and by high and low levels of education. Finally, survey work is currently being undertaken to provide a broader representation of low income and remotely located populations, and homes with no PCs and access to the Internet.
References
Ames, S. (2002), ‘Study: Broadband Fees Climbed in 2001’, CNET News.com, January 17, http://news.com.com/2100-1033-818013.html, accessed May 8 2002 8.42 AM MW.
Backover, A. (2002), ‘Web Surfers Snub Pricier Broadband Internet Access’, USA TODAY, April 25, 11:24 PM ET, www.usatoday.com/life/cyber/tech/2002/04/26/broadband-usat-htm, accessed April 29 2002 11.43 AM MW.
Black, J. (2001), ‘Beware Baby Bells’, BusinessWeek Online, August 21,www.businessweek.com/bwdaily/dnflash/aug2001/nf20010821_941.htm, accessed May 13 2002 11.31 AM MW.
BLS (2001), Current Population Survey: Computer and Internet Use Supplement, September 2001, www.bls.gov/cps/.
Borland, J. (2001), ‘Broadband Defectors on the Rise’, CNET News.com, November 7 2001, 4.00 AM PT, www.news.com.com/2100-1033-275432.html?legacy=cnet, accessed May 8 2002 12.38 PM MW.
Bush, G.W. (2002), ‘President Discusses the Future Technology at White House Forum’, Remarks by the President at the 21st Century High Tech Forum, Presidential Hall Dwight David Eisenhower Executive Office Building, June 2002.
Carey, J. (1991), ‘The Market for New Residential Services, in M. Elton (ed.) Integrated Broadband Networks: The Public Policy Issues, Elsevier Science, New York.
CCP (2001), The UCLA Internet Report 2001: Surveying the Digital Future: Year Two, UCLA, November.
Compaine, B. (2001), The Digital Divide: Facing a Crisis or Creating a Myth, MIT Press, Cambridge, MA.
Crandall, R., and Jackson, C. (2001), The $500 Billion Opportunity: The Potential Economic Benefit of Widespread Diffusion of Broadband Internet Access, Criterion Economics, L.L.C. Washington, D.C.
FCC (2002a), High Speed Services for Internet Access: Status as of June 30 2002, Industry Analysis and Technology Division, Wireline Competition Bureau, FCC, Washington, D.C. FCC (2002b), Zip Codes by Number of High-Speed Service Providers As of 6/30/02, FCC-State Link, FCC, Washington, D.C, http://www.fcc.gov/Bureaus/Common_Carrier/Reports/FCC-State_Link/IAD/hzip0602.pdf.
FCC (2002c), Trends in Telephone Service, Industry Analysis and Technology Division, Wireline Competition Bureau, Washington, D.C.
FCC (2001), High Speed Services for Internet Access: Subscribership as of December 31 2001, Industry Analysis Division, Common Carrier Bureau, FCC, Washington, D.C.
GAO (2001), Characteristics and Choices of Internet Users, United States General Accounting Office, Washington, D.C.
Gill, J. (2002), ‘Broadband Internet Never Cometh’, Newsfactor Network, February 26, www.newsfactor.com/perl/story/16476.html, accessed May 8 2002, 12:28 PM MW.
Glasner, J. (2001), ‘High Price Just for Speed’, Wired News, April 19,
www.wired.com/news/business/0,1367,43497,00.html,accessed, April 19 2002 8:35 AM MW.
Grant, P. (2002), ‘Comcast Posts Strong Growth in Cable-Modem Subscribers’, The Wall Street Journal Online, WSJ.com.
Goolsbee, A. (2000), ‘The Value of Broadband and the Deadweight Loss of Taxing New Technology’, Mimeo, University of Chicago.
Hausman, J., Sidak, G., and Singer, H. (2001), ‘Cable Modems and DSL: Broadband Internet Access for Residential Customers’, American Economic Review AEA Papers and
Proceedings, 91, May, 302-307.
Hellerstein, J. (2001), The Future of Digital Subscriber Line Technology: Business Drivers, Strategies, and Markets, Hellerstein & Associates.
J.P. Morgan (2001), Telecom Services 2001, J.P. Morgan Securities Inc., New York. Madden, G., Savage, S.J., Coble-Neal, G., and Bloxham, P. (2000), ‘Advanced
Communications Policy and Adoption in Rural Western Australia’, Telecommunications Policy, 24, 291-304.
NTIA (2002), A Nation Online: How Americans are Expanding Their Use of the Internet, Department of Commerce, Washington, D.C.
NTIA (2000), Falling Through the Net: Toward Digital Inclusion, Department of Commerce, Washington, D.C.
Ordover, J., and Willig, R. (1999), Applications for Consent to the Transfer of Control of Licenses, MediOne Group Inc., Transferor, to AT&T Corp., Transferee, CS Docket No. 99-251 (filed September 17, 1999).
Pepper, R. (2002), ‘Competition, Regulation and Digital Migration’, presented at the 14th Biennial Conference of the International Telecommunications Society, Seoul, Korea, August 18-21,. 2002.
Rappoport, P., Kridel, D., Taylor, L., Duffy-Deno, K., and Alleman, J. (2002), ‘Residential Demand for Access to the Internet’, in Madden, G. (ed.) The International Handbook of Telecommunications Economics: Volume II, Edward Elgar Publishers, Cheltenham.
Savage, S., and Waldman, D. (2002), ‘Estimating the Demand for Broadband’, presented at the Department of Economics, University of Colorado, Boulder, October 28.
Varian, H. (2002), ‘The Demand for Bandwidth: Evidence from the INDEX Project’, Mimeo, University of California, Berkeley.