A
A
lm
l
ma
a
M
Ma
at
te
er
r
S
St
tu
ud
di
io
or
ru
um
m
–
–
U
U
ni
n
iv
ve
er
rs
si
it
tà
à
d
d
i
i
B
Bo
ol
lo
og
gn
na
a
DOTTORATO DI RICERCA IN
COMPUTER SCIENCE AND ENGINEERING
Ciclo XXXI
Settore Concorsuale: 09/H1
Settore Scientifico Disciplinare: ING-INF/05
A fully-wearable non-invasive SSVEP-based BCI system enabled by AR techniques
for daily use in real environment.
Presentata da:
Mattia Salvaro
Coordinatore Dottorato
Supervisore
Prof. Paolo Ciaccia
Prof. Michela Milano
Co-supervisore
Prof. Luca Benini
ALMA MATER STUDIORUM - UNIVERSITY OF BOLOGNA
A fully-wearable non-invasive
SSVEP-based BCI system enabled by
AR techniques for daily use in real
environment.
by
Mattia Salvaro
A thesis submitted for the degree of Doctor of Philosophy
in the
Faculty of Engineering
Department of Computer Science and Engineering (DISI)
“If we knew what it was we were doing, it would not be called research, would it?”
ALMA MATER STUDIORUM - UNIVERSITY OF BOLOGNA
Abstract
Faculty of Engineering
Department of Computer Science and Engineering (DISI) Doctor of Philosophy
by Mattia Salvaro
This thesis aims to explore the design and implementation of Brain Computer Inter-faces (BCIs) specifically for non medical scenarios, and therefore to propose a solution that overcomes typical drawbacks of existing systems such as long and uncomfortable setup time, scarce or nonexistent mobility, and poor real-time performance. The research starts from the design and implementation of a plug-and-play wearable low-power BCI that is capable of decoding up to eight commands displayed on a LCD screen, with about 2 seconds of latency. The thesis also addresses the issues emerging from the usage of the BCI during a walk in a real environment while tracking the subject via indoor position-ing system. Furthermore, the BCI is then enhanced with a smart glasses device that projects the BCI visual interface with augmented reality (AR) techniques, unbinding the system usage from the need of infrastructures in the surrounding environment.
Acknowledgements
I would like to thank my advisors, Michela Milano and Luca Benini, for giving me the opportunity to pursue this PhD, my supervisors at Micrel Lab Simone Benatti and Marco Guermandi, and my lab fellows Victor Kartsch, Fabio Montagna, Hanie Aghazadeh, Tommaso Polonelli and Alberto Girolami. It has been very nice to share this experience with all of you.
I would also like to thank my supportive family, to which I owe this achievement, and my girlfriend Manuela, that helped me a lot through thick and thin.
Contents
Abstract iv
Acknowledgements vi
List of Figures x
List of Tables xii
Abbreviations xiii
1 Introduction 1
1.1 Thesis contribution . . . 3
2 Brain Computer Interface 4 2.1 Overview . . . 4
2.2 EEG signal . . . 6
2.2.1 Signal Description . . . 6
2.2.2 Signal Acquisition . . . 8
2.3 Taxonomy . . . 9
2.4 State of the Art . . . 11
2.5 Canonical Correlation Analysis . . . 14
2.6 Wearable BCI . . . 16
2.6.1 Hardware . . . 17
2.6.2 Firmware implementation . . . 18
2.7 Experiments and results . . . 19
2.7.1 Experimental setup . . . 19 2.7.2 Experimental results . . . 22 2.7.3 Computational results . . . 25 3 Location-Based BCI 28 3.1 System description . . . 29 3.1.1 Android app . . . 29
3.1.2 EEG acquisition system . . . 30
3.1.3 Signal processing . . . 31
3.1.4 Challenges . . . 32 viii
Contents ix
3.2 Experiments and results . . . 33
3.2.1 Experimental setup . . . 33
3.2.2 Experimental results . . . 34
4 AR-based BCI 37 4.1 Smart glasses . . . 38
4.2 AR for stimuli presentation . . . 38
4.3 AR-based stimuli validation . . . 40
4.4 Experiments and results . . . 41
4.4.1 Experimental setup . . . 41
4.4.2 Experimental results . . . 42
5 Conclusions 44
List of Figures
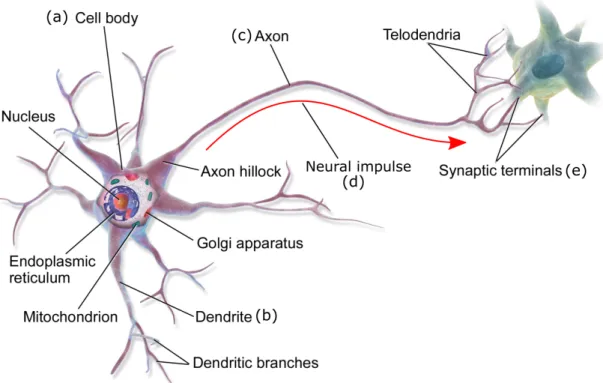
2.1 Structure of a neuron (source: Wikimedia commons). The cell body (a) contains the cell nucleus and acts as the cell’s life support center. The cell body gathers and aggregates the signals arriving from other cells though dendrites (b). The axon (c) allows the neuron to spread the signal away from the cell body to other neurons. The information is constituted by a neural impulse (d), flowing from the cell body to the peripheral synaptic terminals (e), that in turn communicate with another neuron. . . 7 2.2 (a) Picture of the g.SAHARA dry electrode with custom amplifier PCB.
(b) Electrical schematics of the custom amplifier PCB. . . 8 2.3 BCI taxonomy proposed by [1]. The work proposed in this thesis
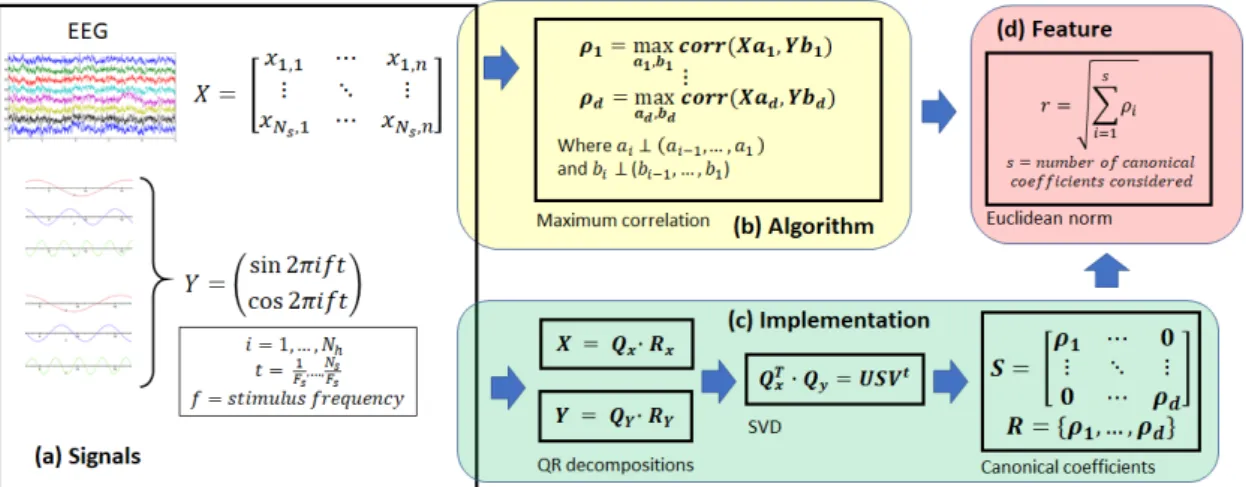
be-longs to the Visual Evoked category: the aim is to design a dependent, exogenous and non-invasive BCI. . . 10 2.4 Block diagram of CCA algorithm and implementation. (a) Signal matrices
input for CCA. (b) CCA formulation algorithm. (c) CCA implementation algorithm. (d) Feature extraction. . . 15 2.5 Architectural diagram of the proposed system. Fig. 2.5 (a) and (b) show,
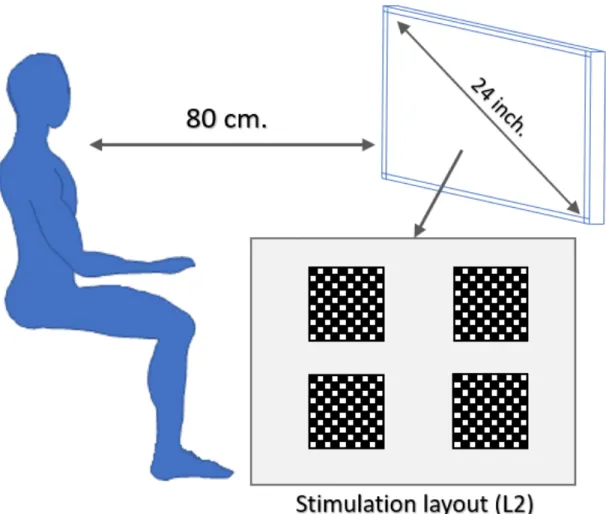
respectively, an image and the block diagram of the wearable node. Fig. 2.5 (c) presents an image of the dry active electrodes and (d) the electrical schematics of the custom amplifier stage PCB. Finally, in Fig. 2.5 (e) the LCD screen with stimuli presentation is depicted. . . 17 2.6 Acquisition setup: the flickering stimuli layouts (layout L2 in the figure,
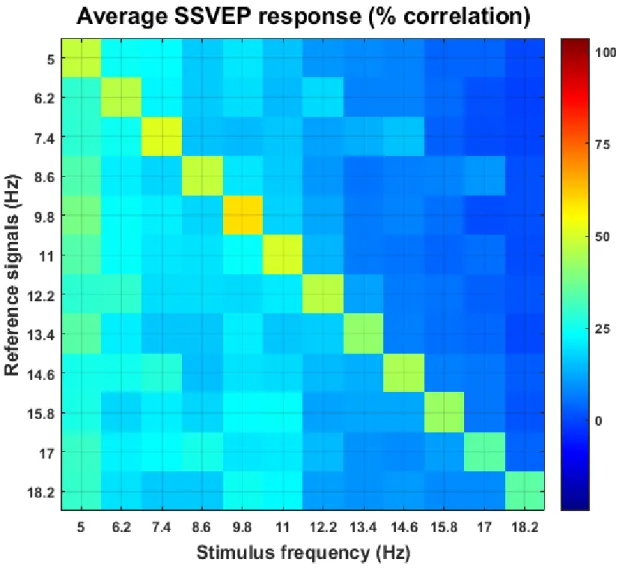
featuring four checkerboards) are presented on a 24-inches LED screen. The subject stares at the screen from a distance of 80 cm. . . 20 2.7 Average CCA correlation of SSVEP responses for different stimuli
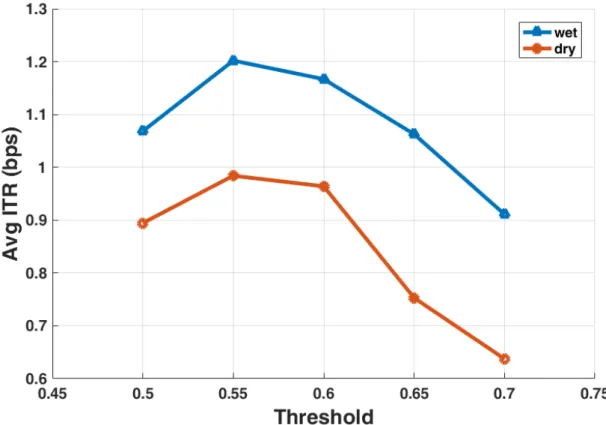
(x-axes) calculated with different reference signals (y-(x-axes). On the diago-nal it is possible to observe higher correlation due to the correspondence between the stimulus frequency and the reference signals. Noticeably, the lower part of the stimuli spectrum allows for higher correlation response with respect to the higher part. . . 22 2.8 Average ITR results for the system with wet electrodes (blue triangles),
and dry electrodes (red circles) calculated using different classification thresholds. A threshold value of 0.55 is shown to maximize ITR for both wet and dry electrodes. . . 23 2.9 Trend of the power consumption calculated for several downsampling
fac-tors (blue triangles) for four stimuli. . . 26 2.10 Trend of the ITR/power consumption ratio calculated for several CCA
execution periods with wet electrodes (blue triangles) and dry electrodes (red circles). . . 26 3.1 Android app architecture . . . 29
List of Figures xi
3.2 EEG acquisition board . . . 30
3.3 Spectrogram of the EEG data and positions . . . 31
3.4 Overview of the full wearable system composed by the BCI board and electrodes placed on the head, and the Android hand held device. . . 33
3.5 Predefined path and stimuli location . . . 33
3.6 Frequency Response for SSVEP at 12.5Hz. . . 34
3.7 Frequency Response for SSVEP at 20Hz. . . 35
4.1 Example of the application usage from the user’s perspective. . . 39
4.2 Frequency response of stimuli generated on the AR glasses and captured by a photo-resistor. The deviation from the target frequency is <0.1 Hz. 40 4.3 CCA correlation . . . 41
4.4 Front and back view of the complete setup during a test.The HDMI cable attached to the board is used only for testing purpose, and it is not required during normal operation of the system. Similarly, the current size and weight of the PCB allow an easy debugging. Nevertheless, the entire hardware dimensions can be reduced to a half. . . 41
List of Tables
2.1 Comparison between state-of-the-art BCI Systems in terms of setups and
ITR. . . 11
2.2 Offline results for 4 stimuli BCI, wet and dry setup. . . 24
2.3 Offline results for 8 stimuli BCI, wet and dry setup. . . 25
2.4 Online results for 4 stimuli BCI, wet and dry setup. . . 25
2.5 Online results for 8 stimuli BCI, wet and dry setup. . . 25
3.1 Comparison between different electrode placement . . . 32
3.2 Relation between the subject speed and the frequency of the movement artifacts. The growing trend suggests a correlation between the two mea-sures. . . 35 4.1 Experimental results. For each subject results of three trials are reported. 42
Abbreviations
ADC Analog-to-Digital Converter
AFE Analog FrontEnd
ANN ArtificialNeuralNetwork
AR Augmanted Reality
ASL Amyotrophic Lateral Sclerosis
BCI Brain Computer Interface
BMI Brain MachineInterface
CCA Canonical Correlation Analysis
CPS Cyber Physical System
DSP Digital SignalProcessing
ECoG ElectroCorticoGraphy
EEG ElectroEncephaloGraphy
EMG ElectroMyoGram
EOG ElectroOculoGraphy
fMRI functional MagneticResonance Imaging
FFT Fast FourierTransform
FPU Floating PointUnit
FTA Frequency Tagging Analysis
HCI Human Computer Interface
HMI Human MachineInterface
HMD Head-MountedDisplay
GUI GraphicUser Interface
GPS GlobalPositioning System
IEEG IntracranialEEG
IDE IntegratedDevelopment Environment xiii
Abbreviations xiv
IoT Internet of Things
ITR InformationTransferRate
LBS Location-Based Service
LDA LinearDiscriminantAnalysis
LED LightEmitting Diode
MEG MagnetoEncephaloGraphy
MFD Matched FilterDetector
PCA Principal Component Analysis
PCB Printed Circuit Board
PLI Power LineInterference
PSD Power SpectralDensityAnalysis
RFID RadioFrequencyIDentification
SCP Slow CorticalPotential
SPI SerialPeripheral Interface
SVD Singular Value Decomposition
SVM SupportVector Machine
SSVEP SteadyStateVEP
TRCA TaskRelatedComponent Analysis
TVEP TransientVEP SNR Signal-to-Noise Ratio
UWB UltraWideBand
To my family.
Chapter 1
Introduction
Interaction with machines and electronic systems has become more and more fre-quent and well-established since the third industrial revolution, often referred to as digital revolution, starting from the second half of the 20th century. During this time, the adoption and proliferation of digital computers marked the beginning of the In-formation Age, which still continues to the present days. To control those electronic systems several paradigms of Human Machine Interactions (HMIs) have been developed during the years, starting from the keyboard based command line, to the more recent vocal interface, passing through Graphic User Interfaces (GUIs) and touch screen. The fourth industrial revolution, started in the beginning of the 21st century, pushed the capabilities of electronic systems even farther thanks to the miniaturization of powerful and power efficient computational and communication units. The ability of decentral-ize computation near sensor and the empowered communication are key factors for the rise of technologies such as Internet of Things (IoT), Cyber Physical Systems (CPSs) and cloud computing. In industry, the exploitation of these new technologies is generi-cally called Industry 4.0, where benefits are achieved through CPSs that create virtual representation of the physical production processes and are able to take autonomous decentralized decisions or communicate and cooperate with each other at both internal and inter-company level.
The digital revolution reflects in the mass market with products like smartphones, smartwatches, wristbands and any kind of wearable device capable of short range or long range communication. Along with new devices development, also new and smarter HMI paradigms have been devised that exploit the device internal sensors to detect user commands (e.g. step counter for smartphones, or wrist rotation for smartwatches). Other devices exploit biosignals for user interaction like Myo Armband [2], which is able to sense Electromyogram (EMG) of the forearm muscles and translates the signal
Introduction 2 into commands. Brain Computer Interfaces (BCIs), also known as Brain Machine Inter-faces (BMIs), are a particular type of HMIs that exploit brain activity signals acquired via Electroencephalography (EEG). BCIs were first developed to support people with disabilities in their interaction with the external world, with one of the first successful examples being BCI spellers. Recent years have seen BCI applications reach out to a larger set of scenarios, such as industry, gaming, learning, healthcare [3] and rehabilita-tion [4]. Several tech companies developing consumer-oriented products (Google, Apple, Facebook, etc.) have also become active in this field [5–7], with the vision of being able to substitute traditional HMIs based on conventional computer input devices, gesture and voice recognition, touch-screen interaction [2,8, 9], with the possibility to directly interact and control computers with our brain.
Bringing this fascinating idea into life will be a tremendous boost towards integrat-ing actions and interactions with objects in a fully-connected IoT scenario. Applications can range from verifying whether a worker is attending a specific task or effectively re-ceiving a communication for safety purposes, to remotely control devices in industrial or home environments, to navigating menus in shops or restaurants, to gaming. These applications have different requirements as compared to traditional BCI spellers. On the one hand, they mostly require less symbols to be recognized with respect to a full speller, on the other hand they need system latencies to be minimized, both in setup time and real-time performance. However, traditional BCI systems suffer from a certain complexity, cost and size, which can only be reduced by moving processing to an exter-nal hardware, compromising portability and ease-of-use.
The foundation of every BCI system lies in the acquisition of signals that relates to brain activity. Among the available techniques to extract such information, EEG is considered as the ideal (if not the only) candidate for consumer applications and has enjoyed significant improvements in recent years. What was once possible only through expensive and cumbersome devices, it is now available on the market in cheap and rela-tively attractive form-factors. Most of them are conceived for gaming and entertainment or leisure, like MindMaze Mask [10], Neurosky MindWave [11], and Emotiv Insight and EPOC+ [12]. Not all these systems can acquire EEG with the same signal quality and setup complexity (i.e. number and type of electrodes), resulting in different BCI ease-of-use and performance. Moreover, these consumer products are conceived to be more a toy that identifies mood, focus, meditation, or facial expression of the user, rather than an actual machine communication tool. Only few commercial products are designed for custom BCI application development, OpenBCI [13] for example offers an open source platform for biosignals (mainly EEG) acquisition and streaming, while g.tec Intendix [14] provides a full PC based BCI speller. A common drawback of these systems is that they require a continuous data-link between on-body sensors and mobile phones/tablets, or laptop computers and workstations. This impairs some important features such as
Brain Computer Interface 3 wearability and minimal intrusiveness, increasing overall system cost as well. More-over, it causes a severe reduction of the energy efficiency of the whole system [15–17] as it requires transmission of non-negligible amounts of data. To avoid these issues, the digital processing should be moved near-sensor, executing algorithms directly on the wearable device [18, 19]. Such solutions are not readily available, both in commercial systems and research literature. The focus of this work is to build and validate a BCI system that fulfill desirable features such as wearability, power efficiency, fast setup, stand-alone, fast responsiveness. The next section depicts in more detail what are the original contribution of this thesis.
1.1
Thesis contribution
In an effort to provide a BCI system better tailored for the new scenarios that are envisioned for the near future, this work proposes three major contributions. The first one is the design and implementation of an embedded, minimally invasive, low-power, low-cost, asynchronous BCI speller, able to recognize up to eight different stimuli with an information transfer rate (ITR) of more than 1 b/s with zero-preparation time thanks to the usage of dry electrodes. This is comparable with state-of-the-art non-wearable systems (where signal processing is computed on external hardware), thanks to careful optimization of the processing and pre-processing algorithms, which are specifically tai-lored on the proposed system configuration. The second contribution is the assessment of the wearable BCI in a task that implies user navigation, binding the EEG response with the position of the subject, in order to understand the challenges of the acquisition of EEG signals (artifacts, external noise and hardware constrains) in real environments, and to study the correlations between the brain activity and the subject’s location or movements. The final contribution is the enhancement of the proposed wearable BCI system with a Head-Mounted Display (HMD) that provides visual stimuli through Aug-mented Reality techniques (AR), achieving 80% accuracy with average latency of 3 seconds and allowing for a fully wearable fast and reliable BCI system. The structure of this thesis will follow the order of the three main contributions stated above.
Chapter 2
Brain Computer Interface
2.1
Overview
Brain Computer Interfaces (BCIs) are hardware-software systems that enables hu-man machine communication without need of muscles or peripheral nerves, exploiting exclusively electroencephalographic activity (EEG) as control signals [20]. BCI systems are typically composed by a signal acquisition headset and a signal processing device, and optionally feature an input stimuli presentation system and an output display or actuator. BCI systems recognize patterns in EEG signal following five stages: sig-nal acquisition, sigsig-nal enhancement or preprocessing, features extraction, classification, control interface [21]. The underlying implementation of the five stages are driven by design goals including target application and users, form factor, type of brain activity leveraged, and desired target performance.
Decoding brain signal is a very challenging task. In fact, the control signal is cap-tured together with other signals from other brain activities that may overlap in time and space. Further noise can be added by artifacts due to muscular and ocular movements, generating a different type of signal measurable by techniques such as electromyography (EMG) and electroculography (EOG). Both EMG and EOG signals are present in some areas of the head where EEG is also observable, interfering with EEG acquisition. In addition, the amplitude of the EEG signal can be more or less diminished according to the type of acquisition system adopted. Ininvasive BCI systems, microelectrode arrays are physically implanted in the cerebral cortex, the implant requires brain surgery and is therefore prerogative of very specific experimental medical settings. This technique is called electrocorticography (ECoG), and compared to EEG it provides better SNR, since it avoids artifacts like eye blinking or movements and it is more spatially accurate since the electrodes are physically attached to the signal source area. On the other hand,
Brain Computer Interface 5
non-invasive BCI systems use removable electrodes applied on the scalp, where the EEG signal is diminished and spread on a wider area, resulting in more noisy and overlapping signals, but at the same time providing a more appealing setup for non-medical scenar-ios, allowing BCIs to steer towards consumer market for everyday use. A more detailed taxonomy of existing BCI systems is illustrated in Sec 2.3.
BCI systems also differ with respect to the type of control signals they work with. Modern BCI systems rely on five different types of brain activity: Slow Cortical Poten-tials (SCPs), neuronal action potenPoten-tials, sensorymotor rhythms, P300 evoked potenPoten-tials, and Visual Evoked Potentials (VEPs) [1,22]. SCPs are slow voltage changes that occur in cortex and can last from 0.5 s to 10 s. Positive SCPs are associated to decreased ac-tivity in neurons, while negative SCPs are associated with neuronal acac-tivity. It has been shown by [23–25] that properly trained people can control their SCPs, and therefore it is possible for them to control cursor movement on a computer screen. Neuronal action potentials are measured in an invasive way, using cone electrodes inserted in the mo-tor cortex. The electrodes sense the single cortical neuron-induced potential, however, unlike SCPs, these potential are more difficult to control and the need for continu-ous medication has hindered the popularity of this technique. Sensorymotor rhythms are a combination of mu and beta rhythms (see Sec. 2.2.1) and are associated with motor imagery, without any actual movement [26]. Once again, user training is neces-sary to emphasize kinesthetic experiences rather than the visual representation of the movements [1]. P300 evoked potentials are potential peaks found in an EEG related to infrequent stimuli of visual, auditory or somatosensory type. The peak is measured around 300 ms after the infrequent stimulus onset, and its amplitude grows inversely with the frequency of the stimulus. P300 has been widely used for both medical and non-medical BCI systems thanks to its relatively fast outcome and because it does not need any user training. Typical P300-based BCI applications are spellers, where letters and symbols are presented to the user in a matrix form and sequentially highlighted. The specific highlighting sequence may affect the BCI performance and it is part of its design. Typically, P300-based BCIs use the average of several trials of the infrequent stimulus in order to increase accuracy. VEPs are electrical potentials evoked in the visual cortex by visual stimuli, similarly to visual P300. The difference between visual P300 and VEP is that while P300 is evoked by an infrequent and possibly unpredictable stimulus, VEP is evoked by periodic repetitions of the same stimulus. VEPs can be divided into Transient VEPs (TVEPs) and Steady State VEPs (SSVEPs), where the discriminating factor is the frequency of the repetition. According to [27], TVEPs are bounded to frequencies lower than 4 Hz, while [28] reduces the threshold frequency to 2 Hz. However, the two authors agree in setting at 6 Hz the lower bound for SSVEPs frequency. From the neurological point of view, TVEPs show a resting phase between two consecutive repetitions, while SSVEPs are overlapped. In practice, the detection of
Brain Computer Interface 6 TVEPs and SSVEPs requires the same kind of processing, and the two techniques can be basically considered as one. VEPs, together with P300, are the most used techniques for medical and non-medical BCIs. Like P300, VEP requires no training, but it has been shown to be faster [29]. As a drawback, the signal is usually very noisy, since its acquisition is performed in a non-invasive fashion, and the amplitude and phase of the VEP is very sensitive to stimulus parameters such as frequency and contrast.
The lack of a common evaluation framework for BCI systems caused the adoption of heterogeneous performance metrics. In literature, it is possible to find assessment of BCIs made on different metrics, usually reflecting the particular BCI application metric. As a result, it is sometimes hard, or even impossible, to compare BCIs performance to each other if different metrics have been used. In a review of the performance assessment for medical BCI systems, [30] shows that the most used metrics are accuracy, accuracy combined with information transfer rate (ITR), and ITR alone. ITR is a measure that estimate the quantity of useful information transferred from brain to machine, in terms of bits per second (b/s). ITR computation takes into account the number of possible inputs, the accuracy and the latency of the system. Such metric is generic and suitable for any BCI with a finite set of inputs (e.g. speller), but is not applicable for example in BCIs using sensorymotor rhythms to move a cursor on a screen. It is also under-standable that in medical BCI applications the focus is on the sole accuracy, since users do not have any other mean of communication. On the contrary, in non-medical BCI applications the latency (i.e. the time needed by the machine to detect which input the user is trying to activate) plays a critical role for the system’s acceptance by able-bodied users.
In this work, the goal is to explore the capabilities and to assess the performance of plug-and-play portable BCI systems for non-medical scenarios. Therefore, the focus will be on embedded wearable non-invasive systems adopting VEPs as control signals (in particular SSVEPs), and ITR as metric for performance assessment.
2.2
EEG signal
2.2.1 Signal Description
EEG measures the electric brain activity caused by electric currents that flow within the neurons of the brain. Neurons are the cells that constitute the brain tissues and their structure is depicted in Fig. 2.1. Despite the apparent simplicity of the neural cell structure, the biophysics of neural current flow relies on complex models of ionic current generation and conduction. Basically, when a neuron is excited by other neurons through burst of action potentials (APs), excitatory postsynaptic potentials (EPSPs) are
Brain Computer Interface 7
Figure 2.1: Structure of a neuron (source: Wikimedia commons). The cell body (a) contains the cell nucleus and acts as the cell’s life support center. The cell body gathers and aggregates the signals arriving from other cells though dendrites (b). The axon (c) allows the neuron to spread the signal away from the cell body to other neurons. The information is constituted by a neural impulse (d), flowing from the cell body to the peripheral synaptic terminals (e), that in turn communicate with another neuron.
generated at its aptic dendritic branches. The dendritic membrane becomes depolarized and extracellularly electronegative with respect to the cell body. This potential differ-ence causes a current, called primary current, to flow from the nonexcited membrane of the body to the dendritic tree sustaining the EPSPs [31]. The principle of conser-vation of electric charges imposes that the flow is looped with extracellular currents, called secondary current. Primary and secondary current both contribute to generate the magnetic field measured by the electrodes on the scalp; however, the spatial cell arrangement is critical for the superposition neural currents in order to produce mea-surable fields. In fact, the measured EEG signal is the result of the current generated by the EPSPs of thousands of synchronously activated neurons, because of the coher-ent distribution of their large dendritic trunks locally oricoher-ented in parallel, and pointing perpendicularly to the cortical surface [31]. The signal must cross several layer before reaching the electrodes places on the scalp, especially the skull, which attenuates the signal approximately one hundred times more than the soft layers [32]. Noise within the brain and over the scalp contribute to lower the SNR, and therefore only large amount of active neurons can generate enough potential to be recorded by scalp electrodes [32].
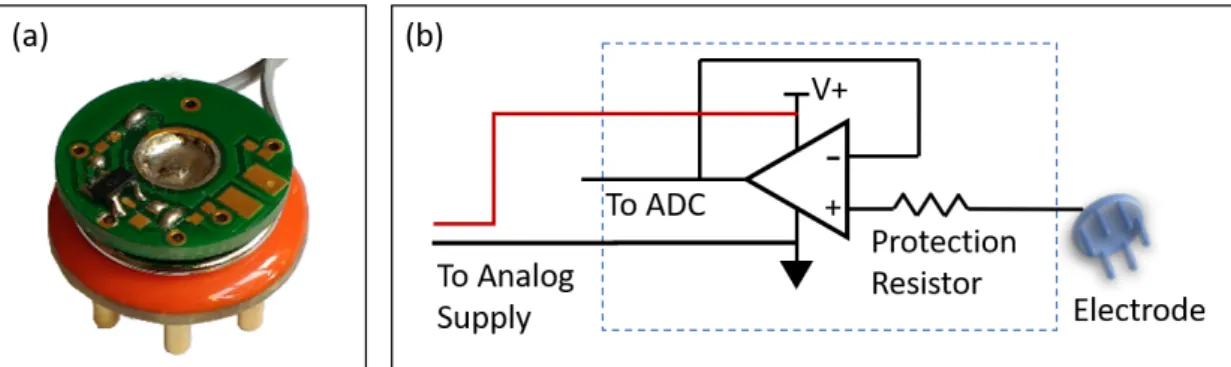
Brain Computer Interface 8
Figure 2.2: (a) Picture of the g.SAHARA dry electrode with custom amplifier PCB. (b) Electrical schematics of the custom amplifier PCB.
2.2.2 Signal Acquisition
EEG signal acquisition is an easy and non-invasive operation that allowed great spread of this technique over others (MEG, fMRI, ECoG). In fact, to acquire EEG signal it is sufficient to measure a set of electric potential differences between pairs of electrodes attached on the skin. However, detecting EEG activity is not a trivial task, since sensors and circuitry must cope with non-stable skin-electrode interface as well as with an intrinsically high-noise signal. Apart from brain activity unrelated to the SSVEP, additional sources of noise can come from acquisition system like electrical noise and external interference. The most common source of EEG signal degradation is the finite contact impedance at the interface between the electrode and the skin. A high value of contact impedance leads to a potential divider effect at the amplifier input, which causes a reduction of the capability to reject common-mode noise such as that from mains, increases the noise generated at the metal-skin interface and augments the effect of interference coupling through capacitive effects to the cables, or artifacts due to cable movement, microphony and piezoelectric effect. Contact impedance is minimized in clinical EEG protocols by removing superficial skin layers by abrasion and inserting a conductive gel or paste in-between the two surfaces. Skin preparation is obviously not suitable for non-clinical settings where system setup needs to be as quick and easy as possible for an untrained person, and associated infection risks are not acceptable.
To minimize setup time and allow self-positioning of the system, zero-preparation electrodes were adopted as interface between the system and the subject. Two options were evaluated, dry and wet electrodes. Dry electrodes are recognized as the best option for zero-preparation time. However, they present contact impedance up to 3 orders of magnitude higher than wet electrodes with skin preparation; hence, to mitigate such high contact impedance, an amplification stage is placed directly right on the electrode. Fig. 2.2 (a) and (b) show, respectively, a picture and the schematic of the active sensor custom PCB designed for this work. As single-ended amplification stages with gain higher than one reduce the rejection of common mode noise, only signal buffering
Brain Computer Interface 9 is performed on the active electrode by a low-power, low-noise, rail-to-rail Operational Amplifier (O.A.) connected as a unity-gain buffer. Protection resistors with 68 KΩ are used to limit patient auxiliary current in cases of single fault condition below the applicable limit of 50 µA. The O.A. is an AD8603 from Analog Devices, which has a quiescent current of 50 µAand low voltage noise (2.3 µV peak-to-peak in the 0.1 to 10 Hz band and 25 nV/√Hz at 1 KHz). The input leakage current is below 1 pA at room temperature, while total input capacitance is below 5 pF, which translates into an input impedance in excess of 500 MΩ in the EEG band. In Sec. 2.7.2, the system performance is evaluated either with wet passive electrodes (Kendall from Covidien-Medtronic [33]) and dry active electrodes (g.SAHARA from g.tec Gmbh [34]).
2.3
Taxonomy
State of the art of BCIs includes heterogeneous systems, that differ for target au-dience, application and design choices. A taxonomy of the existing BCIs could help to understand which kinds of devices have been developed so far. Traditionally, BCIs feature three main characteristics: independent vs dependent, invasive vs non-invasive, exogenous vs endogenous [1]. An independent BCI is a system that does not depend on peripheral nerves or muscles, which means that the brain activity necessary for control-ling the BCI does not need the activity from such brain peripherals (in this case, the optic nerve is considered brain core). Examples of independent BCIs are all P300-based BCIs where the stimuli are presented one at a time. In this case, the user gaze is fixed at the single stimulus source, and the user intention is what actually triggers the BCI. In-dependent BCIs are often used in medical scenarios, because they are especially suitable for people suffering from severe neuromuscolar disabilities. In contrast to independent BCIs, dependent BCIs need the activity of brain’s peripherals for the brain to generate the required activity. Examples of dependent BCIs are P300-based BCIs where symbols are displayed in a matrix fashion, or SSVEP-based BCIs, where all the symbols must appear to the user at the same time. In these cases in fact, it is the user’s gaze that determines the required brain activity. Dependent BCIs can also be used by disabled people to some extent. For example, the aforementioned dependent BCIs can be used by people affected by Amyotrophic lateral sclerosis (ASL), as long as they can move their eyes. However, dependent BCIs are overall more suitable for able-bodied users.
Invasive BCIs are those systems that require implanting electrodes into the users’ brain. This practice requires brain surgery and may affect patients’ health, and it is per-formed for research purpose only in medical scenarios. The technique used for invasive BCIs is called electrocortography (ECoG), also known as Intracranial EEG (IEEG) [1]. ECoG allows for better SNR and better spatial resolution than EEG; however, due to
Brain Computer Interface 10
Figure 2.3: BCI taxonomy proposed by [1]. The work proposed in this thesis belongs to the Visual Evoked category: the aim is to design a dependent, exogenous and non-invasive BCI.
its unpractical and risky application this technique is not likely to spread outside clinics and research field in a near future. Non-invasive BCI systems use electrodes placed on the scalp to acquire the EEG signal, resulting in more convenient, safe and inexpensive application. Electrodes are typically placed on a wearable cap or headband, and can be easily put on and off. Wet electrodes need some skin preparation beforehand that can take up to one hour according to the number of electrodes in use. On the contrary, dry electrodes can be put on in a plug-and-play fashion, with no skin preparation, reducing the setup time to a matter of seconds.
Exogenous BCIs are those that systems exploit external stimuli in order to evoke the brain activity necessary for interaction with the machine. Examples of exogenous BCIs are those based on P300 and SSVEP potentials, and they are more suitable for plug-and-play systems since they do not require any user training. Endogenous BCIs do not rely on external stimuli, and the BCI control signals are based mainly on brain rhythms and other potential. Endogenous systems allow to interact with the BCI in a more natural manner, through user’s intent. However, the user must learn to produce the specific patters that are decoded by the system, and the patterns can be meaningless encoding of BCI actions. For example, in a sensorymotor BCI the intent of moving the left arm can be mapped into a command for a household appliance. User training for endogenous BCIs is done via neurofeedback display, where the user can see how the BCI input changes according to his/her brain activity, and therefore learn how to control it. The length of the training depends on the subject, the application and the training strategy. Figure 2.3 shows the high level taxonomy proposed in [1]. One of the goals
Brain Computer Interface 11 of this thesis is the assessment of wearable, low power, fast, plug-and-play BCI systems that can be used daily in non-medical scenarios, and therefore, in the reminder of this chapter, the focus will be on dependent, exogenous and non-invasive systems based on SSVEPs.
2.4
State of the Art
Table 2.1: Comparison between state-of-the-art BCI Systems in terms of setups and ITR.
Ref. Stimulus type Phase synch. Signal proc. Synch/ Asynch Acq. system Training Electrodes type N Elec-trodes Processing platform Classifier ITR
[35] SSVEP yes TRCA synch Synamps2 yes wet 9 PC n/a 5.42
[36] SSVEP yes CCA synch Synamps2 yes wet 9 PC n/a 4.50
[37] SSVEP no CCA synch Synamps2 no wet 9 PC n/a 1.75
[38] SSVEP no MFD synch Quickamp no n/a 1 PC max 0.83
[39] c-VEP yes CCA synch g.USBamp yes dry 16 PC threshold 0.76
[40] SSVEP no CCA asynch custom no wet up to 16 PC confidence
indicator 0.72
[41] SSVEP no PCA asynch g.tec no wet 6 PC threshold 0.63
[42] SSVEP no FFT synch NeuroSky n/a n/a 2 tablet max 0.56
[43] SSVEP no PSDA synch custom no wet 2 PC max 0.46
[44] SSVEP no FFT synch Blackrock Cerebus
no dry 1 PC threshold 0.44
[45] SSVEP no PSDA synch custom no wet 3 phone max 0.40
CCA dry 0.44
noncontact 0.24
[46] SSVEP no CCA asynch custom no dry 3 wearable threshold 1.06
After a brief story of BCIs development, this section reviews the current state of the art on BCIs focusing on dependent, exogenous, non-invasive systems, based on SSVEPs or more generally VEPs potentials. Table 2.1 shows a comparison of such systems in terms of setup and ITR.
The first BCI spellers were introduced at the end of the 80s and exploited a cerebral reaction called Event-Related Potential (ERP), consisting in very small responses to specific events or sensory stimuli, which can be detected by acquiring and processing the EEG signal on the scalp of the subject [47]. In particular, P300 is an ERP, which is elicited by a relevant stimuli (i.e. the flashing of the intended symbol), which is infre-quently presented among non-relevant ones (i.e. the other available symbols). In [48], researchers presented a BCI capable of detecting 36 different target stimuli associated with the letters of the alphabet and some symbols. By repeatedly flashing entire rows or columns of a matrix constructed with the target characters, the authors capture the attended symbol as the intersection of the row and column that elicited the P300 re-sponse. This first approach to P300 BCI led to an overall performance of 2.3 characters per minute with 95% accuracy, which translates to an ITR of 0.17 bits per second.
Brain Computer Interface 12 and Donchin’s system is enhanced with regard to the computing platform or the pro-cessing algorithm, resulting in ITR improvements up to respectively 0.45 and 0.40 b/s. While less than half bit per second might be an acceptable transfer rate for disabled people, it is still quite a slow communication speed to be tolerated by able-bodied sub-jects, which most likely will refuse to adopt such system. Steady State Visual Evoked Potential (SSVEP) is another BCI paradigm that has been used in more recent works with considerable success [35–38]. This potential is elicited in the primary visual cortex as a result of repetitive external visual stimulation, and is therefore phase and frequency locked with it. Processing requires identifying the frequency (and possibly the phase) of the SSVEP signal to determine which stimuli evoked it. The SSVEP paradigm is attractive due to its higher signal-to-noise ratio (SNR) in comparison with ERPs, being significantly more immune to eye-related and electrode shifting artifacts when a proper frequency band is used [29].
SSVEPs relying only on frequency information have two major advantages with re-spect to mixed phase/frequency SSVEP and ERPs. The first one is that they do not require synchronization between stimuli and detection platform. This allows to mini-mize setup time since it considers stimulation and acquisition/processing as stand-alone systems. Such solution simplifies SSVEP use in IoT environments where the user might need to interact with several different stimuli presentation systems, which might not be on the same network or might not be connected at all [51]. The second advantage is that they can operate directly without the need for a training phase in which the BCI adapts to the specific user. As this training is often a function of the specific session setup (including exact electrode position and contact quality), in many cases it must be peri-odically repeated [52], severely hampering the plug-and-play features of such a device. Nevertheless, many works still rely on both frequency and phase, significantly reducing the advantages of such techniques and focusing only on maximizing ITR [53]. This work demonstrates that practical ITR can be achieved with ”frequency only” SSVEP [46].
Basic feature extraction for SSVEP can be performed using simple techniques. An early example is found in [54], where the authors designed and implemented a BCI to help users to input phone numbers based almost entirely on FFT-based Power Spectral Density Analysis (PSDA). Some studies later combined FFT-based features with more advanced classification algorithms such as Linear Discriminant Analysis (LDA) [55], Support Vector Machine (SVM) or Artificial Neural Networks (ANNs) [56] to improve performance. Nevertheless, these systems are relatively slow, with ITR of 0.56 and 0.44 b/s, respectively.
Other systems employ different signal processing techniques like PSDA [43,45], PCA [41] and Matched Filter Detector (MFD) [38]. Chi et al. [45] and Garcia et al. [43] developed a BCI based on custom acquisition systems. The former uses LED matrices for stimuli presentation, while the latter focuses on assessing the performance of three
Brain Computer Interface 13 types of electrodes: wet, dry and contactless. Both of them use PSDA for features extraction, achieving an ITR of respectively 0.44 and 0.46 b/s. Cecotti [41] proposes an asynchronous multilevel speller grouping letters within three stimuli, meaning that for each letter selection the BCI must correctly perform SSVEP detection three times. Feature extraction is performed using PCA, and the ITR is 0.63 b/s. Chang et al. [38] analyzed SSVEP response with a MFD, which consists of a bank of matched filters, followed by an amplitude detector. The authors managed to remotely control a wheel robot, achieving an ITR of 0.83 b/s using only one electrode.
Such systems have the common drawback of low ITR. To tackle this issue, a well accepted solution is represented by the use of Canonical Correlation Analysis (CCA). Developed by Hotelling [57] and first introduced by Lin et al. in the BCI context, it explores the relationship of two multivariate sets of variables, determining if they have some underlying correlation [58]. Lin et al. [58] employed CCA to extract the cor-relation features from nine frequency-coded simulations from multiple EEG channels, demonstrating that ITR can be improved with respect to FFT-based methods. Authors in [59] have also confirmed that CCA outperforms FFT-based methods in accuracy and response delay. Using a joint frequency-phase modulation method to tag 40 characters with 0.5-s-long stimuli, authors in [36] have developed a noninvasive BCI capable of achieving an ITR of 4.50 b/s. Some attempts were made also with similar correlation analyses, like in Nakanishi et al. [35] where a high speed SSVEP brain speller uses Task Related Component Analysis (TRCA), a spatial filtering in which weight coefficients are optimized to maximize the covariance of time-locked SSVEP trials. The authors achieved 5.42 b/s ITR using 9 channels and 40 phase-locked flickering targets. Another powerful method for direct frequency estimation, described in [60,61], is based on the Vandermonde decomposition. Although this solution provides a direct frequency estima-tion with a short time window, its computaestima-tional complexity hinders the implementaestima-tion on a resource-constrained platform because of the large dimension (> 64×64) of the input matrices calculated to execute the algorithm.
The approaches cited above can reach high level of ITR, enabling a fast BCI for SSVEP decoding. Anyway, they require a training session to adapt the setup on the user. A solution to adapt the CCA without specific subject-dependent training is pre-sented in [37], where authors include in the CCA the information of frequency harmonics from 9 EEG channels, achieving an ITR of 1.75 b/s using 42 different frequency-coded stimuli. Nevertheless, all the aforementioned solutions require a synchronization mecha-nism between stimuli and acquisition phases. Moreover, to maximize accuracy and ITR, EEG acquisition systems rely on 9 wet electrodes, which limit ease-of-use and unob-trusiveness, hindering the deployment of such solutions in wearable, minimally invasive form-factor.
Brain Computer Interface 14 based system, since it is based on non-synchronized stimuli presentation and it does not require subject-dependent training. However, it achieve an ITR lower than 1 b/s, with a bulky setup, based on 16 wet EEG electrodes.
The lesson learned from the analysis of the SoA in BCI speller is that the develop-ment of a high-performance wearable platform for BCI spelling is still an open challenge. Although some systems target a portable setup, (e.g. a tablet [42] or a smartphone [45]), they achieve low values of ITR, in a bulky setup (i.e. many electrodes which requires skin preparation) with power-hungry computational platforms.
Hence, the goal of this chapter is to show a design for a wearable BCI system that relies on a minimally intrusive setup (i.e. 3 dry sensors), without subject dependent training and stimuli synchronization, and achieving ITR higher than 1 b/s.
2.5
Canonical Correlation Analysis
The state-of-the-art algorithm for SSVEPs detection is named Canonical Correlation Analysis (CCA) [62]. This method quantifies the linear dependency between two multidi-mensional variables by finding a couple of linear combinations, one for each multidimen-sional variable, that maximizes their correlation. The resulting maximized correlation is called canonical coefficient and extends the concept of correlation to multidimensional variables. More than that, CCA actually provides a whole set of canonical coefficients, sorted by size. The first canonical coefficient of the set is the biggest, and represents the correlation between a pair of linear combinations that maximizes the correlation. The second canonical correlation coefficient is the second biggest, and represents the correlation between another pair of linear combinations, that are uncorrelated with the previous pair. The number of canonical correlation coefficients and corresponding linear combination pairs depends on the dimension of the two variables, and corresponds to the minimum of the dimension of the two variables. In SSVEP-based BCIs, the two multidimensional variables to be correlated are the nEEG input channels, and a set of
m reference signals that identify the frequency of one single stimulus, usually sine and cosine of that frequency and one or more harmonics. Therefore, one execution of the CCA algorithm returns a set of size d=min(n, m) of canonical correlation coefficients that quantify the correlation between the EEG signal window and one specific stimulus. In order for the system to compute an output, it is necessary to retrieve canonical cor-relation values with respect to all the reference signal sets, which means executing CCA for each possible stimulus. Figure 2.4 summarizes the CCA algorithm and its actual implementation on many statistical packages.
Brain Computer Interface 15
Figure 2.4: Block diagram of CCA algorithm and implementation. (a) Signal matrices input for CCA. (b) CCA formulation algorithm. (c) CCA implementation algorithm. (d) Feature extraction.
Formally, let us define the multidimensional variable X as a time window of length
Ns samples of the nEEG input channels, such that: X={X1, X2, ..., Xn}, Xi={xi,1, xi,2, ..., xi,Ns},
i= 1, . . . , n.
Let us define the reference signals as a set of sine and cosine of the stimulus frequency
f and its Nh harmonics, then the multidimensional variableY is defined as follows:
Y = Y1 Y2 Y3 Y4 .. . Ym−1 Ym = sin(2πf t) cos(2πf t) sin(4πf t) cos(4πf t) .. . sin(2Nhπf t) cos(2Nhπf t) fort= 1 Fs, 2 Fs,· · · , Ns Fs
whereFsis the sample frequency of the EEG acquisition system. Let us define the linear
combinations ofX andY as:
U =Xa V =Y b
Brain Computer Interface 16 Then the function to maximize is:
ρ= max
a,b corr(Xa, Y b)
After retrieving the first canonical correlation coefficient ρ1 and the corresponding
couple of linear combination coefficient matrices a1 and b1, the algorithm continues the
search looking for a couple (a2, b2) such that the linear combinations U2 = Xa2 and V2=Y b2 belong to an orthogonal subspace with reference toU1 =Xa1 and V1 =Y b1.
The search continues until the orthogonal subspaces of the less ranked multidimensional variable are exhausted, resulting in a vector of canonical coefficients
R={ρ1, ρ2, . . . , ρd}
sorted in decreasing order. Quite often only the first canonical coefficient is used as feature for frequency detection. However, authors in [63] proved that the combination of the information held by the other coefficients helps to improve frequency detection accuracy. In particular, the feature used for frequency detection is calculated as the Euclidean norm of the firstscanonical coefficient:
r= v u u t s X i=1 ρi
In this work, the Euclidean norm of the first s= 3 canonical coefficients is used as a feature for frequency detection. The implemented algorithm is described later in Sec. 2.6.2
2.6
Wearable BCI
The system presented is a novel embedded asynchronous BCI featuring a custom acquisition platform and non-invasive dry electrodes for real-time classification of eight frequency-coded stimuli. Being able to operate in stand-alone mode, it provides full portability by removing the need for any external processing device. At the core of the system, a CCA-based algorithm performs the feature extraction of the incoming EEG signals from three dry electrodes. The system requires no training phase and does not need to tailor any parameter on the specific subject or trial, as all critical parameters of the system, such as the number of channels and location, frequency band, and window
Brain Computer Interface 17
Figure 2.5: Architectural diagram of the proposed system. Fig. 2.5 (a) and (b) show, respectively, an image and the block diagram of the wearable node. Fig. 2.5 (c) presents an image of the dry active electrodes and (d) the electrical schematics of the custom amplifier stage PCB. Finally, in Fig. 2.5 (e) the LCD screen with stimuli presentation is depicted.
lengths, are fixed through offline data analysis before the final implementation in a user-independent fashion. An overview of the overall system is depicted in Fig. 2.5.
The wearable platform is designed for medical IoT applications and derived from [64] and [65]. The system is composed of an active EEG sensor array interfaced to a custom board with a biopotential ADC and a low power microcontroller with DSP capabilities. It acquires and processes the subject response to a visual stimuli. The results of the CCA analysis, computed in real-time on the microcontroller, can then be communicated to the host PC as HMI commands.
2.6.1 Hardware
The proposed IoT node is based on a multichannel commercial Analog Front End (AFE) [66] connected with a low power ARM Cortex M4 microcontroller. The AFE is the de-facto standard used in biopotential acquisition platforms. The 8 channels are connected in single ended configuration with the active EEG sensors while the AFE’s back-end streams the data via SPI to the microcontroller. The ARM Cortex M4 mi-crocontroller is equipped with a single precision FPU unit and has an instruction set architecture with DSP extensions to enable a more efficient near-sensor processing. It can reach operating frequency of 168 MHz with 192 kB of RAM and 1 Mb of FLASH memory.
The board is a 6-layers Printed Circuit Board (PCB) with a single solid ground plane. To minimize current return paths, the power planes are split, keeping separated the analog and digital circuitry. Discrete components were carefully placed on both sides of the PCB to maximize signal integrity, maintaining a low level of noise and a small
Brain Computer Interface 18 form-factor that results in 85x50 mm. The board mounts a dedicated IC for power man-agement, that automatically detects the power source (battery or USB). Analog, digital and communication subsystems are supplied by separate low-dropout voltage regula-tors. This versatile configuration allows power management strategies, like duty-cycling submodules, to enhance battery life.
2.6.2 Firmware implementation
All firmware has been implemented in C language on a low-power ARM CORTEX M4 microcontroller, usingSTM32 WorkBench, a dedicated Integrated Development En-vironment (IDE) based on the open-source GCC compiler version 5.4.1. The proposed implementation of CCA is based on the Golub algorithm [67, 68], which, by virtue of its computational efficiency, is widely used in many statistical packages [69]. The Golub algorithm relies on the computation of two QR decompositions, followed by a SVD fac-torization. The implemented algorithm is summarized in Fig. 2.4c.
In the implementation of the firmware, this algorithm must be executed Nf times,
once for every stimulus presented at different frequency, and its execution must be op-timized in order to achieve near real-time performance even with several stimuli. Three levels of optimization are applied: (i) usage of CMSIS-DSP library provided by ARM whenever possible [70], (ii) precomputation and storage in Flash memory of the orthog-onal matricesQy resulting from the QR decomposition of all the reference signals, and
(iii) input filtering and downsampling. A time window of the acquired EEG signal chan-nels constitutes the multidimensional variable X. The length Ns of the time window
is a parameter affecting the overall BCI performance, and its computation is described later.
Before applying CCA, the input signal must be preprocessed in two steps: (i) a band pass filter is applied for removing low frequency and 50 Hz noise, and allowing a downsampling factor up to 10, that reflects in a speedup>4 in CCA computation; (ii) all the channels are reduced to zero mean in order to be later correlated with the refer-ence signals. The band pass filter features a low pass 100 taps FIR with cutoff frequency at 18.4 Hz, and a second order high pass IIR. The low pass FIR filter guarantees to preserve the signal amplitude up to the first harmonic of the higher stimulus frequency, since this system usesNh = 1, and at the same time it achieves 60 dB attenuation at 50
Hz, without introducing excessive delay or computational effort.
After preprocessing, the resulting multidimensional variable X must be correlated with the corresponding reference signals for each frequency used for the stimuli. The QR decomposition is therefore computed once only, obtaining the orthogonal matrix
Brain Computer Interface 19 matrix is multiplied by the correspondingQy(k) matrix already precomputed and stored
in Flash memory. The resulting matrix is factorized by the SVD, where the optimized code skips all the computation that involves elements of the matrices which zeros values. All the coefficients of the diagonal matrixS obtained by the decomposition are used in the computation of the Euclidean norm, which is the measure of the correlation be-tween EEG and reference signal that is used for frequency detection. The algorithm performance is discussed in Sec. 2.7.3.
Since this BCI system is asynchronous, independent and potentially disconnected from the source of the stimuli, at the end of each data window processing the system must deliver some output, regardless of actual activity of the user. The frequency clas-sification is performed by simple thresholding: if the maximum of the Nf correlation
features exceeds the threshold, then the BCI output is the corresponding frequency, otherwise the system output is the rest or idle state, decoded with class 0. The choice of the threshold value will be discussed in Sec. 2.7.2.
2.7
Experiments and results
2.7.1 Experimental setup
A graphical interface of the SSVEP-based BCI system usually consists of different areas of a screen which are associated to different commands, e.g. letters or symbols, that flicker at specific frequencies. When the user pays attention to a particular flicker-ing command, SSVEPs are induced at the correspondflicker-ing frequency and its harmonics. The BCI system identifies the user intention by quantifying and classifying SSVEP. It is generally acknowledged that the SSVEP response depends on the frequency of the stim-ulation, nevertheless there is no consensus on which frequency bands are better suited for maximizing information transfer rate and accuracy. Regan has shown three distinct maxima in the response to flickering stimuli at 10, 13-25 and 40-60 Hz [71]. Other sub-sequent works showed similar results [72]. Ku´s et al. [73] observed how signal-to-noise ratio of SSVEP signal vs. unrelated brain activity is maximized in the 8-20 Hz band, however not taking into account higher order harmonics in the computation. It should be observed that, in general, the lower the target frequencies, the lower the sampling rate required to the system, and consequently its power consumption, which is of major importance in portable systems.
The BCI system presented in this work is the product of an initial phase of offline tests used to fix critical parameters, such as the number and location of electrodes, fre-quency intervals, window length for data processing, etc. Subsequently, online tests have been carried out to assess the real-time performance. Eight healthy subjects (aged 25-40
Brain Computer Interface 20
Figure 2.6: Acquisition setup: the flickering stimuli layouts (layout L2 in the figure, featuring four checkerboards) are presented on a 24-inches LED screen. The subject stares at the screen from a distance of 80 cm.
years) with normal or corrected-to-normal vision participated in the offline experiments. Another group of five subjects was taken later for the online tests. All participants re-ported no history of neurological or psychiatric disorders and provided a written consent to participate in the experiments.
SSVEP signals are elicited by adjusting the luminosity (contrast) of black and white 10 x 10 square checkerboards [74] on a grey background employing the sampled sinu-soidal stimulation method [75] on three different layouts. The first layout (L1) only contains one checkerboard covering 75 % of the screen and centered at the middle point and is employed to display different stimuli in successive order. The second layout (L2), comprises four checkerboards arranged in a 2 x 2 pattern at equidistant positions, each displaying a different frequency-coded stimulus (a single checkerboard occupies 20 % of the screen). The third layout (L3) contains eight checkerboards arranged in a 2 x 4 pattern, each one covering 10 % of the screen. The design of the layouts aims to test the level of response of the SSVEP signals with consecutive smaller stimuli in the presence of non-target stimuli. Fig. 2.6 depicts the acquisition setup with L2.
Brain Computer Interface 21 The luminosity (contrast) of the checkerboards was adjusted using the following equation:
Contrast(f, φ, i) =A·sin(2πf i/Fr+φ) +A
where i indicates the frame index, A the initial amplitude, φ the initial phase, constant for all experiments (φ=0), f the frequency of the stimulation, and Fr is the
refresh rate of the screen. All checkerboards included a grey diagonal cross to help visual fixation. All the textures were generated using Psychtoolbox 3.0.10 for Windows in Matlab 9.1. All the layouts were presented on a 24-inch LED (60fps) screen at a distance of approximately 80 cm. This setup is fixed for all the subjects, in order to measure the SSVEP elicited by the most uniform stimulation possible. Since there is no uniformity in literature for the distance between the subject and the screen ([3,76,77]), this choice is arbitrary.
EEG data were acquired using the hardware presented in section 2.6.1 at a sample rate of 1 KHz. For the offline test, five electrodes over the occipital lobe (P5, PO3, POZ, PO4, and P6) and two over the frontal lobe (F3 and F4) were placed to record the SSVEPs, with reference and ground electrodes located at A1 and A2 respectively. Online tests were performed only with three electrodes, located at P5, POZ, and P6, while reference and ground remained at the same position. Electrodes impedance was kept below 10KΩ. Triggers generated by the stimulation program were bound to the incoming raw data by custom software. It is worth mentioning that all experiments were repeated twice to evaluate the performance of the dry electrode system with respect to a classic wet configuration.
Equally spaced frequency-coded stimuli ranging from 5 Hz to 17.5 Hz, with a step of 1.2 Hz were used to select suitable frequency targets. Each trial included five seconds of stimulation followed by 5 seconds of pause to reduce visual fatigue. The results from eight test subjects are summarized in Fig. 2.7 showing that the range of frequencies between
5-12.2 Hz have a significantly higher average correlation magnitude. Nevertheless, the useful range has been narrowed up to 9.5 Hz to avoid any interference from the alpha band in the final implementation. Simultaneously, the design exploits an exhaustive search to determine the minimum number of electrodes required, finding that there are no significant differences in correlation when using only the electrodes P5, POz and P6 with respect to the full setup. Thus, the final system adopted these changes allowing us to maximize the performance while reducing overall the complexity and intrusiveness of the hardware. It is worth noticing that Fig. 2.7 only presents the results of the wet-electrodes test since there are no significant differences when using dry electrodes.
Brain Computer Interface 22
Figure 2.7: Average CCA correlation of SSVEP responses for different stimuli (x-axes) calculated with different reference signals (y-(x-axes). On the diagonal it is possible to observe higher correlation due to the correspondence between the stimulus frequency and the reference signals. Noticeably, the lower part of the stimuli spectrum allows for higher correlation response with respect to the higher part.
2.7.2 Experimental results
The system presented at 2.6.2 was evaluated using dry and wet electrodes while performing a new test session using L2 and L3 layouts presenting four and eight simul-taneous stimuli, respectively. All the stimuli were coded using a ∆F =range/Nstimuli,
to allow maximum separation between targets in the frequency range. The subjects (same as the previous test) fixed the sight at the target frequency indicated with a red square before the onset of the stimulation. Later, all the stimuli remained active for five seconds with a resting time of 5 seconds in between trials. The experiment ends when the subject has been staring once at each stimulus on the screen.
An exhaustive analysis of the offline results shows that the most performing data window length is 2 s for both wet and dry systems, which turns in Ns = 2000 samples
Brain Computer Interface 23
Figure 2.8: Average ITR results for the system with wet electrodes (blue triangles), and dry electrodes (red circles) calculated using different classification thresholds. A threshold value of 0.55 is shown to maximize ITR for both wet and dry electrodes.
to process for each channel at each CCA iteration. This window size guarantees a good trade-off between system latency (∼ 2s) and accuracy (> 90%). Even if the system is asynchronous, offline system latency is assessed by measuring the time interval between the stimulus onset and the first correct detection. For detailed results description refer to tables 2.2 and 2.3. The other parameter of the system, the classification threshold, is chosen to maximize the average ITR, calculated for the asynchronous BCIs as in [78]:
IT R= 1−Pr
davg
log2Nf + (1−Pw) log2(1−Pw) +Pwlog2
PW Nf −1
!
where Pr is the probability of non-detected stimuli or trial error, Pw is the
prob-ability of incorrect detected cases, Nf is the number of target stimuli, and davg is the
average delay or latency of the system in seconds. Fig. 2.8 depicts the values of the average ITR of the wet and dry system calculated with several thresholds. The figure shows that the threshold value of 0.55 maximizes both curves, therefore it is the most suitable threshold value to use for the BCI output classification.
Brain Computer Interface 24 for wet and dry electrodes. Even though the average latency for the 4-stimuli wet system is smaller than the 8-stimuli system, the latter achieves higher ITR due to the increase in the number of targets. This situation improves when analyzing the dry systems, where the 8-stimuli not only outperforms the 4-stimuli, it also achieves similar performance than the wet system. These results also demonstrate that the interference created by placing different stimuli at the same layout with decreasing target size is negligible.
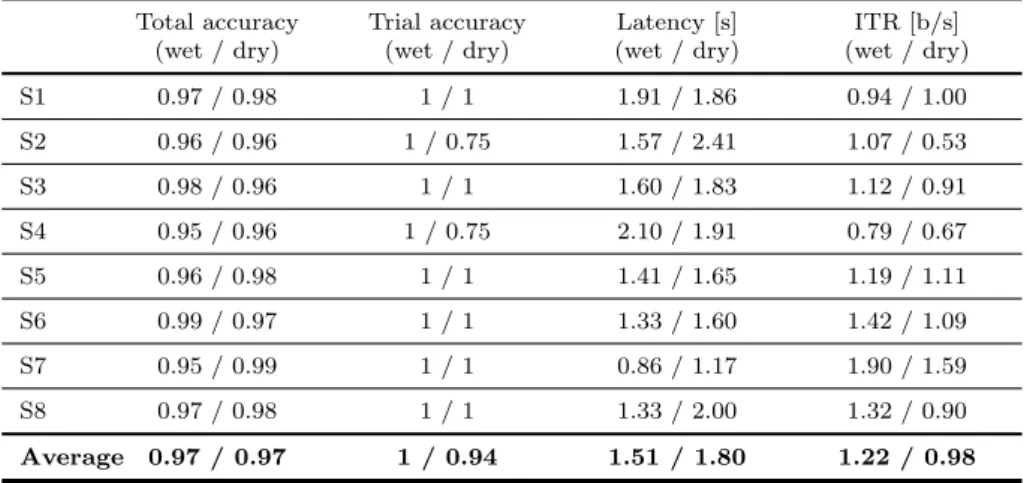
Following the results introduced above, the system is validated while performing the acquisition of the EEG data and classification in real time, employing five test sub-jects, that have not been involved in the offline experiments. To ease the computation of the results, the outputs of the classification are transmitted directly to a computer using a BT communication module, automatically synchronized with the onset of the corresponding stimulation by a custom software. During the experiments, the checker-boards with the target frequency were indicated with a red square that appears before the stimulation. Once a valid frequency was detected, the stimulation was stopped and the detected frequency was highlighted and cued with a white frame. The accuracy of the system was then asserted by the number of correct classifications over the total number of classifications, and the latency is computed as the time needed for detection of the trials that succeeded. The results of the experiment are summarized in tables 2.4 and 2.5, allowing us to conclude that there are no significant differences between offline and online experiments. Also, the average ITR using eight stimuli and the dry sensor interface is 1.25 b/s, proving that the introduced embedded implementation can achieve performance that is comparable with non-wearable systems [37–39, 41], while outperforming other wearable or mobile systems [40,42,45].
Table 2.2: Offline results for 4 stimuli BCI, wet and dry setup.
Total accuracy Trial accuracy Latency [s] ITR [b/s] (wet / dry) (wet / dry) (wet / dry) (wet / dry) S1 0.97 / 0.98 1 / 1 1.91 / 1.86 0.94 / 1.00 S2 0.96 / 0.96 1 / 0.75 1.57 / 2.41 1.07 / 0.53 S3 0.98 / 0.96 1 / 1 1.60 / 1.83 1.12 / 0.91 S4 0.95 / 0.96 1 / 0.75 2.10 / 1.91 0.79 / 0.67 S5 0.96 / 0.98 1 / 1 1.41 / 1.65 1.19 / 1.11 S6 0.99 / 0.97 1 / 1 1.33 / 1.60 1.42 / 1.09 S7 0.95 / 0.99 1 / 1 0.86 / 1.17 1.90 / 1.59 S8 0.97 / 0.98 1 / 1 1.33 / 2.00 1.32 / 0.90 Average 0.97 / 0.97 1 / 0.94 1.51 / 1.80 1.22 / 0.98
Brain Computer Interface 25
Table 2.3: Offline results for 8 stimuli BCI, wet and dry setup.
Total accuracy Trial accuracy Latency [s] ITR [b/s] (wet/dry) (wet/dry) (wet/dry) (wet/dry) S1 0.92 / 0.92 1 / 1 2.11 / 2.84 1.12 / 0.84 S2 0.93 / 0.93 1 / 1 1.43 / 1.66 1.69 / 1.48 S3 0.89 / 0.96 1 / 1 2.24 / 3.25 0.99 / 0.82 S4 0.94 / 0.92 1 / 1 1.71 / 1.87 1.46 / 1.27 S5 0.95 / 0.97 1 / 1 1.70 / 1.59 1.51 / 1.70 S6 0.98 / 0.98 0.75 / 1 2.37 / 2.17 0.90 / 1.28 S7 0.74 / 0.94 1 / 1 1.21 / 3.42 1.20 / 0.74 S8 0.92 / 0.91 1 / 1 1.53 / 1.58 1.54 / 1.48 Average 0.91 / 0.94 0.97 / 1 1.79 / 2.30 1.30 / 1.20 Table 2.4: Online results for 4 stimuli BCI, wet and dry setup.
Total accuracy Trial accuracy Latency [s] ITR [b/s] (wet/dry) (wet/dry) (wet/dry) (wet/dry) S1 0.88 / 0.87 1 / 1 0.76 / 3.01 1.69 / 0.41 S2 0.87 / 0.91 1 / 1 0.76 / 1.34 1.64 / 1.06 S3 0.91 / 0.92 1 / 1 1.44 / 2.05 1.01 / 0.72 S4 0.93 / 0.94 1 / 1 2.16 / 1.31 0.70 / 1.24 S5 0.89 / 0.92 1 / 1 1.36 / 0.99 0.96 / 1.48 Average 0.89 / 0.91 1 / 1 1.30 / 1.74 1.20 / 0.99
Table 2.5: Online results for 8 stimuli BCI, wet and dry setup.
Total accuracy Trial accuracy Latency [s] ITR [b/s] (wet/dry) (wet/dry) (wet/dry) (wet/dry) S1 0.83 / 0.83 1 / 1 2.01 / 2.52 0.92 / 0.74 S2 0.84 / 0.88 1 / 1 1.19 / 1.34 1.62 / 1.57 S3 0.89 / 0.86 1 / 1 1.18 / 1.50 1.83 / 1.36 S4 0.81 / 0.76 1 / 1 1.65 / 1.40 1.07 / 1.08 S5 0.79 / 0.83 1 / 1 1.79 / 2.02 0.94 / 0.92 Average 0.83 / 0.83 1 / 1 1.56 / 1.76 1.27 / 1.13 2.7.3 Computational results
The algorithm described in 2.6.2 was implemented on the board described in 2.6.1. DMA transfer, clock gating and optimization of clock frequency were used to minimize the power consumption. To speed up execution time, the code employs CMSIS [70] func-tions when possible, and pushed compiler optimization to -O2 within those funcfunc-tions. As mentioned before, the number of samples to process at each CCA iteration is 2000. However, it is possible to downsample the data up to factor 10 for a twofold goal: reduce power consumption and decrease the delay between two consecutive classifications. In fact, higher BCI output frequency contributes to boost ITR and to enhance the user real
Brain Computer Interface 26
Figure 2.9: Trend of the power consumption calculated for several downsampling factors (blue triangles) for four stimuli.
Figure 2.10: Trend of the ITR/power consumption ratio calculated for several CCA execution periods with wet electrodes (blue triangles) and dry electrodes (red circles).
time experience. Downsampling 10 allows to reduce MCU cycles from about 3157k to about 768k, achieving speedup>4 without significantly degrading the accuracy. In fact, while ITR remains constant, Fig. 2.9 shows the decreasing curve of power consumption according to downsampling factor.
The time needed to execute the optimized algorithm on the custom device is less than 5 ms, which allows us great liberty in the choice of the performance/power consumption
Location-Based BCI 27 trade-off. In principle, the power consumption decreases when the CCA execution period increases, because the algorithm is execute less frequently. At the same time, also the ITR decreases due to BCI response latency growth. Fig. 2.10 shows the trend of the ITR over power consumption with reference to the period of the CCA execution. The curves suggest that 100 ms is a good CCA execution period for both dry and wet systems, in fact 100 ms period guarantees average ITR>1b/s, power consumption of 22.4 mW for four stimuli and 27.5 mW for eight stimuli, and ten outputs per seconds for a real-time user experience. The power consumption was measured on the board using a source measure unit instrument.
Chapter 3
Location-Based BCI
Geolocation is the enabling technique for a wide spectrum of Location-Based Services (LBS) involving, for instance, navigation, transport, tourism, entertainment, healthcare and augmented reality applications. While outdoor localization is mostly solved by Global Positioning System (GPS) technology, indoor localization is still an open issue due to heterogeneity of indoor environments and impracticality of a common approach for all single cases [79]. In fact, GPS is an unreliable technology for indoor positioning, since its signal is not strong enough to be correctly received inside buildings.
Several approaches for indoor localization have been proposed. Some of them ex-ploit existing communication infrastructures like WiFi [80] and FM radio signals [81], others rely on ad-hoc infrastructures like ZigBee [82], Bluetooth [83], Ultra Wide Band (UWB) [84] and Radio Frequency Identification (RFID) [85]. Other systems do not need any kind of specific infrastructure, since they compute the device position using embedded sensors like magnetometer [86], accelerometer, and gyroscope. Furthermore, several hybrid approaches have been proposed, based on complementary technologies like inertial sensors and WiFi [87] or Bluetooth and WiFi [88]. Merging geolocation with EEG monitoring can serve as a tool to understand the brain activity during daily tasks, empowering the efficiency of future BCI systems in interpreting the user’s inten-tions and functional state of mind. However, only few contribuinten-tions proposed a system that combines the two information sources. In [89], the authors propose a BCI system for controlling a wheelchair, based on the P300 evoked potential and triggered though the oddball paradigm technique. The authors achieved geolocation implementing an optical-based tracking system on the wheelchair. In [90], the author proposes a cloud based solution for patients localization and monitoring in
![Figure 2.3: BCI taxonomy proposed by [1]. The work proposed in this thesis belongs to the Visual Evoked category: the aim is to design a dependent, exogenous and non-invasive BCI.](https://thumb-us.123doks.com/thumbv2/123dok_us/859182.2609549/27.893.153.790.119.463/figure-taxonomy-proposed-proposed-category-dependent-exogenous-invasive.webp)