Stable URL : http://iopscience.iop.org/article/10.1088/1755-1315/55/1/012047/meta
DOI : 10.1088/1755-1315/55/1/012047
How to Cite:
Sariffuddin, S., Astuti, Khristiana Dwi., Farhaeni, Gustika., Wahdah, Lutfiyatul. (2017). Vulnerability Assessment: The Role of Coastal Informal Settlement Growth to Social Vulnerability in Genuk Sub-District, Semarang City. IOP Conference Series: Earth and Environmental Science, 55(1), 012047. doi:10.1088/1755-1315/55/1/012047
Vulnerability Assessment: The Role of Coastal Informal
Settlement Growth to Social Vulnerability in Genuk
Sub-District, Semarang City
Sariffuddin1*, Khristiana Dwi Astuti1, Gustika Farhaeni2, Lutfiyatul Wahdah3
1 Department of Urban and Regional Planning, University of Diponegoro, 2 Perum Perumnas – Semarang Jl. Wilis No. 23 Candisari, Semarang 3 Master of Environmental Science, University of Diponegoro
*Email: sariffuddin@live.undip.ac.id
Abstract. Tidal, land subsidence and flooding in Semarang City brought many consequences to the city's economic and social conditions. In the economic sector, the largest contributor to GDP derives from industries that are located in the coastal area. The environmental problems also affect the ability of social adaptation and vulnerability. This issue encourages the efforts of the public and the government. City conditions are constantly changing force people to adapt for survival, through endogenous. At the same time, the government is trying to help for the same goal, through a variety of urban development. Although it has the same goal, many found gaps, which, if not followed could increase the vulnerability of society and lead social dysfunction. According to of the phenomenon, this article is based on questionnaire surveys, observation, and previous studies in Semarang City. Quantitative data obtained from questionnaire surveys of 133 respondents of the household. The questionnaire distributed in 3 villages in Genuk sub-district, i.e. Terboyo Kulon, Terboyo Wetan, and Trimulyo. Industrialisation in the coastal area is main caused informal settlement hyper growth in the coastal area. For the present study sought to find out how the process of adaptation that naturally affects the vulnerability of communities using qualitative methods. The results showed the social, economic condition is strongly influenced adaptability of society.
Keywords: adaptive capacity, social vulnerability
1. Introduction
The rise of the resilient city idea is an attempt to answer the uncertainty of the city in the future [1, 2]. This debate is often associated with disaster issue [3, 4], climate change [5-7] and urban economic security [8, 9]. Seen from climate change and disasters perspective, the city is considered resilient if the urban system can absorb the pressure and continue to function normally. To understand the metaphor of resilient city, urban ecology, science is the closest discipline for the scope of city planning [10]. A city is an ecosystem where organisms (include man) living inside that influence each other [11]. The ecosystem itself consists of 'structure' and 'function'. The structure indicates the interaction system while the function indicates the role of each element in the system [10, 11]. Any change emerging from inside and outside the system will have an impact on the stability of the ecosystems [12, 13]. In the scope of
climate change and urban growth, vulnerability and risk assessment are useful to support the policy development that the city can adapt in facing climate change. Rosenzweig [6] argue that vulnerability and risk cities assessment for climate change are based on (1) climate hazards faced by the city, (2) vulnerabilities due to a city’s social, economic, or physical attributes, and (3) adaptive capacity aspects. There are many definitions of vulnerability; there are even more than ten definitions mostly debated in the world. Cutter [14] gathers the definition of vulnerability into 18 definitions according to the scientists’ proposed perspectives. The debate on vulnerability terminology began in the 1980s, where vulnerability research focused on three basic concepts: (1) related to the exposure (biophysical/technology), and (2) the consequences of the loss of social vulnerability) or (3) a combination of both. The vulnerability research falls at least under three alternative categories: (1) vulnerability to the risk of hazard exposure, (2) social vulnerability and (3) the vulnerability of the place/location. However, the vulnerability definition proposed by IPCC [15] is often used as a reference that defines vulnerability as the "the degree to which geophysical, biological and socioeconomic systems are susceptible to and unable to cope with the adverse impacts of climate change”. There are three components forming the vulnerability that is the level of sensitivity, the level of exposure, and adaptive capacity [16]. The level of sensitivity shows the internal state of the system that shows the degree of vulnerability to interference. Meanwhile, the adaptive capacity shows the ability of a system to adjust to environmental change or change in policy so that the potential negative impacts can be mitigated and positive impacts can be maximised or, in other words, it is the ability to cope with the consequences of climate change [16].
Furthermore, the vulnerability is a phenomenon that is influenced by the social construction of institutions and economic dynamics [17]. Social construction is a long-term social value of human interaction with the natural surroundings in the sphere of social-ecological systems which are mutually influential [18]. This social construction affects the adaptation ability as one of the aspects of social vulnerability research. Adaptability plays an important role in the vulnerability assessment of the location/ place. In this perspective, the vulnerability is formed from the risks biophysical and social responses [19]. In a general perspective, adaptability is very dependent on the economic ability, in fact, it is more influenced by the knowledge, experience, and community response to the weather [20]. Semarang towards the resilient city: a brief review?
One of the efforts to realise Semarang City to become resilient is through an ACCCRN program (Asian Cities Climate Change Resilience Network) which is funded by the Rockefeller Foundation and is managed by Mercy Corps Indonesia [21]. ACCCRN program aims to realise the resilient city against climate change through three outcomes: (1) capacity building, (2) network development for knowledge and learning, and (3) the expansion and scaling up [12]
One of the biggest concerns is that the largest contributors to GDP Semarang that are the industrial sector and trade as well as hotel and restaurant will be threatened since they would not be able to continue their business due to sea levels rising. In 2011, these two economic sectors which were mostly located on the coast were accounted for not less than 52.28% of the total GDP of Semarang. The industrial sector contributed for 27.36% increase compared to the GDP in 2010 which was 24.16% to a growth rate of 12.60%. Trade, hotels, and restaurants accounted for 28.01% of GDP, which increased to 12.03% from the previous year that reached 27.92% [22].
Despite the economic growth of the city, the increasing sea levels widen the tidal inundation area and soak the infrastructures, factory buildings, warehouses, and the residence. In 2012, the 20.76% of tidal inundation area was predicted to extend into 22.32% of the total area of Semarang in 2015 [23]. The extension of the inundated area is influenced by the increase in sea level of 5.43 cm/year due to global sea-level rise of 2.65 mm/year and a reduction in the land of 5.165 cm/year [24]. The direct result is the damaged infrastructures as well as the high cost of development and maintenance of city infrastructure.
These issues become the concern of Semarang City to realise a resilient city in response to the global climate change [25]. Semarang coastal area becomes the most affected area due to climate change which is characterised by the increase of tidal inundation area, soil degradation, and abrasion [26, 27]. The local communities are 'forced' to endure and accept the environmental condition which continues to deteriorate. With limited capabilities, they have to live 'in harmony' with the environment by elevating the building, the floor of the house, and closing the water channel during high tide [27, 28]. Therefore, this study tries to find out how the process of informal settlement hypergrowth influences on the social vulnerability of the community?.
2. Methodology
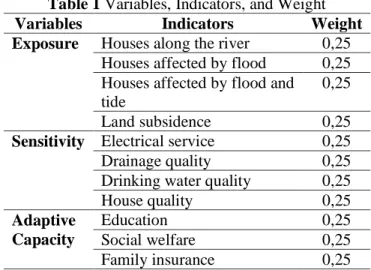
This article applies descriptive statistics and spatial analysis. Descriptive statistics are used to assess the vulnerability of Semarang coastal settlements while superimpose/overlay is used to determine the pattern of growth of the coastal settlements. The research variables refer to the statement mentioned by Adger [29], consisting of exposure, sensitivity, and adaptive capacity. Table 1 below shows the variables, indicators, and weight to assess the vulnerability.
Table 1 Variables, Indicators, and Weight
Variables Indicators Weight
Exposure Houses along the river 0,25
Houses affected by flood 0,25 Houses affected by flood and
tide
0,25 Land subsidence 0,25
Sensitivity Electrical service 0,25
Drainage quality 0,25 Drinking water quality 0,25 House quality 0,25 Adaptive Capacity Education 0,25 Social welfare 0,25 Family insurance 0,25
Vulnerability assessment is based on the formula presented by Turner and Kasperson [30]: 𝐕𝐮𝐥𝐧𝐞𝐫𝐚𝐛𝐢𝐥𝐢𝐭𝐲 = 𝐄𝐱𝐩𝐨𝐬𝐮𝐫𝐞 𝐱 𝐒𝐞𝐧𝐬𝐢𝐭𝐢𝐯𝐢𝐭𝐲
𝐀𝐝𝐚𝐩𝐭𝐢𝐯𝐞 𝐂𝐚𝐩𝐚𝐜𝐢𝐭𝐲
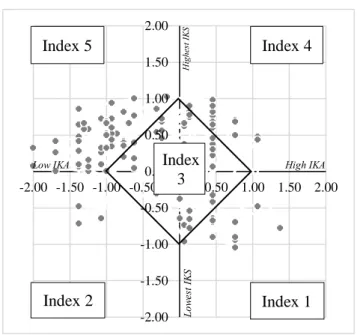
Based on the results of the vulnerability assessment, it is then grouped into five groups based on the index of adaptive capacity (IAC) and the index of exposure and sensitivity (IES). IAC represents the X axis while the Y axis is represented by the IES vulnerability matrix as shown in Figure 1.
Figure 1. The analytical procedure [31]
To obtain the relative position of the village towards the other village in tolerating a disaster (coping range) is by looking at the value of IES and IAC position in the quadrant system. If the value of the index of exposure and sensitivity (IES) and the index of adaptability (IAC) is in quadrant 5, the tolerance against catastrophic events is low (narrow coping range) or very vulnerable. The level and position of the vulnerability of each area (village) can be grouped according to the following chart:
Note:
Index 1: Very invulnerable Index 2: Invulnerable Index 3: Almost vulnerable Index 4: Vulnerable Index 5: Very vulnerable
Figure 2 Vulnerability classification according to coping capacity index [31]
The data is collected based on questionnaires distributed to 113 households with a level of accuracy of 90%. Table 2 presents a sample according to the village.
Level of Exposure & Level of sensitivity (IES) Exposure and sensitivity indicators Adaptive capacity indicators
Coping Range Index
Adaptive capacity (IAC) Index 3 Index 1 Index 5 Index 2 Highest IAC Lowest IAC H ig es t IE S L o w e st I E S Index 4
Table 2 Sample in each village Village Number of households Sample Trimulyo 1.018 33 Terboyo Wetan 1.106 37 Terboyo Kulon 1.549 43 Total 113
3. Data and Analysis
The terminology of vulnerability in this article refers to the notion proposed by Cutter [14] which focuses on the area vulnerability which is affected by vulnerabilities as a result of disaster risk and vulnerability due to social conditions response. The discussion in this article will be divided into four parts that are the explanation of the potential hazard of tidal inundation, the pattern of informal settlements growth, and the social vulnerability assessment and the description of the community adaptation.
3.1 Tidal Inundation
The entire study area is the area prone to tidal inundation. Semarang City Regional Regulation No. 7/2014 mentions about the drainage system master plan of Semarang 2011-2013, of which three villages in the research area that are Trimulyo, Terboyo Wetan, and Terboyo Kulon, are included in the drainage system of East Semarang that are the sub-drainage system of Tenggang river (Terboyo Kulon), Sringin River (Terboyo Wetan), and Babon river (Trimulyo). The main problem is the tidal flooding that occurs almost twice a week. The settlements located along the river are often flooded by tidal inundation for about 10-30 cm high. Tidal inundation is getting worse from year to year. Before the development of industrial zones in Terboyo Wetan and Trimulyo (in the 1980s), the tidal inundation could be accommodated by rice fields or ponds located on the waterfront. However, once they were converted into an industrial area, the tidal inundation extended to the settlements.
Tidal inundation also becomes an unfinished problem for the coastal community in Semarang [26, 27]. The community tries to resolve these ecological problems according to their economic ability by elevating the house floor, constructing dams/gutter in front of the house to retain the tide [32], or closing the drainage during tide [28]. The study of city resilience strategy undertaken by Tahta [33] shows the economic loss due to the damage of the coastal areas of Semarang which reached no less than Rp. 354.991.473.017,-. Compared to the local revenue, such losses spent half of Semarang total revenue which averagely was Rp780 billion each year [22]. This indicates that the achievement of the city's economy is incomparable with the losses due to the damage of the coastal environment [28].
3.2 Informal Settlement Growth
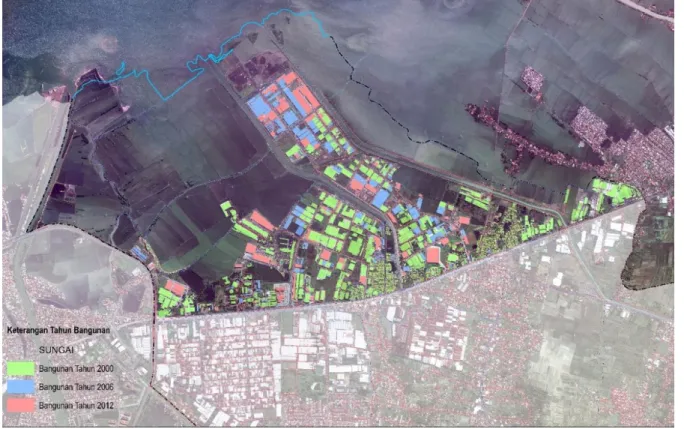
Industrialisation is a major cause of informal settlement growth in Genuk, Semarang. The Ministry of Public Work [34] showed that the increase of the building from 2000-2006-2012 based on satellite imagery and primary survey. The most rapid growth occurred in 2000-2006 which was marked by some new industries and warehouses. In 2000, space covering an area of 70.091 ha increased to be 24.112 Ha in 2006 and increased into 22.719 Ha in 2012. By the end of 2013, 116.922 Ha in Genuk sub-district was built.
Massive development in Genuk’s coastal areas extends and deepens the tidal inundation areas since the open space as a catchment area is decreased. There are 64% of neighbourhoods located on the river
banks and 72% of the houses that are inundated. The residents who work as industrial workers do not have sufficient capability to cope with the threat of the tidal inundation.
Houses in Genuk industrial zone are categorised as informal settlements. The residents build their houses without the intervention of private agent (developer) or the city government. The house construction by the community was started along with the development of industrial zones in Small Industrial Environment) and Terboyo Megah Industrial Area. The growing number of the houses over the years has increased along with the growth of the population. The Industrial Zone of Genuk was previously paddy fields, ponds, garden/fields, and only a small area that was built houses.
The increasing number of the houses is the implications of high population growth both natural growth and migration. Urbanisation contributes the most impact compared to natural population growth which increases twice higher than the natural growth. Based on the statistical data, Genuk District population growth in 2014 was 2.79%. Almost every year the rate of migration tends to increase. The impact is the increased need for houses for the new residents. Within the past 20 years, the population is centralised in Terboyo Wetan and Trimulyo Village with Ngilir River as the centre of growth. It results in high density and crowds in which one house is occupied by more than two families, especially in the urban village. Moreover, the distance between houses is no more than one meter. Similar problems also occur in the other four villages (Terboyo Kulon, Genuksari, Gebangsari, Banjardowo and Muktiharjo Lor). The total area of the five villages is still sufficient to accommodate the newcomers. Uncontrolled housing density widely impacts the physical and socio-economic conditions of the population.
Many houses are built along the river bank even on the river. The houses of the immigrants who work in the informal sector such as pedicab drivers, street vendors, market porters or construction workers are built on the river bank. The river bank is located in the north of Terboyo Megah Industrial Zone in Terboyo Wetan Village.
Obviously, these houses are built on illegal land. The houses in Terboyo Kulon are also built on the land and river by attaching pillars to the houses. The existence of these houses poses a major problem to the conditions of settlement environment. The pillars hamper the water flow and the garbage which results in the rainwater overflow and inundates the roads and houses.
3.3 Social vulnerability assessment
Environmental problems are worsened and become a social problem. The community assumes that the current environmental management is a useless effort because the environment that has been maintained and repaired can certainly be damaged again. Principally, therefore, the environmental problems are caused by the behaviour that is the public ignorance in managing the housing environment, the inability to manage and to restore the environmental conditions to be better, and the community unwillingness because environmental management is a useless act. The overlapping forms of adaptation designed by the government and public institutions indicate the institutional influences on social vulnerability. The absence of integrated planning between the real conditions in the field carried out by the government would be a separate issue that impact on the vulnerability of coastal communities. The vulnerability that occurs in the community is more influenced by the economic dynamics than institutions. The absence of collective adaptability in force in the group of citizens has also become a new problem to the degree of vulnerability of the community.
From the assessment of the level of vulnerability, there are five categories: index 1, index 3, and index 4 out of 5 vulnerability indexes. Index 1 indicates the lowest level of vulnerability (only two respondents out of 113 respondents). The low vulnerability level is caused by the ability to adapt (adaptive capacity) especially the level of income and education level of the community. Index 3 is a vulnerability in quadrant five which is right in the middle of the Cartesian quadrant. This level shows that the vulnerability level of the community is on the threshold (coping range), and if it does not receive any intervention on its adaptive capacity, it will move to vulnerable quadrant. In the last level, that is the index 4 or vulnerable; there are 67 respondents out of 113 respondents. Most people whose livelihood is industrial workers fall into this category.
Table 3 Level of Vulnerability No Vulnerability
Index Number Percentage
1 Index 1 8 7.08%
2 Index 2 3 2.65%
3 Index 3 52 46.02% 4 Index 4 14 12.39% 5 Index 5 36 31.86%
Figure 4 Vulnerability Matrix
Community ignorance regarding the management and improvement of the environment has caused the lack of ethics and wisdom to the environment. This worsens the settlement environment since it has been practised for years by many people. Due to this ignorance, the community also utilises the river as waste canal and toilet. Public awareness of waste management is also low. There are a lot of people who throw their garbage in the river or another vacant area. Also, the community does not separate the drainage with household waste. Besides, public participation in the environmental management is also low. The community frequently participates in cooperation (gotong-royong) whenever there are damaged infrastructures such as damaged road or bridge. The participation in managing environmental hygiene, river cleanliness, drainage, and others is still low.
Semarang coastal areas become vulnerable because the mitigation and adaptation capability is 'burdened' to the ability of the people who live in self-made settlements. There is no procedure and clear standard to overcome the ecological problem. This vulnerability is predicted to grow higher due to the urbanisation drive of Kedungsepur area which is 1.36% per annum [34]. Rapid urbanisation has led to environmental degradation, congestion, unemployment, crime, and socio-political conflict [35] which increases the informal sector amounted to 1.47% per annum [22]. Satterthwaite [36] suggests that the greatest vulnerability of the city comes derive from the informal settlement which has now reached 49.86% [22] in Semarang City.
As previously discussed, the collaborative adaptation is not carried out by the government, and at the same time, the community forms new problems. Socio-ecological systems that run circularly in the study area is a short walk, which starts from the 1980s characterised by urbanisation as a result of mega industrial projects [28]. The ability of people to adapt is highly affected by the economic capacity and does not explain the existence of local knowledge and local technologies that affect their adaptation efforts. It became one picture that opinions Adger and Vincent [20] who said that adaptability is influenced by experience and knowledge of citizens does not apply for two reasons: (1) people who stay are migrant communities, (2) The range of experience of social ecology is relatively short and does not run for generations.
3.4 Community Adaptation Form
The adaptation process becomes highly dependent on the ability of the community which has no standards. The economic ability of the coastal communities defines their adaptation strategy and
-2.00 -1.50 -1.00 -0.50 0.00 0.50 1.00 1.50 2.00 -2.00 -1.50 -1.00 -0.50 0.00 0.50 1.00 1.50 2.00 Index 4 Index 5 Index 1 Index 2 Index 3 High IKA Low IKA H ighe st IK S Lo w es t I K S
capability. High-income community is capable of elevating their homes but the low-income community is only able to elevate the floor of the house. Therefore, it is not difficult to find houses which are no less than3 meters high. Adger and Vincent [20] mention that vulnerability is a socially constructed phenomenon influenced by institutional and economic dynamics. In the study area, both components influencing this vulnerability to go hand in hand. It is even prone to minor ‘conflict’ as perceived by the public. The forms of adaptation are likely more physical that is by elevating the physical buildings such as roads, bridges, river embankments, floors, and community houses [28, 32]. The adaptation made by the local community is a survival process and is based on their ability (self-help) or from government aids. The informal process done by the community is to reduce the impacts of the flood (both tidal inundation and flood) and to meet their basic needs. This adaptation is done by elevating the building, constructing a dam in front of the house, and closing the drainage during the tide [26, 27]. Meanwhile, the adaptation strategy by the community to meet the basic needs is by building artesian wells. The absence of the tap water service in Terboyo Kulon, Terboyo Wetan and Trimulyo Village has forced the people to build a well which is then distributed among the community informally. In fact, the PDAM pipes for the port are installed in the three villages.
Residents who live in Genuk coastal areas are mostly not natives of Semarang City. The native referred in this article are citizens who were born and grew up in the same place. This becomes important as the methods (social learning process) for the community in facing their environment within the scope of the social-ecological system [18]. They come for working in the industrial sector, but due to the limited education and skills, the factories cannot accept them. The houses which are built do not meet the health requirements. There are many houses which are only 21 m2 high and are not equipped with a window, built with the incomplete wall, and have a unpaved floor which is inundated during the flood. This condition occurs in a neighbourhood located in industrial areas and riverbanks. The slum houses have long emerged that was started to spread in 1997 [37].
The community ability to adapt is associated with class society. There are three classes of people in the Genuk coastal area which affect the adaptation ability. The first class is informal workers and communities living in illegal areas or marginal land. Most people work as porters and parking attendants with low or even no education background. They consider that a poor environment is a logical consequence of coastal settlements. Also, a community in this group does not have a significant contribution in environmental management. Second is the industrial worker community. They have middle to the high educational background and give a high contribution to environmental management. Many community forums are led by this group. The third is a wealthy community which has a major asset in their environment. Their concern for the environment is quite low, and they consider the environmental degradation is caused by the lower-class community who is not aware of the environment [38].
This adaptation is not only conducted by the community but also by the government through the elevation of the main road (Kaligawe Street). The road is routinely elevated to avoid flooding. However, in reality, this form of adaptation creates new problems faced by the community. Being elevated, the road also serves as an ‘embankment’ retaining the water. As a result, the inundation in Terboyo Kulon, Terboyo Wetan, and Trimulyo can not flow as the road obstructs it. What becomes a new phenomenon now is the adaptation efforts designed by the government and carried out by the community which turns to be ecological and social conflicts. The government implements integrated and formal development planning within the scope of community’s informal development planning (bottom up). This indicates that the implemented environmental planning is unable to design a better environment for the community.
4. Conclusion
Social vulnerability is influenced by the ability of adaptation. The adaptation strategy which is not collaborative between the government and the community will create a new problem. The community’s capability to adapt highly depends on their welfare which in fact is not wealthy enough. There are still basic needs (water) that have not been fulfilled, and the community has to fulfil it by building artesian wells. The experience and local knowledge have not yet fully supported community adaptability. This is caused by the local communities who are not native residents. They are newcomers who work as labours in the factory industry. Local knowledge is not constructed because there is no ecological experience that the community forms from their birth until the present days. This condition is contradictory to the opinion mentioned by Adger and Vincent [20] that the ability of social adaptation is more influenced by their life experiences and knowledge in residence. Traditional knowledge that is running in the community grows and develops through generations and forms the adaptive values which are used. The principle of circular relationship [39] and social-ecological system [18] have to be explained clearly. However, the condition of 'hereditary' occurred in Semarang is not the same with the hereditary condition in rural areas in which village communities are composed of unchanged various generations. In contrast to the Genuk coastal communities, most migrant communities are not from Semarang but from around Semarang [28]. The reason is what makes the difference in the findings of the study with a good understanding of the literature presented by Adger and Vincent [20], Soemarwoto [39], Cutter, Barnes [40] and Folke [18]. Collaborative planning that combines form with the adaptation of government agencies that have been made by the public within the scope of the new research that should be studied more in depth in the future.
5. Acknowledgment
The author would like to thank the University of Diponegoro which has funded the research in the development of the scheme Penerimaan Negara Bukan Pajak (PNBP) Fiscal year 2015 through the Budget Implementation List (DIPA) Universitas Diponegoro No. DIPA– 313-17UN7.5.1/PG//2015, 22 Avril 2015.
References
[1] Leinchenko R 2011 Climate change and urban resilience (Current Opinion in Environmental Sustainability vol 3) p 164-168.
[2] Jordan Y C G, Abduwasit, Hartling Sean 2014 Traits of surface water pollution under climate and land use changes: A remote sensing and hydrological modelling approach (Earth-Science Reviews vol 128) p 181-195.
[3] Pelling M 2003 The Vulnerability of Cities: Natural Disasters and Social Resilience (London: EARTHSCAN Publications Ltd)
[4] Shaw R, H Srinivas and A Sharma 2009 Urban risk reduction: a perspective (United Kingdom: Emerald) [5] Yuen B and A Kumssa 2011 Climate Change and Sustainable Urban Development in Africa and Asia
(New York: Springer)
[6] Rosenzweig C et al. 2011 Urban Climate Change in Context, in Climate Change and Cities: First Assessment Report of the Urban Climate Change Research Network ed C. Rosenzweig et al. (Cambridge: Cambridge University Press)
[7] Calthorpe P 2011 Urbanism in the age of climate change (Washington: ISLAND PRESS)
[8] Capello R and P Nijkamp 2004 Urban dynamics and growth, in Advances in Urban Economics, ed B Baltagi, E Sadka and D Wildasin (Amsterdam: Elsevier)
[9] Simmie J and R Martin 2010 The economic resilience of regions: towards an evolutionary approach (Cambridge Journal of Regions, Economy and Society Vol 3 no 1) p. 27-43.
[10] Pickett S T A C, 2002 The Ecosystem as a Multidimensional Concept: Meaning, Model, and Metaphor. (Ecosystems vol 5) p. 1 - 10.
[11] Tansley A G 1935 The use and abuse of vegetational concepts and terms (Ecology vol 16) p. 284-307. [12] Brown A, A Dayal and C R D Rie 2012 From practice to theory: emerging lessons from Asia for building
[13] Benjaminsen TA et al. 2012 Does climate change drive land-use conflicts in the Sahel? (Journal of Peace Research Vol 49 No 1) p. 97-111.
[14] Cutter S L 1996 Vulnerability to environmental hazards (Progress in Human Geography Vol 20 No 4) p. 529-539.
[15] IPCC 2012 Summary for Policymakers. In: Managing the Risks of Extreme Events and Disasters to Advance Climate Change Adaptation, in A Special Report of Working Groups I and II of the Intergovernmental Panel on Climate Change ed C B Field, V Barros, T F Stocker, D Qin, D J Dokken, K L Ebi, M D Mastrandrea, K J Mach, G-K Plattner, S K Allen, M Tignor and P M Midgley (Cambridge: Cambridge University Press)
[16] Gallopín G C 2006 Linkages between vulnerability, resilience, and adaptive capacity (Global Environmental Change Vol 16 No 3) p. 293-303.
[17] Adger W N et al 2003 Adaptation to climate change in the developing world (Progress in Development Studies Vol 3 No 3) p. 179-195.
[18] Folke C 2006 Resilience: The emergence of a perspective for social–ecological systems analyses (Global Environmental Change Vol 16 No 3) p. 253-267.
[19] Cutter S L, B J Boruff and W L Shirley 2003 Social Vulnerability to Environmental Hazards (Social Science Quarterly Vol 84 No 2) p. 242-261.
[20] Adger, W.N. and K. Vincent 2005 Uncertainty in adaptive capacity (Comptes Rendus Geoscience Vol 337 No 4) p. 399-410.
[21] Mulyana W et al 2013 Urbanisation, Demographics and Adaptation to Climate Change in Semarang, Indonesia, in Technical Briefing (Jakarta: UNFPA)
[22] Indonesia Statistic 2012 Kota Semarang dalam angka 2012 (Semarang: Indonesia Statistic and Planning and Development Board of Semarang)
[23] Nugraha A L, Purnama B S and T Adity 2012 Pemetaan risiko bencana banjir rob Kota Semarang, in The 1st Conference on Geospatial Information Science and Engineering (Yogyakarta: Jurusan Teknik Geodesi UGM)
[24] Wirasatriya A 2005 Kajian kenaikan muka laut sebagai landasan penanggulangan rob di pesisir Kota Samarang (Semarang: Diponegoro University)
[25] Azis A et al 2010 City resilience strategy: Semarang's adaptation plan in responding to climate change (Semarang TAHTA Undip: Semarang)
[26] Dewi A 2007 Community-based analysis of coping with urban flooding: a case study in Semarang, Indonesia, in International institute for geo-information science and earth observation enschede (Netherlands: ITC)
[27] Marfai M A K et al 2008 The impact of tidal flooding on a coastal community in Semarang, (Indonesia. Environmentalist vol 28) p. 237-248.
[28] Sariffuddin, S and R. Susanti 2011 Penilaian kesejahteraan masyarakat untuk mendukung permukiman berkelanjutan di Kelurahan Terboyo Wetan, Semarang (Makara seri sosial humaniora vol 15 No 1) p. 29 - 42.
[29] Adger WN 2006 Vulnerability (Global Environmental Change Vol 16 No 3) p. 268-281.
[30] Turner B L et al 2003 A framework for vulnerability analysis in sustainability science (Proceedings of the National Academy of Sciences Vol 100 No 14) p. 8074-8079.
[31] Boer R 2002 Analisis penilaian tingkat kerentanan, M.P.K.K. (VA), (Bogor: Center for Climate Risk and Opportunity Management-Bogor Agriculture University).
[32] Marfai M A and D R Hizbaron 2011 Community's adaptive capacity due to coastal flooding in Semarang coastal city, Indonesia (Analele UniversităŃii din Oradea – Seria Geografie Vol 2) p. 209 - 221.
[33] Tahta 2010 Strategi ketahanan kota rencana adaptasi Kota Semarang hadapi perubahan iklim (Semarang: Asian Cities Climate Change Resilience Network)
[34] Kementerian Pekerjaan Umum 2012 Draft Technical Report on Semarang Metropolitan Area (Kedungsepur) (Jakarta: Ministry of Public Work)
[35] Wilonoyudho S 2011 Overurbanization in Semarang City (Jurnal Teknik Sipil dan Perencanaan Vol 13 No 2) p. 191-200.
[36] Satterthwaite D 2011Editorial: Why is urban health so poor even in many successful cities? (Environment & Urbanization Vol 23 No 1)
[37] Sariffuddin S, Pradoto Wisnu, Damayanti Maya 2006 Quality of Life and The Perception of Community in Semarang (Case Study: Settlement Area in Genuk, Semarang). in 2nd International Conference on Environment and Urban Management (Science, Nature and Justice) (Semarang: Soegijapranata Catholic University)
[38] Sariffuddin S 2010 Pengaruh kesejahteraan masyarakat terhadap kondisi lingkungan permukiman di sepanjang Sungai Ngilir, Semarang. in Perubahan Iklim di Indonesia Mitigasi dan Strategi Adaptasi dari Tinjauan Multidisiplin (Yogyakarta: Sekolah Pascasarjana UGM)
[39] Soemarwoto O 1983 Ekologi, Lingkungan Hidup dan Pembangunan (Jakarta: Djambatan)
[40] Cutter S L et al 2008 A place-based model for understanding community resilience to natural disasters (Global Environmental Change Vol 18 No 4) p. 598-606.
![Figure 2 Vulnerability classification according to coping capacity index [31]](https://thumb-us.123doks.com/thumbv2/123dok_us/867495.2610824/5.893.268.617.163.430/figure-vulnerability-classification-according-coping-capacity-index.webp)