Evidence-Based Decision Making
in Lean Software Project Management
Brian Fitzgerald
Lero, the Irish Software Engineering Research Centre
University of Limerick, Ireland
Mariusz Musia
ł
Ericpol Bobrzynskiego 12 Cracow, PolandKlaas-Jan Stol
Lero, the Irish Software Engineering Research Centre
University of Limerick, Ireland
[email protected]
ABSTRACT
Many professions evolve from their origins as a creative craft process to a more product-centered industrial process. Software development is on such an evolutionary trajectory. A major step in this evolution is the progression from ad hoc to more rigorous evidence-based decision-making in software development project management. This paper extends theory and practice in relation to lean software development using such an evidence-based approach. Based on a comprehensive dataset of software development metrics, gathered in a longitudinal case study over a 22-month period, the Erlang-C model is used to analyze different software development parameters and to guide management decision-making in relation to development resources. The analysis reveals how ‘gut-feel’ and intuition can be replaced by evidence-based decision-making, and reveals how incorrect assumptions can underpin decisions which as a consequence do not achieve the desired outcome.
Categories and Subject Descriptors
D.2.8 [Software Engineering]: Metrics – process metrics. K.6.3 [Management of Computing and Information Systems]: Software Management – software process.
General Terms
Management, Measurement, Performance, Theory
Keywords
Agile, Lean, Kanban, empirical study, case study, Erlang-C model, evidence-based decision making
1.
INTRODUCTION
“Whenever you can, count!” Sir Francis Galton
The industrial revolution heralded the general move from cottage industry, craft-based production to industrial-scale product-cen-tred processes which transformed most domains at the time. Cox [9] described this general transformation and argued that because of its relatively recent origins, the software domain has not yet
made such a transformation. Agile software development methods have emerged as a practice-led approach that has now become the predominant mode of development in organizations, with esti-mates that more than 84 percent of organizations are following an agile approach [43]. While agile methods have promoted a greater emphasis on business value, these methods are very developer-centric, and software development remains something of a “black art” which continues to be quite opaque to management in terms of effort estimation, duration and cost [22]. Thus, solid quantita-tive evidence which could underpin management decisions in relation to software development is still absent [10, 42, 48]. Pfeffer and Sutton pointed out that “the best evidence is to be found at home—in the company’s own data and experience rather than in the broader-based research of scholars” [32].
More recently, a focus on lean software development has emerged [11, 44]. While agile and lean are often viewed as interchangeable or synonyms (evidenced by the common term “agile/lean”), they can be differentiated on a number of dimensions [8, 30]. By and large, lean approaches are more concerned with quantitative measurement and evidence-based decision-making [24]. Thus, lean software development may be more suited to addressing the absence of solid evidence for software project management that has been called for in many quarters [10, 12, 36].
However, some have argued that certain lean principles such as “flow” and queuing theory “just don’t fit into software develop-ment,” citing challenges such as the intangible nature of software, developers as knowledge workers, and the difficulty of defining ‘flow’ in software development [11]. Such claims are not grounded in solid empirical evidence, and there is therefore a pressing need to better understand how lean concepts, such as Kanban can help software project managers to improve key goals such as development productivity, quality, service time, and cus-tomer satisfaction.
In this paper we present an in-depth case study of a lean software development process that was tailored based on the precise measurement of a number of important parameters over an extended period (22 months). The analysis was based on the Erlang-C model which has been used successfully to allocate and manage resources in telecommunication and call-center contexts, but its use in the context of managing software development projects resources is novel. The use of the Erlang-C model allowed for an evidence base to support management decision-making in relation to software development project resource allocation and timing. It also illustrated how some typical management actions in response to development problems can be misguided, as they are often based on gut-feel or intuition [32]. The paper is laid out as follows. In Section 2, we briefly discuss some background on lean thinking, and lean software
Permission to make digital or hard copies of all or part of this work for personal or classroom use is granted without fee provided that copies are not made or distributed for profit or commercial advantage and that copies bear this notice and the full citation on the first page. To copy otherwise, or republish, to post on servers or to redistribute to lists, requires prior specific permission and/or a fee.
ICSE’14, May 31–June 7, 2014, Hyderabad, India. Copyright 2014 ACM 978-1-4503-2768-8/14/05... $15.00.
development (LSD), specifically. Given the emphasis on data-driven decisions as a fundamental value in LSD, we draw on the Erlang-C model which underpinned the case study, as it was used to reason about management decisions in relation to software development resources. Section 3 presents the case study research method adopted for the study, and provides details on Ericpol, the case company. Section 4 presents the results of our analysis of the lean software development approach at Ericpol, with a particular emphasis on the use of quantitative measures to drive software project management decisions. Section 5 concludes the paper with the presentation of the implications for software development.
2.
BACKGROUND AND RELATED WORK
2.1
Lean and Kanban
Lean concepts, originating in the Toyota Production System (TPS) [27], have long been applied in manufacturing and are widely accepted as leading to superior performance and helping companies achieve competitive advantage [47]. A software development approach that epitomizes lean thinking, and which is becoming increasingly popular, is Kanban [2, 11, 15, 18, 41]. Kanban was first formulated by Taiichi Ohno who developed the TPS, inspired by the way American supermarkets operated in the 1950s [27, p.26]: customers acquired goods in the quantities they needed, after which the “upstream” (or “preceding”) process produced what was taken (i.e., restocking). The signal passed from a “downstream” (or “succeeding”) process to an “upstream” process is the kanban, which means signboard or tag [27]. Since the customer starts this process by making a request, this cascading system of signals going upstream causes what is known as a “pull” system, as opposed to a “push” system where products are built without explicit customer request. Once finished with a task, a downstream process (e.g., integration) “pulls” a new work item from an upstream process (e.g., development). The various processes are represented on the Kanban board as states, and “work-in-progress” (WIP) products move from one state to the next. In the TPS, each part had to be accompanied by a kanban, which effectively was an order sheet, and by limiting the number of kanban tickets in the production system, the number of WIP products were also limited. Reducing WIP level helps to reduce cycle-time, which in turn helps to improve the “flow” of a process [39, p.145]. This is also desirable in software development, so that development teams can continue to work on a steady stream of projects.
The Kanban method typically uses a card wall – the Kanban board – as a visual control system similar to those used in agile methods such as Scrum. This form of visualization helps in identifying bottlenecks as soon as they appear, and which must be addressed by the development team before starting on a subsequent task (since no kanban tickets will be available). In lean terminology, visualization of the process is better known as “value stream mapping,” which identifies all the “value-adding” and “waiting” stages of a process [46]. Since the Kanban board helps in identifying the work that needs to be done, it is effectively a coordination mechanism in that it tells developers what to do. Kanban and Scrum are similar in some respects but differ in others. For instance, both limit the WIP, but whereas Kanban limits the WIP per state, Scrum limits the WIP per sprint [18]. On the other hand, both are based on an empirical logic rather than a defined logic, employing inspect-and-adapt cycles [18, 45]. Based on this feedback loop, project managers can change the parameters of the development process, such as the WIP limit, the number of people per team and the number of teams, etc.
Most of the studies of lean software development comprise qualitative descriptions or anecdotal reports [5, 6, 28, 34, 37], with very few presenting any quantitative analysis (e.g., [31, 42]). A recent mapping study found that 76% of lean software development studies were non-empirical [29].
One important consideration when adopting lean principles in software development is to decide which set of principles to adopt. Common popular phrases such as “customer value” and “reduce waste” are central in lean manufacturing and product development, but in order to benefit from these principles, they must be operationalized as concrete practices.
In the context of software development, different authors have written books on the topic [2, 18]. Poppendieck and Poppendieck defined a set of 7 principles that link strongly to agile practices [35]. One key agile practice is that of frequent releases, which is a direct implementation of the lean principle of reduced batch size, resulting in fast feedback [38]. While agile practices support the lean philosophy well, the evidence-based decision-making that is emphasized by lean experts is often absent [39]. There is no agreement on a common set of principles that apply well to software development—different studies use different principles to study lean software development, even when done by the same author [23, 24, 25].
Kanban is perhaps the best-documented approach to “lean soft-ware development” [3, 16, 42] – while Kanban is not as prescrip-tive as, for instance, Scrum, it does present a ‘framework’ for organizations to adopt lean software development. One of the key properties of Kanban is to “Use Models to Recognize Improve-ment Opportunities” [2]. In other words, to tailor and configure this framework with appropriate parameters so that it fits well within the environment in which an organization is operating. Studies on how to perform an evidence-based dimensioning of a software function are still lacking, to the best of our knowledge.
2.2
The Erlang-C Model
Lean thinking encourages the use of evidence to guide decision-making and to continuously improve the process. In the case of lean software development, rigorous evidence based-decision making is also advocated [10, 20, 26]. In certain domains, such as telecommunications or call centers, a family of techniques known as Erlang models has been applied to improve decision-making (e.g. [13, 19]). Erlang models (not to be confused with the Erlang programming language) are based on a Poisson distribution, a probability distribution which can be used to estimate the rate of occurrence of events [21]. The Erlang model applies the Poisson distribution to design and manage resource allocation. There are two particular forms – Erlang-B which is a queue-less model, and Erlang-C which allows for an input queue. The latter is more suited to software development in that there is an input queue corresponding to the backlog of items on the Kanban board. Re-quests for development (i.e. new backlog items) enter the queue if the WIP limit is reached, indicating that development teams are completely occupied. An organization’s Service Level indicates the probability that a new request can be served (i.e., taken into execution) within the Target Answering time (TA), e.g., a service level of 80% means there is a 20% probability that a new request will wait longer than TA before it is started.
The Erlang-C model has certain assumptions, which must be fulfilled in order for the model to be applicable. These are listed in Figure 1. The fulfilment of these assumptions in the software development context at the case company, Ericpol, is discussed in Section 4.
1. Events enter the queue randomly (Poisson distribution of arrivals).
2. Service time distribution is exponential. 3. Negligible level of abandonments.
4. Events are served in the order of their arrival (FIFO principle).
5. Events are directed to the first-available agent (team). 6. Queue sizes are unlimited.
7. Event volumes do not vary dramatically.
Figure 1. Assumptions of the Erlang-C model.
3.
RESEARCH METHOD
3.1
Research Objective
The objective of this study was to analyze software development performance and provide a solid and rigorous base for management decision-making in relation to the size of the development function needed to satisfy software development project requests given the volume and complexity of the this project work. Typically, organizations have a number of metrics that they would like to achieve in relation to performance targets, such as responsiveness, average service time, and quality. These targets must also be met as cost-effectively as possible. However, these goals are generally accomplished through intuition and ‘gut-feel’ rather than through a more evidence-based scientific approach [7]. The obvious uncertainty in the process is well conveyed through the choice of the name, Planning Poker, as an estimation technique which is widely used in agile methods such as Scrum and Extreme Programming, which inherently recognizes that resource estimation in a software development context exhibits a wide range in suggested answers, and that an additional process is required to achieve some consensus. Therefore the goal of this research was to optimally dimension the software development function on the basis of a scientific model supported by appropriate evidence. The research adopted a longitudinal case study approach to address this research objective [40].
3.2
Background of the Case Company
Ericpol is an engineering company that has been operating on the international ICT market since 1991. The company provides out-sourcing and consulting services as well as dedicated solutions in the telecommunications, healthcare, finance and banking domains. Ericpol consists of three offices in Poland and three production centers in Ukraine, Belarus and Sweden, employing over 1,700 people.
In 2007, Ericpol began implementing an agile software develop-ment approach, firstly experidevelop-menting with Scrum for the devel-opment of new products or product features. The characteristics of some development projects (e.g. moderate to high complexity, variability in requirements, fairly long expected lead times) al-lowed Ericpol to benefit from the iterative, short feedback cycle characteristics of Scrum. However, a very common category of development projects at Ericpol was one where the inflow of pro-jects was random and not controlled by the software development function, where fast response time and short service time were crucial, work effort was relatively small, and technical complexity was usually moderate. For these projects, the most important characteristic was to sustain a steady flow of throughput. For these kinds of projects, the Kanban approach was better suited, due to its primary focus on flow, low method overhead, support for high visibility of the whole process, and limitation of multitasking (WIP limit).
The initial Kanban implementation was done with a group of about 10 developers. The nature of development consisted of projects where developers received the design documents and were then responsible for coding and testing the software products. Integration of the resulting code was initially the responsibility of a separate engineering group. The project coordinator assigned developers to different development teams, but developers were then free to self-select and ‘pull’ work from the backlog of tasks available for development (pending). The project coordinator was responsible for execution of the projects and committing to customers on delivery dates etc.
This approach worked quite well for the initial size of the development group and the volume of work. Over time, however, the inflow of projects grew, as did customer expectation for quicker response time. The development group also increased, reaching around 40 developers, with peaks up to 70 developers, distributed across multiple international sites. As a result, the weaknesses of the initial software development configuration became apparent.
To address these problems, Ericpol chose to implement organization-level Kanban, supplemented by the creation of stable, cross-functional teams. Organization-level Kanban means that there is one common Kanban board and one common backlog for the whole organization (for all teams) – an item on the board represents a project. Decomposing a project into tasks is done by the teams and not shown on the board. This implementation of Kanban was done in July 2011. Five teams of eight engineers each were created. Those teams were responsible as a whole for project execution, and they also assumed responsibility for the design phase (formerly provided to them as an input). The Kanban board quickly showed that the number of projects in the backlog waiting selection by the developers was quite high, as was the number of completed projects awaiting integration by the other group. As a result, the scope of activities for the development group was expanded to include integration of the code for deployment in addition to the initial design task. While this improved the service time, principally by reducing the number of projects awaiting integration, the backlog of projects awaiting execution continued to increase. In parallel the WIP limit was increased to five, on the basis that the previous WIP limit of three occasionally resulted in some developers having no tasks to execute due to task interdependencies.
It became evident that this was an appropriate context for application of the Erlang-C model: there was effectively a random inflow of project requests; these were entering a “servicing” (i.e., development) system consisting of a finite number of developers, operating under the expectation of short cycle-times fulfilled within certain limits (service levels). The application of Erlang-C is discussed in Section 4.
3.3
Data Collection and Analysis Methods
As stated in Section 3.1, a key goal for Ericpol was to optimally dimension the software development function within the organization. To that end, management needed to gain better insight into the development capacity required for the given inflow of new projects. The organization identified a number of questions that were relevant to management. Given the level of incoming project development work that needed to be completed:
• What is the relationship between developer availability and developer occupancy (i.e., what level of developer utilization occurs) and what is the effect on the service level?
• What is the effect of a change in project inflow on developer
occupancy and service level?
• What is the effect of the organization’s size (number of
development teams) on the queue length?
Data were collected on 467 development projects over a 22-month period between January 2011 and October 2012 at the case company, Ericpol. Data for the following metrics were collected:
• Allocated project number • Date of project arrival • Project development start date • Expected finish date of project
• Actual finish date of project
• Estimated development effort for project
• Actual development effort for project
This information was stored in a database and allowed us to calculate the development duration (service time) of each project, and also the project waiting time in the queue before development started. The Erlang-C calculations were performed using a specialized tool-set.1
A Kanban Board tool was developed internally to record all metrics listed above, and to display the project status. This was divided into three main states:
1. Awaiting 2. Ongoing
2.1. Design ongoing 2.2. Integration waiting 2.3. Integration ongoing 2.4. Final review waiting 2.5. Final review ongoing 2.6. Delivery preparation waiting 2.7. Delivery preparation ongoing 3. Done
4.
ANALYSIS AND RESULTS
The analysis in this section is based on data gathered between January 2011 and October 2012. In this period (662 days in total), there were 467 project arrivals, out of which 435 were started in that period and 421 finished. The average project inflow – or arrival rate (λ) – for the whole period is:
𝜆=467
662=0.71
𝑃𝑟𝑜𝑗𝑒𝑐𝑡𝑠 𝑑𝑎𝑦
The average project outflow – or departure rate (ρ) - for the whole period is:
𝜌=421 662=0.64
𝑃𝑟𝑜𝑗𝑒𝑐𝑡𝑠 𝑑𝑎𝑦
The comparison of those two values immediately indicates a problematic issue – the organization was overloaded (or understaffed) for its performance parameters. Thus, the decision was taken to manage the system based on the application of the Erlang-C model. As already mentioned, Erlang-C requires that a number of assumptions be fulfilled (see Figure 1 above), and these are considered next.
4.1
Assumptions of Erlang-C Model
The first assumption of the Erlang-C model requires that events enter the queue in a random fashion. At Ericpol, the software development project teams have no influence on the project
1 Available at: http://www.mitan.co.uk/mainerlg_spsh.htm
arrival. The arrivals are triggered by customers placing project development requests independently and randomly, from the point of view of the development teams.
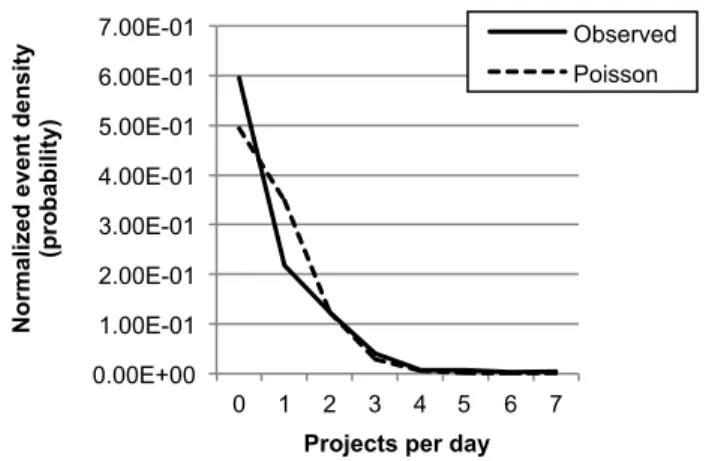
Modeling the distribution of project arrivals at Ericpol facilitates a comparison with the Poisson distribution. In order to do this, we define an event A(n) as the arrival of n projects a day. Then we count the frequency of every event A(n) and normalize it to A 𝑛 by dividing A(n) by the number of days in the analysed period (i.e. by 662). Then we contrast the observed arrival distribution with the theoretical Poisson distribution using the observed arrival rate (λ). This is shown in Figure 2.
Figure 2. Observed arrival versus theoretical arrival rate. The second assumption of the Erlang-C model is an exponential distribution of the service time. The observed distribution of project duration (β) is compared against the theoretical distribution in Figure 3 below (note the x-axis has been truncated to show just the most significant portion).
Figure 3. Observed v. theoretical distribution of service time. The third assumption of Erlang-C is that of a negligible level of abandonments. Out of 467 project arrivals in the analyzed period, only 11 were cancelled, and of the 11, only 3 were cancelled before starting execution, which is effectively a negligible level of abandonments (approximately 0.5 percent).
The fourth assumption is that of the First-In, First-Out principle: projects are worked on in order of their arrival. The fulfillment of this assumption depends on practical factors, such as the
0.00E+00 1.00E-01 2.00E-01 3.00E-01 4.00E-01 5.00E-01 6.00E-01 7.00E-01 0 1 2 3 4 5 6 7 N o rm al ize d e ve n t d en si ty (p ro b ab ili ty )
Projects per day
Observed Poisson 0 0.02 0.04 0.06 0.08 0.1 0.12 0.14 1 9 17 25 33 41 49 57 65 73 81 89 97 105 113 121 129 137 145 R el ati ve fr eq u en cy ST [days]
Normalized ST distribution. Mean = 44.6 days
ST Observed ST Exp
expectation of delivery date by the customer as well as business factors which may cause reprioritization of projects. This can lead to violation of the FIFO principle. However, such reprioritization affected a relatively small percentage of projects. Thus, we presume the practical fulfillment of this assumption also.
The fifth assumption of the Erlang-C model is that projects are directed to the first available agent or team. In the kanban model as implemented at Ericpol, the first team which becomes available for new projects (taking into consideration the WIP limit) pulls the first available project from the waiting list. Therefore, this assumption is also fulfilled.
The sixth assumption is that the queue size is not subject to an upper limit. There is no imposed limit on the waiting list size on the Kanban board, therefore this assumption is fulfilled.
The final assumption of the Erlang-C model is that there not be dramatic variations in event volumes. While data show the daily arrival rate varies between 0 and 7 projects per day, it is the case that over longer periods of time, especially those comparable with the average cycle time, those variations tend to fluctuate around a constant value of 0.71 projects per day, and this value was taken as the guiding λ value for further analysis.
4.2
Application of Erlang-C Model at Ericpol
The Erlang-C model calculates the probability (P) that an arriving project (work item) would need to be queued, given the traffic intensity (A), and number of agents (S). The Erlang-C formula, CA,S, i.e., for a given A and S, is calculated using the Poisson
probability distribution function of S for a given A as the distribution mean. Once this probability is known, one can calculate the probability that the waiting time in the queue will be greater than a given value (Target Answer time (TA)) and Average Waiting Time in the queue (W).
The relevant metrics and equations are summarized below. In summary, we provide the average projects inflow (λ), the average project duration (“service time”) (β), number of agents, i.e. the capacity of the development team (S), and Target Answer time (the time which the project waits in the queue) (TA) as input values. From there, we calculate the development intensity (A) and developer occupancy (O). Then, we can calculate the probability of waiting from the Erlang-C function (CA,S), and from there, the Average Waiting Time (W) and Service Level (SL).
𝐴=𝜆𝛽 𝑂=𝐴 𝑆 𝑊= 𝛽𝐶!,! 𝑆 1−𝑂 𝑆𝐿= 1−𝐶!,! 𝑒! !!! × !" ! × 100%
In the following analysis, we take the number of agents (S), and the average project inflow (λ), and the service time (β) as variables, and the other parameters as either constants or parameters of the analysis. This is due to the fact that number of agents can be directly manipulated, and average project inflow is what must be adapted to.
The values of project inflow λ (0.71 projects per day, on average)
and β (44 days, on average) are taken from the analysis of the
historical data to date. TA is chosen arbitrarily and it means that
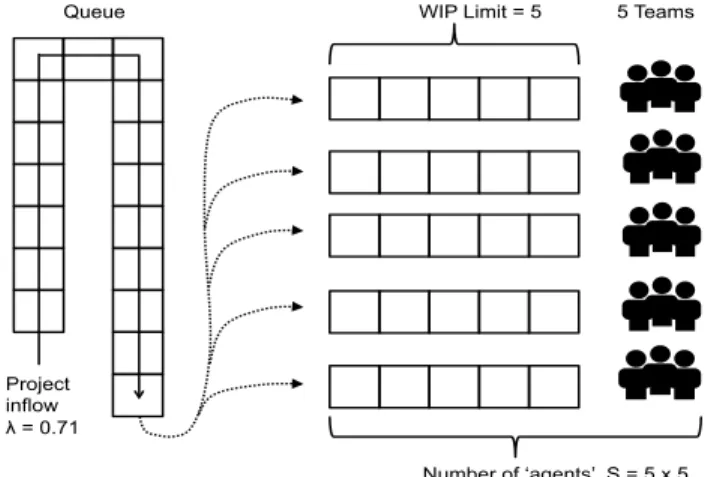
for a given Service Level (expressed in percent), the specified percentage of projects waits in the queue no more than TA days. The ‘number of agents’ (S) parameter needs further clarification. The base setup in Ericpol was to have five Kanban teams, each consisting of 8 people, giving 40 people overall. Every team works on the common Kanban board divided vertically into the same set of work states (as outlined in Section 3.3) for every team and into team lanes horizontally. All teams work from the common input queue, and each team has the same WIP limit of five projects. Figure 4 presents this set-up at Ericpol. From this point of view, the projects arriving “see” a system of five teams capable of handling up to 5 projects in parallel (that is, every team handles up to “WIP limit” number of projects). Thus, they see up to 25 virtual agents, hence the base value of S is set to 25. For that reason, we use the term ‘agent’ instead of ‘developer,’ as it represents the capacity to handle a task, or project.
Figure 4. 25 virtual agents: WIP limit of 5 for all 5 teams. Overall, this leads to the following as the initial input data:
• Number of agents, S=25
• Average project inflow, λ=0.71 [projects/day] or 21.3
[projects/month]
• Average project duration or service time, β=44 [days]
• Target Answering Time, TA=7 [days]
The remainder of this section presents analyses of (a) the effect of availability of agents (i.e., capacity) on agent occupancy and the organization’s service level (i.e., the ability to deliver within a set time frame), (b) the effects of an increased project complexity (i.e., service time needed), (c) the effect of changes in project inflow, and (d) the effect of the organization’s size (i.e., number of teams) on the queue length. Sections 4.3 to 4.6 present these, respectively.
4.3
Effect of Agent Availability on Agent
Occupancy and Service Levels
In this section we investigate the effect of Agent Availability (size of the development resources) on Agent Occupancy (development resource utilization) and the organization’s service level. Given the starting values above, the Agent Occupancy (O) and the Ser-vice Level (SL) are iteratively examined. In Figure 5, the number of agents (S), is the analysis variable. It is set initially at 25 and runs through 50 in increments of 5 (i.e. one-team increments with each new team having a WIP limit of 5). Additionally, given the assumption of project inflow (λ=0.71) and lead time (β=44) as constants, the target answering time (TA) parameter is set initially at 7 and iterates through 21 days in increments of 7.
WIP Limit = 5 Queue 5 Teams Number of ‘agents’ S = 5 x 5 Project inflow λ = 0.71
It is clear from Figure 5 that, for the current average project in-flow and average service time, the organization is overloaded: the agent occupancy is more than 120% with five teams, and thus the organization cannot provide any reasonable and predictable per-formance. It is only after the capacity of the organization is in-cremented to 7 teams (i.e. 35 Agents) that Agent Occupancy de-creases to less than 100%, thus within the organization’s capacity. Also, it is worth noting from Figure 5 that Agent Occupancy is not influenced by the Target Answer Time. The curve is identical for all TA values (which is why only the curve for TA=28 appears). In other words, allowing teams to take more time is not a solution when the organization’s capacity is too small to service a given inflow of new projects.
Figure 5. Agent occupancy
Figure 6 suggests that a reasonable Service Level (>80%) for any given target answer time is also only achieved after the capacity of the organization is incremented to 7 teams (i.e. 35 agents). It is interesting to note that again the Service Level depends only very slightly on the Target Answering Time (TA), as can be seen from the similarity of the curves in Figure 6. At the same time, as the figure shows, a capacity of 25 agents (5 teams) results in a Service Level of almost zero, meaning that almost no projects can be delivered within the set time frame defined by the TA. The service level improves dramatically with two more teams, seven in total. Thus, for an organization to be able to finish projects in a timely and predictable fashion, it is important that sufficient agents (i.e., teams) are available.
Figure 6. Service levels for varying Target Answering time with a constant service time of 44 days.
4.4
Effect of Increase in Project Service-Time
The average complexity of projects is also an important factor to consider in determining the required capacity of an organization to handle a given project inflow.
At Ericpol, some architectural changes in the base software product led to a natural increase in project complexity. This in turn led to an increase in project service-time (β) from 44 to 47 days on average. The effect of this increase in service-time on developer occupancy is not presented in a figure (the curve is very similar to Figure 5 above). Again, however, agent occupancy only decreased below 100% with 7 teams (i.e. 35 agents). The effect of this increase in service-time on service level is presented in Figure 7. It shows that a reasonable service level performance is achievable with 7 teams (around 80%), and very good performance (SL approximating 100% for given TAs) with 8 teams (i.e. 40 agents). The advantage of the model is that it clearly and precisely illustrates how particular service levels may be achieved depending on the development capacity that is available. Thus, the organization’s capacity to handle projects at a given inflow (λ) is clearly affected by the service time needed for projects. For management, continuous monitoring of service time is an important activity as it provides evidence on which to base staffing decisions.
Figure 7. Service level for varying Target Answering time with a constant service time of 47 days.
4.5
Effect of Project Inflow on Agent
Occupancy and Service Levels
We also investigated the effect of project inflow on agent occupancy and service levels. For this analysis, the average project inflow per month (λ) is taken as the analysis variable, the number of Agents (S=25) and average project service time (β=44) are taken as constants, and the target answer time (TA) is the analysis parameter. Figure 8 and Figure 9 present the analyses.
Figure 8. Agent occupancy depending on project inflow for varying Target Answering time.
0.0 50.0 100.0 150.0
25
30
35
40
45
50
% Agents (=teams * 5) Agent Occupancy, β=44 TA=7 TA=14 TA=21 TA=28 0.0 20.0 40.0 60.0 80.0 100.0 120.0 25 30 35 40 45 50 % Agents (=teams * 5)Service Level for TA, β=44
TA=7 TA=14 TA=21 TA=28 0.0 20.0 40.0 60.0 80.0 100.0 120.0 25 30 35 40 45 50 % Agents (=teams * 5)
Service Level for TA, β=47
TA=7 TA=14 TA=21 TA=28 0.0 50.0 100.0 150.0 200.0 15 16 17 18 19 20 21 22 23 24 25 % λ [projects/month] Agent Occupancy, S=25, β=44 TA=7 TA=14 TA=21 TA=28
Figure 8 shows that for 25 agents (i.e. 5 teams), agent occupancy is only below 100% when the average project inflow is below 17 projects per month. Furthermore, Figure 9 suggests that a reasonable Service Level performance is achievable when the average project inflow is also below 17 projects per month. Given that the average inflow at present is 21.3 project per month, the organization clearly needed to address this.
Figure 9. Service Level depending on project inflow for varying Target Answering time.
Given that the above analysis clearly shows Target Answering time (TA) is not a major influence on agent occupancy or service level, in the following analysis, this is fixed at TA=7. The average project service time is also set to 44 days, and we examine the impact of different team sizes and project arrival rates on agent occupancy and service level.
Figure 10 shows that for the current monthly project arrival rate (i.e. 21.3 projects), agent occupancy levels only reach a reasonable level when there are 7 or more teams (i.e. S≥35).
Figure 10. Agent Occupancy for varying number of teams and project inflow.
Examining service level with the same parameters (see Figure 11) reveals the same conclusion – for an average project arrival rate of 21.3 projects a month, service level only exceeds 80% when there are 7 or more teams (i.e. S≥35). The organization’s Service Level approaches 100% with 8 teams (S=40), but adding a ninth team (S=45) has a very marginal effect, and in the lean philosophy [46], could be considered a waste. Thus, similar to previous analyses,
this provides a good insight into how to calibrate the organization in terms of the number of teams needed.
Figure 11. Service level depending on project inflow for varying number of agents.
4.6
Effect of Organization Size on Queue
Length
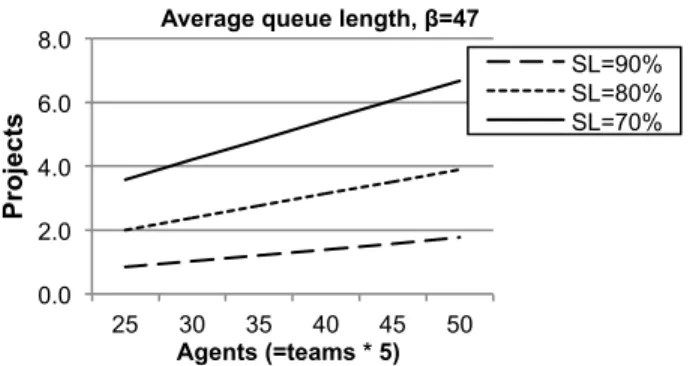
The fourth parameter that we analyze is the effect of the organization’s size on the queue length. The analysis in Figure 12 below illustrates for a given Service Level, with constant average project duration (i.e., 47 days), a larger organization (more agents) typically has a bigger queue (more projects waiting) than a smaller organization. However, as shown in previous subsections, an organization must have a certain capacity (i.e., sufficient teams) to be able to handle a given project inflow. Once queues are made visible, there may be a strong temptation to act on it, possibly in an uninformed way; that is, a longer queue size is not inherently undesirable, it is merely an effect of a larger organization. While some lean experts argue for limiting queue length by adding more resources when a queue gets too large [38], this is much more difficult in a software development context where “resources” means development teams. Due to the inevitable need to train new staff, these “resources” do not scale easily on a (very) short term. Therefore, setting queue size as the goal is another example of a mistaken assumption. The queue size should be treated as the effect of achieving a given service level, and the service level (focusing on customers) should be set as a goal instead.
Figure 12. Average queue length for varying service levels and number of agents. 0.0 20.0 40.0 60.0 80.0 100.0 15 16 17 18 19 20 21 22 23 24 25 % λ [projects/month] Service Level, S=25, β=44 TA=7 TA=14 TA=21 TA=28 40 60 80 100 120 140 160 15 16 17 18 19 20 21 22 23 24 25 % λ [projects/month] Agent Occupancy, β=44 S=25 S=30 S=35 S=40 S=45 0 20 40 60 80 100 120 15 16 17 18 19 20 21 22 23 24 25 % λ [projects/month]
Service Level for TA=7, β=44
S=25 S=30 S=35 S=40 S=45 0.0 2.0 4.0 6.0 8.0 25 30 35 40 45 50 Pr o je cts Agents (=teams * 5)
Average queue length, β=47
SL=90% SL=80% SL=70%
5.
DISCUSSION AND CONCLUSIONS
The above illustrates the manner in which more evidence-based analysis may be applied in relation to the management of software development projects. It illustrates how various parameters affect the software development process, and also how gut-feel and intuition can be problematic, resulting in poor decisions, as discussed below. For example, the organization now knows the inflow of project requests (and continues to monitor this), and the typical complexity of those projects in terms of the average service time to complete projects. Ericpol also know the size of the development function which is necessary to cope with this inflow of development requests. Based on careful monitoring and capturing of these data, Ericpol are able to make well-informed decisions regarding management of its software projects. In what follows, we discuss some implications for practice, limitations of this study, conclusions and further work.5.1
Implications for Practice
5.1.1
Danger of High Levels of Agent Occupancy
The analyses above clearly illustrate that the relationship between Service Level and the number of Agents (e.g. Figure 6 and Figure 7), or the average project inflow (e.g. Figure 10) is highly non-linear, and deteriorates rapidly as the Agent Occupancy (i.e. development capacity utilization) approaches 100%. This is in keeping with the Extreme Programming principle of trying to maintain a fairly constant 40-hour working week, whereby developers are not constantly overloaded [4]. An analogy that was used in Ericpol was that computers have a specific clock-speed which is known on purchase, and no one expects to operate the machine beyond that speed. However, with human resources, such as software developers, there is an expectation that they can exceed the normal limit. Developers are pushed harder with the goal of getting more out of them. A practical contribution of the model applied in Ericpol is that there is good visibility into precisely what those developer limits actually are. More informally, a motorway is an appropriate metaphor: a motorway utilized at full capacity is a parking lot, but a motorway with a low capacity utilization has a much better flow (or throughput) of traffic.
Using the evidence-based approach presented in this paper, Ericpol management decided to add additional teams so as to overcome the bottleneck of agent occupancy.
5.1.2
Fallacy of Adjusting Target Answering Time
When a software project manager faces an overload situation in terms of the queue of items awaiting development in the backlog, there may be a tendency to extend the target answering time (TA) as a means of relieving pressure. This was quite a common reaction when overload situations became apparent in Ericpol, in that managers often suggested that they would accept projects waiting in the queue for longer to help solve the overload situation. However, the analysis above illustrates that extending TA time achieves almost nothing. It has no effect on developer occupancy (e.g. Figure 5), and only a very marginal effect on service level performance (e.g. Figure 6 and Figure 7). Instead, the key action is to either increase staffing, or to decrease average project service time (e.g. by improving work methods, staff competence, eliminating waste), or both. Again, in relation to increasing staff, it is not a simple call for more development resources; rather, there is precise evidence to indicate what levels of staff increase will be necessary to achieve a particular desired effect.
In terms of decreasing cycle time, a good example of the lean principle of eliminating waste emerged within Ericpol. In the initial stages of Kanban implementation, it became evident that a significant delay was occurring in the hand-off between the development team and the integration team. By addressing this waste specifically, the overall cycle time was reduced from almost 100 days to just over 60 days, a significant improvement. Given that project inflow and size of development teams is not easy to control, the effect of the slight increase in the project service time (increase in β from 44 to 47 days) shown in Figure 6 and Figure 7, illustrates the importance of this issue. Clearly, a decrease in project service time would also have beneficial effects. For example, in this case, a project service time of 30 days would result in a very good service level response with just 25 agents. This has resonances with the lean principle of recognizing “specials,” that is, identifying and isolating those cases which require special processing, and which as a result are more complex and should be handled with a different process. In this case, if more complex development requests could be identified, these could be streamed into a “special” process. The benefit of the current model is that Ericpol could determine exactly how various service times impinge on development occupancy and service levels.
5.1.3
Distributed Multi-Site Teams Should Pull from
Same Input Queue
Another important observation from the above charts in relation to Agent Occupancy is that the bigger an organization is (the more teams it has), the less sensitive it is to fluctuations in the average inflow (the angle between the x axis and the Agent Occupancy line is lower as shown in Figure 10 above). This corresponds to the principle that variability increases queues linearly [39, p.62]. This suggests that even in the multi-site distributed set-up in operation at Ericpol, all the teams across different sites should work on a common input queue or backlog for software development. This in turn has important implications for the practice of distributed software development in terms of several facets, an important one of which is coordination [14].
Based on this observation Ericpol management decided shortly after introducing Kanban to expand the development group to a multi-site, international set-up. The initial idea of having one queue per site was abandoned in favor of one global queue for all sites.
5.1.4
Fallacy of Setting Queue Size as Goal
Finally, the analysis above illustrates that a typical management reaction of setting a goal for queue size is not well advised for a Kanban organization. Focusing on queue size is effectively focusing on utilization and thus on cost. There may appear to be more ‘bang for the buck’ as there is a fuller utilization of resources, but ultimately there is lower overall throughput, or flow, as the queue size and the average cycle time grows, and the organization delivers less valuable software than if there was a lower utilization of resources. Customers are not actually concerned with how long a queue is or what the average waiting time is—rather they are concerned with how fast the software is delivered. In Ericpol, almost 40% of projects take longer than the average waiting time to commence. Given that the service time is fairly constant, the focus should rather be on the service level for a given target answering time, and the staffing required to achieve that service level, and the queue size emerges as a result of that (Figure 12).
5.2
Limitations of this Study
An important consideration is the nature of the case study methodology used for this study, and to what extent the findings can be generalized to other contexts [40]. Ericpol is a software development organization of considerable size (1,700 staff), and software development projects tended to possess certain properties that made the adoption of Kanban as a software development approach suitable. While Kanban is still considered a novel approach within software engineering, it is increasingly adopted in industry [1]. Kanban worked well for Ericpol, but the extent to which this method is applicable to other organizations is an open question, depending on the characteristics of the organization and type of software development projects.
With regards to the reliability of the data, all data were collected through the web-based Kanban board tool mentioned in Section 3. The data were entered manually by team members and stored in a database. While data entry is manual and thus subject to potential errors, all data were verified by project coordinators during preparation of delivery to customers. The tool also facilitates automatic data checks to identify any inconsistencies.
5.3
Conclusion and Further Work
Evidence-based approaches are increasingly recognized to be superior to approaches based on experience, special skills, dogma or mimicking other top performers [32]. Following evidence-based medicine, evidence-evidence-based software engineering has been recognized to be important within software engineering research [17]. Evidence can be generated to support practitioners in different ways. For instance, much research has focused on generating evidence regarding the usefulness of new technologies, such as object-oriented and aspect-oriented programming [33]. Far fewer studies have focused on how evidence can be generated in real-world settings and used to inform project management decisions. This paper presented an industry case study where the use of a model provides sound input into the decision making process for software project management.
The key contributions of this paper are twofold. Firstly, it presents an industry case study of evidence-based software project management. It demonstrates how an organization can make better decisions based on data gathered and analysed using a model (in this case, Erlang-C) that is highly relevant in the organization’s context. Secondly, this paper adds to the still limited literature on lean software development; in particular, it presents a case of the use of Kanban in software development, and how the Kanban approach has been dimensioned using a number of parameters. Although some have suggested caution regarding the use of mathematical analyses in development processes, this case illustrates how such analyses can help in determining important parameters of a software development function [11]. Ericpol have made a number of project management decisions based on these analyses. The organization is continuing to further refine the model and analyses. Some improvements that are planned are:
• Empirical determination of the number of agents per team – as shown in Figure 4, each team represents 5 virtual agents; that is, each team has a WIP limit of 5, meaning a team can work on 5 projects in parallel. Ericpol is experimenting to establish an optimal WIP limit.
• Empirical determination of the organization’s actual development capacity occupancy.
• Identify any potential ways to enhance the model with
correcting factors to correct for any variability present in the teams.
We conclude by observing that Ericpol has been able to achieve an evidence-based approach to decision making in software project management, which has ben a long-standing goal within software engineering research. We believe that observing and documenting such real-world cases can greatly help in achieving that goal.
6.
ACKNOWLEDGMENTS
This work is partially funded by Science Foundation Ireland grant 10/CE/I1855 to Lero—the Irish Software Engineering Research Centre (www.lero.ie).
7.
REFERENCES
[1] Ahmad, M.O., Markkula, J. and Ovio, M. 2013. Kanban in software development: A systematic literature review. Proc. 39th Euromicro Conference Series on Software Engineering and Advanced Applications.
[2] Anderson, D.J. 2010. Kanban - Successful Evolutionary Change for your Technology Business, Blue Hole Press. [3] Anderson, D.J., Concas, G., Lunesu, M.I., Marchesi, M. and
Zhang, H. 2012. A Comparative Study of Scrum and Kanban Approaches on a Real Case Study Using Simulation. Proc. XP. Springer. 123-137.
[4] Beck, K. 2000. Extreme Programming Explained: Embrace Change. , Addison-Wesley, Reading, MA, USA.
[5] Birkeland, J.O. 2010. From a Timebox Tangle to a More Flexible Flow. Proc. XP, LNBIP 48. Springer. 325-334. [6] Bocock, L. and Martin, A. 2011. There’s Something About
Lean. Agile Conference.
[7] Brooks, F.P. 1985. The mythical man-month: essays on software engineering, Anniversary ed., Addison Wesley Longman, Inc.
[8] Browaeys, M.-J. and Fisser, S. 2012. Lean and agile: an epistemological reflection, The Learning Organization, 19, 3, 207-218.
[9] Cox, B.J. 1990. Planning the Software Industrial Revolution, IEEE Software, 7, 6, 25-33.
[10] Dybå, T., Kitchenham, B.A. and Jørgensen, M. 2005. Evidence-Based Software Engineering for Practitioners, IEEE Software, 22, 1, 58-65.
[11] Ebert, C., Abrahamsson, P. and Oza, N. 2012. Lean Software Development, IEEE Software, 29, 5, 22-25.
[12] Fenton, N.E. and Pfleeger, S.L. 1997. Software Metrics: A Rigorous and Practical Approach, 2nd ed., PWS Publishing Company.
[13] Ghoshal, A., Gupta, A. and Subramani, M. 2012. Allocating Shared Resources Optimally for Call Center Operations and Knowledge Management Activities. Proceedings of the 33rd International Conference on Information Systems.
[14] Herbsleb, J.D. and Grinter, R.E. 1999. Coordination, and Distance: Conway’s Law and Beyond, IEEE Software, 16, 5, 63-70.
[15] Hiranabe, K. 2008. Kanban Applied to Software Development: from Agile to Lean.
[16] Ikonen, M., Pirinen, E., Fagerholm, F., Kettunen, P. and Abrahamsson, P. 2011. On the Impact of Kanban on Software Project Work. Proc. 16th IEEE International Conference on Engineering of Complex Computer Systems. [17] Kitchenham, B.A., Dybå, T. and Jørgensen, M. 2004.
Evidence-based Software Engineering. Proc. 26th
International Conference on Software Engineering. 273-281. [18] Kniberg, H. and Skarin, M. 2010. Kanban and Scrum:
Making the Best of Both, C4Media Inc.
[19] Koole, G. 2013. Call Center Optimization, MG Books. [20] Larman, C. and Vodde, B. 2009. Scaling Lean & Agile
Development: Thinking and Organizational Tools for Large-Scale Scrum, Addison-Wesley, MA, USA.
[21] Lawrence Brown, Gans, N., Mandelbaum, A., Sakov, A., Shen, H., Zeltyn, S. and Zhao, L. 2005. Statistical Analysis of a Telephone Call Center: A Queueing-Science
Perspective, Journal of the American Statistical Association, 100, 469, 36-50.
[22] Maglyas, A., Nikula, U. and Smolander, K. 2012. Lean Solutions to Software Product Management Problems, IEEE Software, 29, 5, 40-46.
[23] Middleton, P. 2001. Lean Software Development: Two Case Studies, Software Quality Journal, 9, 241-252.
[24] Middleton, P., Flaxel, A. and Cookson, A. 2005. Lean Software Management Case Study: Timberline Inc. Extreme Programming and Agile Processes in Software Engineering. Springer Berling, Heidelberg.
[25] Middleton, P. and Joyce, D. 2010. Lean Software Management: BBC Worldwide Case Study, IEEE Transactions on Engineering Management, 59, 1, 20-32. [26] Munson, J.C. 2003. Software Engineering Measurement,
Auerbach Publications.
[27] Ohno, T. 1988. Toyota Production System: Beyond Large-Scale Production, Taylor & Francis Group, LLC, Boca Raton, FL, USA.
[28] Parnell-Klabo, E. 2006. Introducing Lean Principles with Agile Practices at a Fortune 500 Company. Proc. AGILE Conference. IEEE.
[29] Pernstål, J., Feldt, R. and Gorschek, T. 2013. The lean gap: A review of lean approaches to large-scale software systems development, The Journal of Systems and Software, 86, 11, 2797-2821.
[30] Petersen, K. 2011. Is Lean Agile and Agile Lean?: A Comparison between Two Software Development
Paradigms, in: Modern Software Engineering Concepts and Practices: Advanced Approaches, IGI Global.
[31] Petersen, K. and Wohlin, C. 2011. Measuring the flow in lean software development, Softw. Pract. Exper., 41, 975-996.
[32] Pfeffer, J. and Sutton, R.I. 2006. Evidence-Based Management, Harvard Business Review.
[33] Pfleeger, S.L. and Menezes, W. 2000. Marketing Technology to Software Practitioners, IEEE Software, 17, 1, 27-33. [34] Polk, R. 2011. Agile & Kanban in Coordination. Agile
Conference. IEEE.
[35] Poppendieck, M. and Poppendieck, T. 2003. Lean Software Development: An Agile Toolkit, Addison-Wesley.
[36] Rainer, A., Jagielska, D. and Hall, T. 2005. Software engineering practice versus evidence-based software engineering research. Proc. Workshop on Realising Evidence-Based Software Engineering (REBSE). St. Louis, Missouri, USA.
[37] Raman, S. 1998. Lean Software Development: Is It Feasible? Proc. 17th AIAA/IEEE/SAE Digital Avionics Systems Conference.
[38] Reinertsen, D. and Shaeffer, L. 2005. Making R&D Lean, Research Technology Management, 48, 4, 51-57. [39] Reinertsen, D.G. 2009. The Principles of Product
Development Flow, Celeritas Publishing, Redondo Beach, CA, USA.
[40] Runeson, P., Höst, M., Rainer, A. and Regnell, B. 2012. Case Study Research in Software Engineering: Guidelines and Examples, Wiley.
[41] Seikola, M., Loisa, H.-M. and Jagos, A. 2011. Kanban Implementation in a Telecom Product Maintenance. Proc. 37th EUROMICRO Conference on Software Engineering and Advanced Applications. IEEE.
[42] Sjøberg, D.I.K., Johnsen, A. and Solberg, J. 2012. Quantifying the Effect of Using Kanban versus Scrum: A Case Study, IEEE Software, 29, 5, 47-53.
[43] VersionOne. 2012. 7th Annual State of Agile Survey: The State of Agile Development.
http://www.versionone.com/pdf/7th-Annual-State-of-Agile-Development-Survey.pdf.
[44] Wang, X., Conboy, K. and Cawley, O. 2012. “Leagile” software development: An experience report analysis of the application of lean approaches in agile software
development, The Journal of Systems and Software, 85, 1287-1299.
[45] Williams, L. and Cockburn, A. 2003. Agile Software Development: It’s about Feedback and Change, IEEE Computer, 36, 6, 39-43.
[46] Womack, J.P. and Jones, D.T. 2003. Lean Thinking: Banish Waste and Create Wealth in Your Corporation, Revised ed., Free Press, New York, NY, USA.
[47] Wood, N. 2004. Lean Thinking: What It Is and Is Not., Management Services, 48, 2, 8-20.
[48] Zelkowitz, M., Wallace, D. and Binkley, D. 2003. Evaluation of new software engineering technologies, in: N. Juristo, A. Moreno (Eds.) Software Engineering Empirical Validation, World Scientific Publishing.