Optimisation of speed camera locations using genetic
algorithm and pattern search
by
Agnes Boscoe-Wallace
A Doctoral Thesis
Submitted in partial fulfilment of the requirements
for the award of
Doctor of Philosophy of Loughborough University
February 2017
i
Abstract
Road traffic accidents continue to be a public health problem and are a global issue due to the huge financial burden they place on families and society as a whole. Speed has been identified as a major contributor to the severity of traffic accidents and there is the need for better speed management if road traffic accidents are to be reduced. Over the years various measures have been implemented to manage vehicle speeds. The use of speed cameras and vehicle activated signs in recent times has contributed to the reduction of vehicle speeds to various extents. Speed cameras use punitive measures whereas vehicle activated signs do not so their use depends on various factors. Engineers, planners and decision makers responsible for determining the best place to mount a speed camera or vehicle activated sign along a road have based their decision on experience, site characteristics and available guidelines (Department for Transport, 2007; Department for Transport, 2006; Department for Transport, 2003). These decisions can be subjective and indications are that a more formal and directed approach aimed at bringing these available guidelines together in a model will be beneficial in making the right decision as to where to place a speed camera or vehicle activated sign is to be made. The use of optimisation techniques have been applied in other areas of research but this has been clearly absent in the Transport Safety sector. This research aims to contribute to speed reduction by developing a model to help decision makers determine the optimum location for a speed control device.
In order to achieve this, the first study involved the development of an Empirical Bayes Negative Binomial regression accident prediction model to predict the number of fatal and serious accidents combined and the number of slight accidents. The accident prediction model that was used explored the effect of certain geometric and traffic characteristics on the effect of the severity of road traffic accident numbers on selected A-roads within the Nottinghamshire and Leicestershire regions of United Kingdom. On A-roads some model variables (n=10) were found to be statistically significant for slight accidents and (n=6) for fatal and serious accidents.
The next study used the accident prediction model developed in two optimisation techniques to help predict the optimal location for speed cameras or vehicle activated
ii
signs. Pattern Search and Genetic Algorithms were the two main types of optimisation techniques utilised in this thesis. The results show that the two methods did produce similar results in some instances but different in others. Optimised results were compared to some existing sites with speed cameras some of the results obtained from the optimisation techniques used were within proximity of about 160m. A validation method was applied to the genetic algorithm and pattern search
optimisation methods. The pattern search method was found to be more consistent than the genetic algorithm method. Genetic algorithm results produced slightly different results at validation in comparison with the initial results. T-test results show a significant difference in the function values for the validated genetic algorithm (M= 607649.34, SD= 1055520.75) and the validated pattern search function values (M= 2.06, SD= 1.17) under the condition t (79) = 5.15, p=0.000. There is a role that optimisation techniques can play in helping to determine the optimum location for a speed camera or vehicle activated sign based on a set of objectives and specified constraints. The research findings as a whole show that speed cameras and vehicle activated signs are an effective speed management tool. Their deployment however needs to be carefully considered by engineers, planners and decision makers so as to achieve the required level of effectiveness. The use of optimisation techniques which has been generally absent in the Transport Safety sector has been shown in this thesis to have the potential to contribute to improve speed management. There is however no doubt that this research will stimulate interest in this rather new but high potential area of Transport Safety.
iii
Statement of originality
The author (Agnes Boscoe-Wallace) is wholly responsible for the work carried out and presented in this thesis. Dr. Markus Deublein allowed the author of this research to use his method for calculating the slope and radius of the road segments.
Work carried out in this thesis was funded by Loughborough University Graduate scholarship.
This statement certifies that neither the submission nor the original work contained in this thesis has been submitted for an award or other degree awarding body.
iv
Acknowledgments
I would like to take this opportunity to express my gratitude to my supervisors Dr. Richard Frampton and Professor Andrew Morris for their kind support, advice and encouragement throughout this research. There were times I just needed some advice on how to move on and the little chats were all very useful. I would also like to thank my internal assessor Professor Pete Thomas for all the useful advice and suggestions. My sincere gratitude to Nottinghamshire County Council, Leicestershire County Council, Leicestershire Police and Julian Hill for allowing use of their data. Thanks to Dr. Vincent Dwyer, Professor M Quddus, Dr. Markus Deublein and Dr. Martins Irhebhude for volunteering their time to offer very useful advice and knowledge. My appreciation goes to Professor Serpil Acar, Dr. Jo Barnes, Dr. Andrew May and Professor Monney for your words of encouragement. To the other PhD students I had the opportunity to interact with, I would like to say thanks for being there to share ideas especially Carlos and Karthik. My gratitude also goes to Loughborough University for offering me a full scholarship to undertake this research without which it would not have been possible.
Special thanks to my parents for all their sacrifice towards my education and to my siblings for your support and encouragement. Special thanks to my husband and children for being understanding, supportive, encouraging and for your prayers which has made all the difference in seeing me through.
Finally but not the least I would like to thank God for giving me the strength and wisdom to undertake this research.
v
Dedication
To my Parentsvi
Table of Contents
Abstract ... i
Statement of originality ... iii
Acknowledgments ... iv
Dedication ... v
List of Figures ... x
List of Tables ... xii
1 Introduction and overall research aims ... 1
1.1 Background to research problem ... 1
1.2 Current approach to installing vehicle activated signs and speed cameras ... 1
1.3 Research in Context ... 4
1.4 Research Aim ... 4
1.5 Research Objectives ... 4
2 Literature review ... 5
2.1 Introduction into the wider context of road safety issues ... 5
2.1.1 The origins of speed limits in the UK ... 6
2.1.2 History of speed cameras and vehicle activated signs ... 7
2.1.3 Why do people speed ... 9
2.1.4 The contribution of speed to road accidents ... 10
2.1.5 The contribution of speed to pedestrian fatality ... 13
2.1.6 The contribution of speed to car occupant fatality ... 15
2.1.7 Pedal cyclist as vulnerable road users ... 18
2.2 Factors influencing vehicle speed ... 19
2.2.1 Introduction ... 19
2.2.2 Road Conditions ... 21
2.2.3 Traffic Conditions ... 29
2.2.4 Road Environment ... 37
2.2.5 Other factors ... 39
2.2.6 Effectiveness of vehicle activated signs ... 44
2.2.7 Effectiveness of speed cameras ... 47
2.3 Summary ... 55
3 Analysis Methodologies ... 57
vii
3.2 Accident Prediction Models ... 57
3.2.1 Empirical Bayes (EB) models ... 58
3.2.2 Bayesian Hierarchical (BH), Hierarchical Bayes (HB) and Full Bayes Hierarchical and Bayesian multivariate models ... 60
3.2.3 Negative Binomial (NB) models ... 63
3.2.4 Poisson Regression (PR) models ... 65
3.2.5 Random Effect Negative Binomial (RENB) and Random Parameters Negative Binomial Regression models ... 65
3.2.6 Multivariate Poisson-lognormal (MVPLN) regression, Univariate Poisson regression and Poisson lognormal (PLN) models ... 67
3.2.7 Zero Inflated (ZI) models ... 68
3.2.8 Generalised Linear models (GLM) ... 69
3.2.9 Classification and Regression Tree (CART) models ... 70
3.2.10 Other models ... 70
3.3 Summary table of reviewed accident prediction models ... 72
3.4 Characteristics of accident prediction models ... 81
3.5 Facility Location ... 82
3.5.1 Multi-objective spatial decision making ... 83
3.5.2 Challenges of multi-objective optimisation problems ... 86
3.5.3 Applicable methods for facility location problems ... 86
3.6 Genetic Algorithms ... 89
3.6.1 Background to Genetic algorithms ... 90
3.6.2 Characteristics of Genetic algorithms ... 91
3.6.3 Advantages and disadvantages of genetic algorithm ... 95
3.6.4 Applications of genetic algorithms in location science ... 96
3.6.5 Sample calculation for Genetic Algorithm ... 100
3.7 Pattern search ... 100
3.7.1 Pattern ... 101
3.7.2 Meshes ... 101
3.7.3 Polling ... 102
3.8 Choice of accident prediction model and justification and Chapter summary ... 102
4 Methodology and data description ... 106
viii
4.2 Study Area: Nottinghamshire and Leicestershire, UK ... 106
4.3 Accident Prediction Model Methodology ... 108
4.3.1 Road accident categories and terminologies ... 109
4.3.2 Road accident data ... 110
4.3.3 Traffic flow data ... 110
4.3.4 Road geometry data and maps ... 111
4.3.5 Bicycle route ... 112
4.3.6 Average speed and road speed limit ... 112
4.3.7 Model variables ... 112
4.3.8 Data preparation ... 113
4.3.9 Site selection ... 116
4.3.10 Model parameters ... 118
4.3.11 Negative Binomial Empirical Bayes model ... 122
4.3.12 Software applications ... 122
4.4 Optimisation model Methodology ... 123
4.4.1 Roads Identification ... 123
4.4.2 Choice of optimisation model ... 124
4.4.3 Identification of model objectives ... 124
4.4.4 Minimise the total set-up cost of a speed control device ... 125
4.4.5 Minimise the maintenance cost of a speed control device ... 125
4.4.6 Minimise the total lost cost of the severity and frequency of an accident125 4.4.7 The objective function ... 126
4.4.8 Model constraints ... 128
4.5 Application of optimisation model to selected roads ... 130
4.6 Data validation ... 133
5 Results (I): Accident prediction model ... 135
5.1 Results and discussion... 135
5.2 Negative Binomial model results ... 135
5.3 Empirical Bayes model results ... 149
5.4 Summary ... 157
6 Results (II): Optimisation model ... 159
6.1 Introduction ... 159
ix
6.3 Genetic Algorithm Results ... 165
6.4 Model validation ... 178
6.5 Limitations of model ... 189
7 Discussion of findings ... 191
7.1 Introduction ... 191
7.2 Accident prediction model ... 192
7.2.1 Fatal and serious accidents ... 194
7.2.2 Slight accidents ... 195
7.2.3 Other statistical tests ... 197
7.3 Optimisation model ... 199
7.3.1 Pattern Search ... 200
7.3.2 Genetic Algorithm ... 203
7.3.3 Comparing Pattern Search and Genetic Algorithm ... 204
7.4 Methodological reflections ... 209
7.4.1 Validity of findings ... 209
7.4.2 Reliability of findings ... 210
7.4.3 Policy implications ... 210
8 Conclusions and further research ... 213
8.1 Conclusions ... 213
8.1.1 Accident prediction model ... 213
8.1.2 Optimisation model ... 215
8.2 Contribution to knowledge ... 217
8.3 Further Work ... 218
References ... 220
Appendices ... 249
Appendix A: Site visits risk assessment ... 249
Appendix B: Matlab code used to run Genetic Algorithm for a typical road ... 258
Appendix C: Matlab code used to run Pattern Search for a typical road ... 259
Appendix D: GIS plots of the variation of accidents along roads... 260
Appendix E: Easting, Northing and function value for optimised roads (Pattern Search) ... 273
Appendix F: Easting, Northing and function value for optimised roads (Genetic Algorithm) ... 278
x
List of Figures
Figure 1 Cumulative impact speed distributions for pedestrians struck by the front of
cars or car derivatives (Ashton and Mackay, 1979) ... 13
Figure 2 Fatality risk as a function of impact speed for adult pedestrians hit by the front of a passenger car (Rosén and Sander, 2009) ... 14
Figure 3 ETS Distribution for fatally injured belted drivers with airbags (N=41) (Frampton et al., 2006) ... 18
Figure 4 Factors influencing vehicle speed (Wahlgren, 1967) ... 20
Figure 5 Speed-density curve (Hau, 1992) ... 30
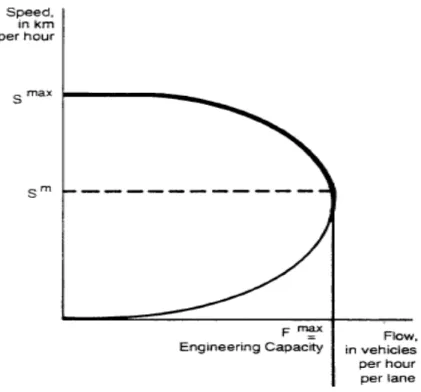
Figure 6 Speed-flow curve (Hau, 1992) ... 31
Figure 7 Relationship between road fatalities and vehicle density (Shefer, 1994) .... 34
Figure 8 ‘SLOW DOWN' sign ... 42
Figure 9 Roulette wheel ... 93
Figure 10 Simple single point crossover and Simple multipoint crossover ... 94
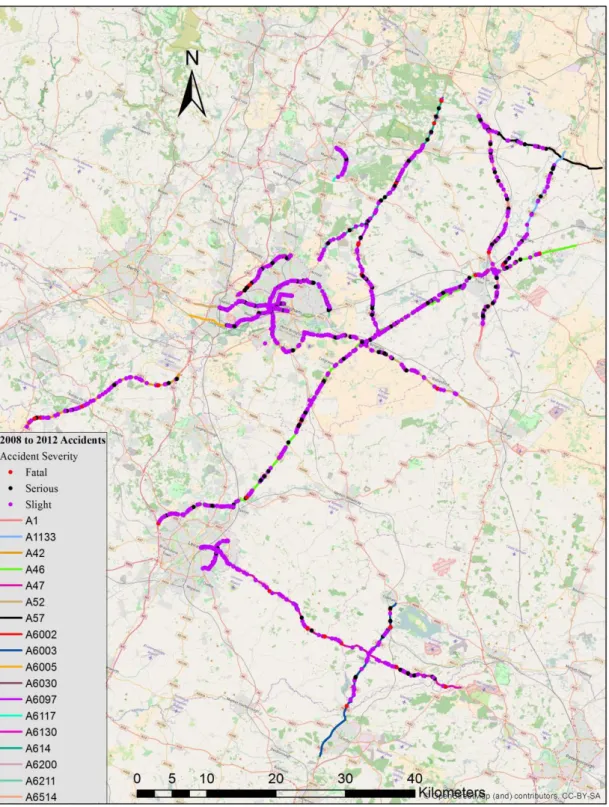
Figure 11 2008 to 2012 road accidents ... 115
Figure 12 AADT count points ... 116
Figure 13 Roads selected in Nottinghamshire and Leicestershire ... 117
Figure 14 Sample road segments considered for optimisation ... 132
Figure 15 Comparison of STATS19 fatalities with death registration from the Office of National Statistics (2008-2012) ... 133
Figure 16 Relationship between the observed and residual values (observed-predicted) of accidents from Negative Binomial model ... 148
Figure 17 Relationship between the observed and residual values (observed-predicted) of accidents from Empirical Bayes model ... 156
Figure 18 Plot of best fitness values for A6002... 161
Figure 19 Plot of best fitness value for A6130SN and A47WE ... 162
Figure 20 Plot of best fitness value for A6117 ... 163
Figure 21 Plot of best fitness value for A6030 ... 164
Figure 22 Plot of best fitness value for A6005 ... 165
Figure 23 Plot of function values with crossover fractions ... 166
Figure 24 Results from Genetic Algorithm Optimisation ... 168
Figure 25 Results from Genetic Algorithm Optimisation ... 169
Figure 26 Results from Genetic Algorithm Optimisation ... 170
Figure 27 Genetic Algorithm and Pattern Search plotted results for A6130 ... 172
Figure 28 Genetic Algorithm and Pattern Search plotted results for A6117 ... 173
Figure 29 Genetic Algorithm, Pattern Search and Existing plotted results for A47 174 Figure 30 Genetic Algorithm, Pattern Search and Existing plotted results for A6005 ... 175
Figure 31 Genetic Algorithm and Pattern Search plotted results for A6030 ... 176
Figure 32 Genetic Algorithm and Pattern Search plotted results for A6002 ... 177
Figure 33 Validated results for Genetic Algorithm Optimisation ... 182
Figure 34 Validated results for Genetic Algorithm Optimisation ... 183
xi
xii
List of Tables
Table 1 Summary of factors influencing vehicle speed ... 53
Table 2 Summary table of reviewed accident prediction models ... 73
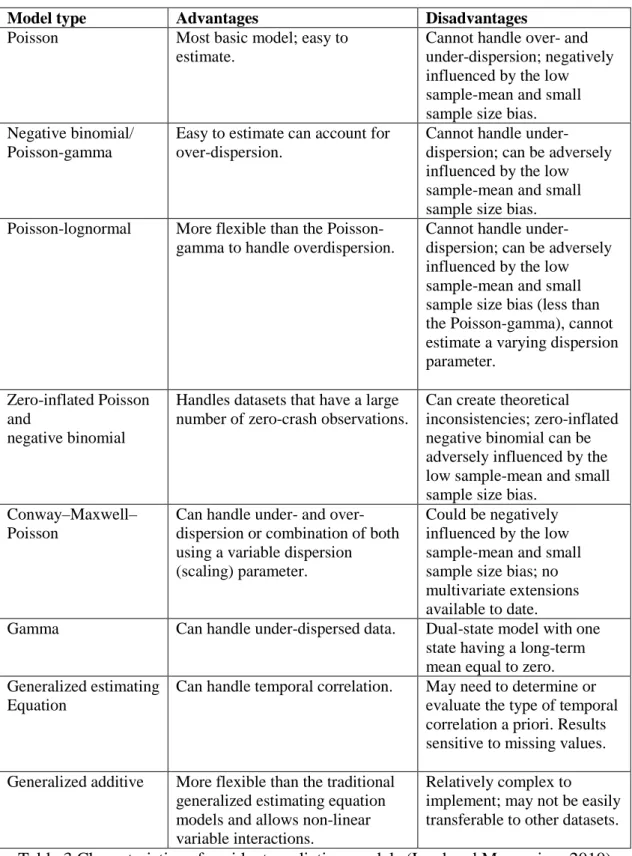
Table 3 Characteristics of accident prediction models (Lord and Mannering, 2010) 81 Table 4 Contribution of speed to accidents in Leicestershire, 2004 to 2009 (Leicestershire County Council, 2011) ... 107
Table 5 Description of model variables ... 119
Table 6 Characteristics of A-roads investigated ... 120
Table 7 Further characteristics of A-roads investigated ... 121
Table 8 Parameter estimates for initial models ... 135
Table 9 Continuous variable information of Fatal and Serious (FaSer) accidents .. 136
Table 10 Continuous variable information of Slight accidents ... 136
Table 11 Categorical variable information of Fatal and Serious accidents and Slight accidents ... 136
Table 12 Parameter estimates for fatal and serious accidents on A-roads ... 137
Table 13 Parameter estimates for slight accidents on A-road ... 137
Table 14 Goodness of Fit for fatal and serious accidents and slight accidents ... 138
Table 15 Omnibus Test ... 139
Table 16 Correlation of parameter estimates for fatal and serious accidents on A-roads ... 146
Table 17 Correlation of parameter estimates for slight accidents on A-roads ... 147
Table 18 Results of accident predictions ... 151
Table 19 Results of t-test paired sample statistics for accidents ... 153
Table 20 Results of t-test for accidents ... 154
Table 21 Roads used in optimisation ... 159
Table 22 Results of t-test paired sample statistics for optimisation function values 170 Table 23 Results of t-test for optimisation function values ... 171
Table 24 Results of t-test paired sample statistics for predicted and validated Empirical Bayes fatal and serious accidents ... 179
Table 25 Results of t-test paired sample statistics for predicted and validated Empirical Bayes fatal and serious accidents ... 180
Table 26 Results of t-test paired sample statistics for predicted and validated Empirical Bayes slight accidents ... 180
Table 27 Results of t-test paired sample statistics for predicted and validated Empirical Bayes slight accidents ... 181
Table 28 Results of t-test paired sample statistics for validated optimisation function values ... 186
Table 29 Results of t-test for validated optimisation function values ... 187
Table 30 Results of t-test paired sample statistics for validated and initial optimised genetic algorithm function values ... 187
Table 31 Results of t-test for validated optimisation function values ... 188
Table 32 Results of t-test paired sample statistics for validated and initial optimised pattern search function values ... 188
xiii
Table 33 Results of t-test for validated and initial optimised pattern search function values ... 189
1
1 Introduction and overall research aims
1.1 Background to research problemThere is evidence to show that inappropriate speeding is a major contributor to the severity of road traffic accidents (Barker, 1997; Chen, Meckle and Wilson, 2002; Winnett and Wheeler, 2002; Taylor, Baruya and Kennedy, 2002; Perez et al., 2007; World Health Organisation [WHO], 2013). Road traffic speed reduction measures are essential to reducing road traffic accident severities (Crombie, 2002; Peden et al., 2004; Pilkington and Kinra, 2005) with speeding inappropriately for prevailing conditions or exceeding set speed limits being the two most common speed related factors to road traffic accidents.
In an attempt to influence and reduce driver speed various road infrastructure devices such as road humps, chicanes, rumble strips, narrowing, mini-roundabout and village gateway schemes have been used. More recently, speed control devices such as speed cameras and vehicle activated signs have been deployed along roads to help reduce driver vehicle speeds. A lot of research work has also been conducted into the effectiveness of speed cameras and vehicle activated signs with positive responses obtained in most instances.
1.2 Current approach to installing vehicle activated signs and speed cameras
The only source of advisory information identified for the installation of vehicle activated signs is Traffic Advisory Leaflet (TAL) 1/03 (Department for Transport, 2003). This leaflet states that Vehicle Activated Signs (VAS) are to be used to address problems associated with inappropriate speeds in situations where conventional signing has been ineffective. VASs however should not be used as an alternative to fixed signs. It also adds that VASs should be considered in instances where there is an accident problem associated with inappropriate speed. It should be used where standard signing has been unable to satisfactorily remedy problem. Also in instances where safety cameras and other signs are not cost effective or an appropriate solution, VASs can be used.
It is advised that an audit of existing furniture, fixed signs, road condition and road markings are undertaken to assess their standard and condition before installing a
2
VAS. It is advised in TAL 1/03 that a detailed accident investigation should be undertaken to both identify the dominant accident patterns and to confirm that VASs are an appropriate remedial measure. The site selection should also take into account the number of speed related accidents and in particular inappropriate speed for the conditions prevailing. Monitoring of traffic speeds can be carried out to establish that a problem of inappropriate speed exists. Traffic Advisory Leaflet 1/03 advises using speed data collected prior to the installation of a VAS to help estimate a suitable threshold speed for the sign to display the message (Department for Transport, 2003).
For warning sign VASs, TAL 1/03 (Department for Transport, 2003) advises that the speed threshold be set at the 50th percentile speed measured before installation. For speed limit signs it is advised that the threshold set be dependent on the road conditions with a reasonable benchmark being the ACPO (Association of Chief Police Officers) guidelines on enforcement of 10% + 2mph. It is also necessary to ensure that permanent warning signs sited in advance of any VAS are correctly and appropriately placed in accordance with Chapter 4 of the Traffic Signs Manual (Department for Transport, 2013).
Safety cameras are noted to provide a valuable and cost-effective method for preventing, detecting and enforcing speed and traffic light offences. They have been proved to encourage modified driver behaviour improving road safety for all road users. The Department for Transport (DfT) circular 01/07 (Department for Transport, 2007) provides guidance and best practice on the deployment of speed and red-light cameras after April 2007.
Circular 01/2007 (Department for Transport, 2007) recommends that before deciding on using speed cameras, investigations should be conducted on the nature of the problem. The investigation should include current vehicle speeds, the proportion of vehicles exceeding the speed limit under free-flowing conditions, the proportion of different collision types, and the causes of the collisions. It is also essential that traffic authorities confirm that the speed limit at each proposed site is appropriate. In addition to these in order to select camera sites, a collision data analysis needs to be carried out over a minimum period (most recent 3 years or preferably 5 years) and
3
the 85th percentile speed of vehicles within a 12 month period must be collected. Cameras must be positioned such that they are not obscured and clearly visible at all times. For 40mph or less speed limit roads a minimum visibility distance of 60 metres is recommended with a minimum of 100 metres at all other speed limit locations by TAL 1/03 (Department for Transport, 2003).
The Parliamentary Office of Science and Technology POSTnote 04/218 (Parliamentary Office of Science and Technology, 2004) provided DfT guidelines applicable to speed camera use. It states that the majority (85%) of cameras must be in areas which have a specified minimum level of death and injury within 1km in the previous three years (4 collisions resulting in death/serious injury for fixed cameras, 2 for mobile). It recommends that speeding must be shown to be a problem at the location even though crashes do not need to have been speed-related.
From the summaries provided on the guidelines for the installation of VASs and speed cameras, it is evident that the VAS guidelines provide some suggestions of the instances under which they should be placed as well as the possible investigations which should be carried out.
Current practice for installing road side speed control devices to manage vehicle speed involves engineers, planners and designers to visit the site and make an assessment and judgment on where a roadside speed control device should be placed. This is usually based on the threshold of recorded accidents, site conditions such as the terrain, visibility and other site constraints and considerations. Considering that these practices can be subjective, time consuming and also costly, optimisation techniques undoubtedly seems to be a promising and suitable alternative way forward to achieve the requirements for vehicle speed management.
The motivation for this research is to develop a model using genetic algorithms and pattern search to optimise the location of speed camera to contribute to better management of vehicle speeds. The model will focus on the infrastructural aspects of roads and other related factors and it will exclude driver behaviour. This approach will serve as a useful planning tool for road safety professionals. It can be used to predict future accident prone areas and thus can help in the recommendation of appropriate corrective measures.
4 1.3 Research in Context
Against this background used in implementing speed control devices across England, the following questions will be addressed;
• Which infrastructural and related parameters excluding driver behaviour contribute to road traffic accidents?
• Which parameters influence the location of speed control devices (speed cameras and vehicle activated signs)?
• Taking into consideration the above two questions, can a model be developed using an optimisation technique to assist decision makers to effectively plan the deployment of speed control devices?
1.4 Research Aim
Based on the context presented, this research aims to contribute to speed reduction by developing a model to help decision makers determine the optimum location for a speed control device.
1.5 Research Objectives
To be able to achieve this aim the following objectives have been set.
i. Identify infrastructural and other related parameters excluding driver behaviour which have the ability to influence vehicle speed through a literature review.
ii. Identify methods used in facility location problems through a literature review.
iii. Based on parameters identified in (i) above, develop an accident prediction model using A-roads and test and validate the model.
iv. Using genetic algorithm and pattern search optimisation methods, identify the parameters to be used in the optimisation model and test the model on a selection of existing and future speed control device locations along A-roads.
5
2 Literature review
2.1 Introduction into the wider context of road safety issues
The world’s first motor cars were produced during the 1880s by a German engineer, Karl Benz with the aim of making travel faster and more enjoyable (PR Newswire, 2005). Human beings on the other hand have existed for centuries going about their daily activities. These activities sometimes require travelling which in recent times have involved the use of vehicles in one form or another. However, increased motorisation has not come without a cost to humanity resulting in many deaths and injuries from road traffic accidents.
Road traffic accidents continue to be a public health problem. About 16,000 people die each day from all types of injuries around the world. Injuries represent 12% of the global burden of disease (major diseases and injuries facing the world community) and are the third most important cause of overall mortality and the main cause of death among 1 to 40 year-olds (World Health Organisation, 2001). Road crashes dominate these injuries worldwide with about 25% of all injuries resulting in death being from road traffic accidents(Peden, McGee and Sharma, 2002).
At the inquest into the first recorded world road death in Britain in 1896 (that of Bridget Driscoll, RoadPeace, 2012) the coroner reportedly said ‘This must never happen again’. In the same year, the United States of America recorded its first road accident in New York when a motor vehicle collided with a pedal cycle rider (Kane, 1981). Into the twenty first century, many people are still killed and injured on roads all around the world. The total waste of human and societal resources resulting from road traffic accidents cannot be overemphasised. Worldwide, a conservative estimate of between 20 and 50 million people are injured or disabled each year in road traffic accidents (Murray and Lopez, 1996; Murray et al., 2001; Roberts, 2005). The wide-ranging estimate is largely due to the known underreporting of road traffic accidents. Road traffic accidents continue to be a global public health problem and indications are that this will continue to worsen unless urgent action is taken (Roberts, 2005). International organisations including the World Bank and the World Health Organisation (WHO) have all taken a keen interest in the road accident situation facing the world community.
6
In an effort to increase public awareness about this menace affecting communities, various initiatives have emerged over the years. The World Health Assembly in 1974 adopted Resolution WHA27.59 acknowledging road traffic accidents as a major public health problem requiring the coordinated efforts of member states (World Health Organisation, 1974). For the first time in the history of the World Health Organisation, World Health day 2004 was dedicated to road safety under the theme ‘road safety is no accident’. Also, the United Nations General Assembly in Resolution A/RES/60/5 (adopted in October 2006), called for member states and the international community to designate the third Sunday in November every year as the World Day of Remembrance for road traffic victims, in recognition of road traffic victims and their families’ loss and suffering (World Health Organisation,
2005). The latest campaign includes the years 2011 to 2020 being declared by the United Nations as the decade of action for road safety aimed at preventing five million road traffic deaths globally by 2020 (United Nations, 2012).
In 2002, road accident was ranked the tenth leading cause of death worldwide (Peden, McGee and Sharma, 2002). It is forecast that by the year 2020 road accidents would move up to third place in the table of leading causes of death and disability facing the world community (Murray and Lopez, 1996; Peden, McGee and Sharma, 2002; Kopits and Cropper, 2003; Peden et al., 2004) with speed being the main contributory factor in these accidents. Another publication (The World Bank, 2011) indicated that annual deaths from road traffic accidents are forecast to rise to 1.9 million by 2020 and it will be the leading health burden for children over five years old in developing countries by the year 2015. More recently, the 2013 WHO Global Status Report (World Health Organisation [WHO], 2013) on road safety also revealed that if no urgent action is taken by 2030 road traffic deaths will become the fifth leading cause of death. The report also mentioned speeding as a major road safety problem in all countries.
2.1.1 The origins of speed limits in the UK
UK road speed limits are used to define the maximum legal speed limit (it can vary) for road vehicles using public roads and are one of the ways used to control traffic speed (Safe Motoring, 2013). Speed limits are commonly displayed on nearby traffic signs or indicated by the presence of street lighting. Speed limits in miles per hour
7
are displayed on road signs or through the use of the national speed limit (NSL) symbol. The Locomotive Act of 1865 for speed limits in Britain restricted the speed of horse-less vehicles to 4mph in open country (towns and villages) and 2mph in towns. The act necessitated the use of three drivers for each vehicle with two travelling in the vehicle and one walking ahead of the vehicle carrying a red flag. On 28 January 1896, Walter Arnold of East Peckham, Kent (UK Motorists, 2014) became the first person to be successfully charged with speeding in Great Britain. The maximum speed limit was increased to 14mph and then to 20mph in 1903. 1930 saw the end of speed limits for cars and motorcycles. In 1934, a 30mph speed limit was introduced on roads in built-up areas (roads with street lighting) and this has stayed to this day (UK Motorists, 2014; Safe Motoring, 2013). The maximum speed limit on UK roads has been 70mph since 1965. This limit is applicable to unrestricted motorways and dual-carriageways and to cars (including car-derived vans) up to 2 tonnes maximum laden weight (MLW), motorcycles, buses, coaches and minibuses up to 12 metres long and goods vehicles with MLW of 7.5 tonnes. Single carriageways carry a speed limit of 60mph. In 1999 local authorities were given the power to introduce 20mph limits without the need to obtain permission from the Secretary of State. Speed limits have traditionally been enforced by the police using speed guns, automated in-vehicle systems (mobile cameras) and automated road side cameras (UK Motorists, 2014; Safe Motoring, 2013). Speed limits on motorways and trunk roads are set by the Highways Agency with the government giving advice to traffic authorities (County, District and Borough Councils, but not Parish Councils) on setting local speed limits. These authorities determine the most suitable speed limit for their roads which depend on local factors and conditions such as history of road accidents, traffic flows, road traffic combination, nature of adjacent development and road geometry (Safe Motoring, 2013).
2.1.2 History of speed cameras and vehicle activated signs
The Road Traffic Act 1991 enabled changes to be made to the law allowing courts to receive proof of speeding from type approved cameras. This had to be accompanied by a certificate signed on behalf of the relevant police force. It enabled safety cameras (speed and red traffic light cameras) to be managed by the police forces. In 1992, the first deployment of 21 fixed speed cameras and 12 red-light cameras was carried out in West London. This continued to increase and by the year 2000 an
8
estimated 4500 safety cameras had been deployed on British roads with most being fixed speed cameras and a smaller number being red-light and mobile cameras. One of the main impediments to the rapid implementation of safety cameras during the early years was that of resource. Benefits in the form of revenues received from speed camera fines were not received by the police forces instead it went to the Consolidated Fund of the Exchequer (Ward, 2003). In April 2000, a new system allowing fines from speed and red light cameras to pay for the costs associated with camera enforcement was piloted. The success from this trial allowed the government to continue with the system establishing the required legislation in Section 38 of the Vehicles (Crime) Act 2001. The Department for Transport in April 2007 changed the funding arrangements such that fines from cameras remained with the Treasury. It created a separate road safety fund for local safety partnerships to be used for a variety of road safety activities in addition to paying the cost or supplying and operating the cameras. In 2010, the new Coalition Government announced it will no longer fund new speed cameras demanding local authorities and the police to publish data about speed cameras, including accident and casualty figures amongst other requests (ROSPA, 2011).
In the late 1970s and early 1980s, the Transport Research Laboratory (TRL) conducted research on automatic signs that provided drivers with information relating to either following closely or excessive speed. The signs stayed unlit unless a driver exceeded a predetermined threshold which was associated with either the distance from the vehicle in front or the speed of the vehicle. Signs indicating to drivers to ‘MOVE APART’ were made using a back-lit message and it depended on an overhead infra-red detector to measure the separation of the close following vehicle from the vehicle in front. For signs indicating to drivers to ‘SLOW DOWN’ a message was created by means of a number of pinpoints of light singly provided through fibre-optic cables. Inductive loops hidden in the carriageway were used to measure the vehicle speed. Current generation of vehicle activated signs show a message (symbols and words) outlined by either fibre-optic cables (illuminated by quartz halogen lamps) or light emitting diodes (LEDs) placed on the front panel of the sign. The signs remain blank when not activated by a vehicle. The main types of signs used are either speed enforcing or warning (example, of a hazard) (Winnett and Wheeler, 2002).
9 2.1.3 Why do people speed
There are different views expressed about why people speed. Research (Corbett and Simon, 1999) has shown that though many drivers recognise the danger posed by high speed they think they are in control when they themselves drive fast and thus they will not be harmed. Others believe they are better than an average driver and less likely to get involved in an accident as a driver than as a passenger (Corbett and Simon, 1999). Drivers who believe they are better than an average driver also hold the view that they are less likely to have an accident in comparison to other drivers. They also believe the roads will be safer if others drove like them with fast drivers believing they are less likely to have an accident than slower drivers (Finn and Bragg, 1986; Corbett and Simon, 1999; Horswill and McKenna, 2005; Comte, Wardham and Whelan, 2000; Warner, Ozkan and Lajunen, 2010).
The reasons behind drivers speed have been grouped into five factors; inattention, thrill, time pressure, disdain of driving and ego gratification by a research study conducted by Gabany, Plummer and Grigg (1997). It is worth noting that the sample used in this study comprised college students with no other sample population to compare with. Ego gratification was highly regarded by males compared to females with younger people being more in favour of risk taking than older people. Time pressure, inattention and disdain of driving were mostly agreed upon by females. These factors were identified by the students as what they believed were the reasons for people exceeding the speed limit and not necessarily their reasons for exceeding the speed limit.
A review of some 40 studies showed a positive relationship between sensation seeking and risky driving (Jonah, 1997). Paradoxically some car manufacturers display speed as a key performance feature or a higher standard of sporting performance and it is of no surprise that the number of people watching the Formula One motor racing show keeps increasing. It was reported that the biggest innovation introduced to the Formula One racing in 2009 was derived from the KERS (Kinetic Energy Recovery System) technology for capturing and storing the car’s braking energy instead of wasting it as heat (The Economist, 2009) - the idea being that racing drivers will be able to make use of the energy stored to deliver quick bursts of speed for overtaking, making the sport more entertaining. During the 2010 FIA
10
Formula One World Championship the total global television audience was 527 million people in comparison to 516 million people in 2009 making it one of the most watched television sports programme and clearly showing the increasing thrill speed offers to people (Formula1, 2011).
Tranter and Warn (2008) investigated the relationship between interest levels in motor racing, speeding attitudes and speeding violations on public roads. Of about 5000 questionnaires distributed randomly to households in Queanbeyan, Australia a return yield of 524 was realised. The focus of the study was on mature drivers, aged above 25 years and had 2 or more years of driving experience. The final analysis sample obtained was 478 respondents with results revealing that the level of interest in motor racing is significantly related to speeding attitudes.
In another instance (Kanellaidis, Golias and Zarifopoulos, 1995) 207 fully completed questionnaires in the absence of an interviewer were obtained from a random choice of drivers. Male and female drivers aged 18 to 68 with driving experience ranging from 1 to 42 years and education ranging from elementary to university was represented in the study. The main reasons identified by respondents for speeding include being in a hurry, desire to show off to other people, underestimation of the risk of speeding and over estimation of driving abilities.
2.1.4 The contribution of speed to road accidents
Road accidents do not just happen but result from a number of factors. These factors have been grouped as Road user, Vehicle and Road environment (O’Flaherty et. al., 1997). Of these factors, the human element of the road user contributes to about 95 percent of road traffic accidents of which speed is a causative factor.
The road user factors are classed as impairment, errors in perception, skills deficiency, and execution manner. The road environment factors involve adverse road design, unexpected obstructions, deficiency in road furniture or markings and adverse environment. Vehicle factors involve those due to a deficiency in keeping up with regular maintenance of the vehicle by the user.
The likelihood of being involved in a road accident is linked to the vehicle speed (McKenna, 2005). Most studies have indicated a clear relationship between speed and road accidents with the severity increasing as speed increases – as a general rule,
11
it has been shown that there is a 5 percent increase in accidents resulting from a 1mile/h increase in average speed (McKenna, 2005; Taylor, Lynam and Baruya, 2000). At a given road it has been shown that crash rate increase as vehicle speed increases (Aarts and Schagen, 2006). This can possibly be further explained in relation to the common association between kinetic energy ‘K’, mass of the object ‘M’ and velocity or speed ‘v’ of the object given as K=1/2(Mv2). Assume the object in this case to be the vehicle. In any collision, kinetic energy is released due to the speeds involved and it can be argued that at high speeds the reaction time to environmental changes is reduced requiring greater stopping distance and thus leads to increased severity of a road accident.
Schemes with vertical speed deflection measures have recorded a 44 percent reduction in personal injury accidents whereas sites with safety cameras recorded a 22 percent reduction (Hirst, Mountain and Maher, 2005; Mountain, Hirst and Maher, 2005). Mean speeds, 85th percentile speeds and the percentage of vehicles exceeding the speed limit are normally reduced but the difficulty usually lies in reducing the speeds of drivers who continually speed (Hirst, Mountain and Maher, 2005; Hirst, Mountain and Maher, 2005). A 1km/h reduction in vehicle speed has also been shown to lead to a 3 percent reduction in accident risk meaning not only does speed contribute to the severity of road accidents but also to the risk of being involved in the actual accident (Finch et al., 1994). Hauer (1971) developed a relationship between observed accident involvement rates on rural highways for 100 million vehicle-miles travelled and varying travel speeds. The study showed the initial reduced probability of being involved in an accident with increasing travel speed. The lowest probability point was reached in a u-shaped curve but beyond the lowest point on the curve, any more increase in vehicle travel speed resulted in an increased rate of accident involvement.
Elvik, Christensen and Amundsen (2004) carried out a number of studies trying to understand and establish the relationship between speed and road traffic accidents. This has been known as the Power model which makes use of a meta-analysis to provide approximations of how changes in speed influence road accident and road users’ injury severity numbers using a power function. A power function is a mathematical equation or function relating two variables to each other by raising
12
values of one of the variables to a power in order to obtain values for the other variable (Elvik, Christensen and Amundsen, 2004). For example the relationship for fatal accidents was given as shown in equation 1 with an exponent of 4 proposed.
𝐹𝐹𝐹𝐹𝐹𝐹𝐹𝐹𝐹𝐹𝐹𝐹𝑎𝑎𝑎𝑎𝑎𝑎𝑎𝑎𝑎𝑎𝑎𝑎𝐹𝐹𝑎𝑎𝐹𝐹𝑎𝑎𝐹𝐹𝑎𝑎𝑎𝑎 𝐹𝐹𝐹𝐹𝐹𝐹𝐹𝐹𝐹𝐹𝐹𝐹𝑎𝑎𝑎𝑎𝑎𝑎𝑎𝑎𝑎𝑎𝑎𝑎𝐹𝐹𝑎𝑎𝑏𝑏𝑎𝑎𝑎𝑎𝑏𝑏𝑎𝑎𝑎𝑎 =
𝑆𝑆𝑆𝑆𝑎𝑎𝑎𝑎𝑎𝑎𝐹𝐹𝑎𝑎𝐹𝐹𝑎𝑎𝑎𝑎4 𝑆𝑆𝑆𝑆𝑎𝑎𝑎𝑎𝑎𝑎𝑏𝑏𝑎𝑎𝑎𝑎𝑏𝑏𝑎𝑎𝑎𝑎4
……….Equation 1
In an attempt to evaluate the validity of the Power Model some inconsistencies were found. This required the model to be reformulated such that the various levels of accident or injury severity did not overlap but instead treated as mutually exclusive categories. Despite the limitations associated with the study it was shown that a strong and consistent statistical relationship existed between speed and road safety such that an estimated 10 percent reduction in the mean speed of traffic results in a 37.8 reduction in the number of fatalities. Elvik (2009) later provided an updated analysis of the relationship between speed and road accidents. The findings differed from the original study with regards to first the exponents which were found to differ depending on the initial speed such that two new versions of the Power model were developed. One model applied to urban and residential areas and the other to rural roads and freeways. The second finding was that the exponents were adjusted with a tendency to become smaller over time indicating that the effects on speed also become smaller. Despite these findings one thing that stood out from all these studies was that speed is a very important risk factor in accident occurrence and the severity of injury sustained. A more recent study by Elvik (2013) attempted to reanalyse the Power Model by fitting exponential functions to data points. Changes in speed and accidents were sorted in groups of 10km/h depending on the initial speed. Even though the exponential function and the power function fitted the data almost equally well, a clear-cut distinction was found between the functions especially at high speeds. Generally, the analyses indicated a stronger support to the use of an exponential function than the power function with the exponential function indicating that the effect on accidents from a given relative change in speed is greatest when initial speed is highest. These studies showed (Elvik, Christensen and Amundsen, 2004; Elvik, 2009; Elvik, 2013)that speed plays a significant role in road traffic accidents.
13
2.1.5 The contribution of speed to pedestrian fatality
Pedestrians are identified as the most vulnerable road users in most countries globally with a relationship existing between vehicle speeds and their rate of involvement in accidents and injury outcome (Peden et al., 2004).
In UK, the 2010 road accidents report (Department for Transport, 2010) identified pedestrians as the most vulnerable road users accounting for 405 deaths, a reduction compared to the 2009 figure of 500. The problem of pedestrians being classed as vulnerable road users has for a long time been identified in literature. Ashton and Mackay (1979) set the scene and drew light on the relationship between vehicle speeds and pedestrian injuries. It was noted in the study that the speed distribution on impact from the front of a vehicle was dependent on the severities of the injuries sustained. Taking into consideration the design of cars in the 1970s, pedestrians hit at impact speeds less than 30km/h mainly sustained slight injuries with speeds above 30km/h mainly causing non-minor injuries. At speeds ranging from 50km/h to 60km/h injuries sustained varied from survivable to fatal. Figure 1 shows the cumulative impact speed distributions for pedestrians struck by the front of cars. For all casualties, the 50th percentile impact speed varied from 20 to 25km/h with non-minor injuries having the same percentile speed hovering around 35km/h. At the 90th percentile impact speed, all casualties record a speed of 40km/h, 50km/h for non-minor injuries and 65km/h for fatalities.
Figure 1 Cumulative impact speed distributions for pedestrians struck by the front of cars or car derivatives (Ashton and Mackay, 1979)
14
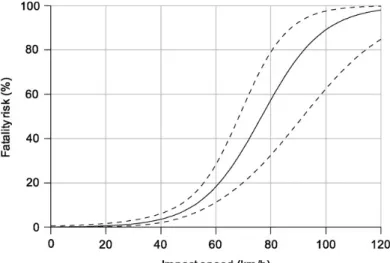
Some differences have been noted in other literature since the studies carried out by Ashton and Mackay (1979). Investigation by Rosén and Sander (2009) into pedestrian fatality risk as a function of car impact speed showed a much lower fatality risk than was generally shown in literature. This was explained to be a result of sample bias towards severe injury accident by earlier works. However a strong influence on impact speed was obtained since fatality risk at 50km/h was more than twice as high as the risk at 40km/h and more than five times higher than the risk at 30km/h. These results were obtained from a sample of 490 adult pedestrians aged 15 to 96 years. Adults were of particular interest in the study as there was the need to distinguish adult pedestrian fatality risk from child pedestrian fatality risk due to the anatomical and biomechanical differences observed in children and adults as reported by Tarriére (1995) (in Rosén and Sander (2009)). Figure 2 below shows the relationship between fatality risk and impact speed for adults with the dotted curve giving an indication of the 95th per cent confidence limits.
Figure 2 Fatality risk as a function of impact speed for adult pedestrians hit by the front of a passenger car (Rosén and Sander, 2009)
A review of published literature up to and including the year 2009 on pedestrian fatality risk as a function of car impact speed was carried out by Rosén, Stigson and Sander (2011). In all, 11 relevant literatures were identified. Consistently running through all the literature was the fact that fatality risk increased monotonically with the impact speed of the car but absolute risk estimates varied considerably. Another striking feature noted was that almost all the data sources used in studying pedestrian
15
fatality risk was made up of a higher percentage of fatalities in comparison to the corresponding national pedestrian statistics introducing a phenomenon of sample bias. Pre-2000 studies used direct analyses of data which had a huge bias towards severe and fatal injuries resulting in an overestimation of fatality risks. On the other hand it was noted that post-2000 studies made use of less biased data or adjusted for bias and though it revealed a steep increase of risk with impact speed the risks estimated were much lower than had been previously reported (Rosén, Stigson and Sander, 2011). Even though the level of pedestrian fatality risk as a function of car impact speed has been shown to be much lower than previously envisaged in the older literature, there is one common theme that runs through all these literatures being that a relation exists between pedestrian fatality risk and car impact speed. 2.1.6 The contribution of speed to car occupant fatality
In Great Britain, car occupants have remained the largest road user group in each casualty severity (Department for Transport, 2014) with cars making up 80 percent of traffic. In 2014, 45 percent of road deaths were car occupants rising by 1.5 percent in comparison with 2013. There was a 7.6 percent increase in the number of car occupant fatalities in 2014. In 2014, there was a 5.2 percent increase in the number of seriously injured car occupants in comparison with the 2013 figure.
In January 1983, the use of seat belts by front-seat occupants of cars and light vans came into operation in Britain (Mackay et al., 1992) with the law aimed at reducing the national casualty figures. Mackay et al., (1992), investigated 120 fatal cases in a five year study period of cars less than six years old where at least one of the occupants being in either the front or rear of the vehicle died. In this study 83 percent of front seat occupants who used seat belts died. Results from the study indicates intrusion as a result of structural mismatch from large trucks in frontal collisions and the very high energies involved in car to car frontal collisions. The seat belt was unrelated to the mechanism of injury in 80 percent of the cases. There was frequent occurrence of abdominal injuries in fatally injured drivers as compared with passengers. Fatal head/neck injuries dominate as a major cause of death. The sample was biased towards collisions resulting in occupant injury with the study focussing on fatally injured occupants.
16
Miltner and Salwender (1995), analysed 319 cases of seat belt restrained front seat car occupants (234 drivers and 85 passengers) from 241 vehicles involved in a car to car head on collision in Germany. The main factors contributing to occupant injury severity were the energy equivalent speed (EES) which represents the energy transfer in an accident, the change in velocity, the maximum deformation depth and the angle of collision. The results indicated fatal injuries to be expected in EES greater than 50km/h with no occupant remaining uninjured above 60km/h. The position of occupants affected only the severity of head injury with drivers being more severely injured than passengers. These are consistent with the findings of Mackay et al., (1992). Generally, results from the study show that the severity of injury at all body locations and the total injury severity of front seat occupants is primarily determined by the dynamics of the accident and passenger tolerance to mechanical loading. A mathematical model was developed by Buzeman, Viano and Lövsund (1998) to estimate average injury and fatality rates in frontal car-to-car crashes for changes in vehicle fleet mass, impact speed distribution and inherent vehicle protection. The results revealed a possible 27 to 35 percent improvement in frontal crashes as a result of a 10 percent increase in fatality risk parameters which reflects significant improvement in inherent vehicle protection. A 10 percent impact speed reduction was obtained from a 40 percent safety improvement. The effects of vehicle fleet mass were not strong but found to depend on the average mass ratio of the fleet. The study noted a reduction in mass range would be advantageous. With a uniform mass reduction of 20 percent, there would be a 5.4 percent increase in fatality rate. Impact speed reductions strongly improved traffic safety.
The EU Directive 96/79/EC (1996) makes provision for a high level of protection to belted occupants of motor vehicles in Europe in the event of a frontal impact by introducing frontal impact test requirements including biomechanical criteria. EuroNCAP (European New Car Assessment Programme) also plays a significant role in the impact performance of cars. The tests are based on those developed for legislation by the European Enhanced Vehicle safety Committee (EEVC) for frontal and side impact protection of occupants of cars and for the protection of pedestrians hit by the front of cars (EuroNCAP, 2004). Cars manufactured from the mid 1990s onwards have shown an overall reduction in car occupant injuries from national
17
accident data in Great Britain (Frampton, Page and Thomas, 2006). Frampton et al., (2002) analysed national car to car crashes occurring in 1997 and 1998 and used it to estimate changes in mean casualty rates between cars manufactured from 1988 to 1992 and 1993 to 1998. The use of only two years of data was to reduce the effects of any accident reduction measures. The outcome of the study showed a reduction in the casualty rate of newer cars with an 18 percent reduction in fatalities obtained. The killed/serious injury rate was reduced by as much as 15 percent. Taking into consideration that significant change to crash safety during the evaluation period was targeted at frontal crashes, it was assumed that the benefits obtained in injury reduction could have resulted from improved frontal crash protection.
Frampton, Page and Thomas (2006) used a stratified random sampling method based on injury severity to assess accident cases for investigation. The study aimed to investigate the scope for further fatality reduction using passive safety improvements in frontal crashes. The sampling considered crashes that involved towed cars less than 7 years old at the time of the accident in selected rural and urban roads in Great Britain. The Equivalent Test Speed (ETS) was used as the crash severity measure. ETS is computed on the assumption that deformation is caused by impacting a rigid barrier with the force directed through the centre of the crush area with the vehicle not being assumed to be brought to rest (Frampton, Page and Thomas, 2006). Results from the study showed no evidence in support of increasing crash test speeds. However, at least 27 percent of fatal drivers and 39 percent of all fatal front seat passengers have potential for survival given attention to older occupant’s chest injury tolerance and passenger compartment’s intrusion under 60km/h. When belted, fatally injured front seat occupants in frontal crashes with no significant overrun was considered an estimated survival potential for 49 percent of drivers and 60 percent of front seat passengers with improved passive safety was observed. The study suggests that targeting unbelted occupant protection could have additional benefit. Figure 3 shows the distribution of crash severity for fatally injured belted drivers with airbags. A median ETS of 50km/h with a 32 to 65km/h interquartile range obtained. Results from the study showed 78 percent of driver deaths were obtained with an ETS below 66km/h which is consistent with the EuroNCAP crash severity. With an ETS below 60km/h, the study revealed that 68 percent died (consistent with the crash severity
18
for EU Directive 96/79/EC). Evidence from the results obtained was not immense enough to require raising of frontal crash test speeds specifically with the added suggestion for ‘stiffening’ of vehicle structures. The sampling method used in the study gives a bias towards serious injury crashes due to about 80 percent of serious and fatal crashes are included with the investigation of all fatal crashes in the sample areas studied.
Figure 3 ETS Distribution for fatally injured belted drivers with airbags (N=41) (Frampton et al., 2006)
Frampton, Page and Thomas (2006) were able to show that frontal crash fatalities do not always arise from crash conditions that are extraordinary. Many of the frontal crash fatalities arise from crash severities that are well below those examined with crash tests and thus there is scope to improve protection for fatal injuries using passive safety.
2.1.7 Pedal cyclist as vulnerable road users
The vulnerable road user group which comprises pedestrians, pedal cyclists and motorcyclists are excessively represented in casualty numbers taking into consideration the distance travelled by these. Pedal cyclists present a noticeable difference in casualties. Even though pedal cyclists have a similar fatality rate to pedestrians in terms of deaths per billion miles travelled (around 35 to 38 deaths per billion miles travelled), their overall reported casualties is very different. Pedal cyclists record a close rate to motorcyclists for casualties of all severities at more
19
than 6, 500 casualties per billion passenger miles (Department for Transport, 2014). Pedestrians however have a rate of 2.110 casualties per billion miles walked. With the exception of 2012 to 2013, the number of seriously injured pedal cyclists has increased every year since a low figure of 2,174 was recorded in 2004. This shows a growing issue with pedal cyclists casualties. The development of countermeasures to prevent crashes with through bicyclists on priority roads crossing a minor road at non-signalised intersections within built up urban areas was identified (Schepers et al., 2011). Speed reduction measures for drivers leaving or entering the main road was identified as the most effective measure to improve the safety of cyclists. However red coloured pavement and other markings were found to decline the safety of cyclists.
Morris et al., (2013) assessed the impact of current and upcoming Intelligent Transportation Systems (ITS) applications on the safety and mobility of vulnerable road users. The majority of cyclist accidents were found to occur in urban areas on relatively low speed limit roads. Also most cycling accidents happened at junctions/intersections.
2.2 Factors influencing vehicle speed 2.2.1 Introduction
A number of factors come to play to influence a vehicle’s speed and for that matter a driver’s choice of speed on the road. Various researches have been carried out in an attempt to identify these factors. Figure 4 below summarises the findings of Wahlgren (1967)on the general groups of factors influencing vehicle speed.
In this chapter a literature review was carried out on each of the factors shown in Figure 4. Some of the studies carried out on these factors are quite dated but it is important to consider them in order to have a broader perspective of investigations carried out to date on various factors identified to affect speed. Taking into consideration the availability of data and the extent of influence of these factors on road traffic accidents, it is worth stating that some of the factors identified will not be included in the accident prediction model to be developed in chapter 5.
20
Figure 4 Factors influencing vehicle speed (Wahlgren, 1967)
In identifying the influence of risk on road traffic accident deaths, Smeed (1949) and Smeed (1972) derived a formula to calculate the number of road traffic accident deaths in a country (D) based on the number of licensed motor vehicles (N) and the population (P). The study was based on 1938 data for 20 countries and is given in equation 2 as
D = 0.003(NP2)1/3 ………Equation 2 This formula into road traffic accidents was basic and did not include other factors such as the road characteristics. After these initial works, other studies have evolved taking into consideration the influence of engineering, economics and policy on road traffic accidents. The use of laws is another tool applied in countries to contribute to road safety improvement.
Bjørnskau and Elvik (1992) used a game theory model to understand the relationship between road user behaviour and police enforcement on road safety. While some researchers focus on identifying what measures are effective at reducing road traffic accidents, others have tried to establish the causative factors and establish trends in road traffic accidents.
Vehicle Speed Road Conditions Driver Vehicle Traffic Conditions Road Environment Other Factors Curvature Gradient Roughness Sight Distance Width
21
Other researches have looked at using statistical or empirical approaches to make deductions about road accident causation seeking to unveil ‘myths’ about the mechanics of accident causation. In an attempt to explain the mechanism of road traffic accident causation, Elvik (2006) revealed some statistical regularities that determine the shape of the relationship between risk factors and accident occurrence referring to them as “laws of accident causation”. The laws proposed by Elvik (2006) are: ‘The universal law of learning’ which states that the accident rate per unit of exposure will decline as the amount of exposure increases. ‘The law of rare events’
states that the more rarely a certain risk factor is encountered the larger its effect on accident rate. ‘The law of complexity’ states that the more units of information per unit of time a road user must attend to, the higher becomes the probability that an error will be made and finally ‘The law of cognitive capacity’ which states that the more cognitive capacity approaches its limits, the higher the accident rate. Even though this study by Elvik (2006) does not provide a lot of empirical data to support his reasoning, it does provide some useful explanation to the reasons behind factors affecting road traffic accidents and it makes way for more statistical analysis to validate these laws.
In the development of the study by Elvik (2006), Davis and Swenson (2006) applied a causal model to three freeway rear-end collisions. This model compared what happened to what would have happened had the supposed cause been absent. One of the findings from this study revealed short following headways by the colliding drivers as probable causative factors in the collisions.
2.2.2 Road Conditions
2.2.2.1 Road curvature and infrastructure
Horizontal curves have an effect on road safety and especially on two lane rural roads due to increased speed of driving along these curves (Johnston, 1982; Bhatnagar, 1994). Increasing the degree of horizontal curvature increases the number of accidents (Haywood, 1980; Johnston, 1982; McDonald, 2004) with highways having single sharp curves in combination with long tangents and flat curves creating situations which are often hazardous. Radius of curves less than 600 metres have been found to be over represented in road accidents (Choueiri and Lamm, 1987; Johnston, 1982) with enough evidence also suggesting that horizontal curve radii less
22
than 400 metres contribute to road accidents. In the case of single vehicle accidents, there is a 34 percent increase in accident frequency per sharp curve per kilometre (McDonald, 2004). A sharp curve was defined as one marked with a chevron and/or curve warning sign. The definition given for sharp curve was vague but it did serve as a guide to the authors for assessing the data.
There is however some argument among researchers that operating speeds are affected by the characteristics of the preceding section of the road (McLean, 1979; McLean, 1981). Research has produced speed prediction models for individual curves with these models found to be simple and possess enough predictive power with R2 values ranging from 0.75 to 0.95 (McLean, 1981).
Among the other important parameters used in regression equations for predicting operating speeds on horizontal curves are degree of curvature, curve radius, length of curve, deflection angle, cross section and superelevation. Curve radius was a widely used parameter since it is considered the most important parameter in obtaining operating speeds along horizontal curves (Bennett, 1994; Abdul-Mawjoud and Sofia, 2008). Other studies have also shown that the 85th percentile speeds on horizontal curves can be predicted in combination with parameters such as curve radius, superelevation, deflection angle and length of curve (Kadiyali et al., 1981; Lamm and Choueiri, 1987; Krammes et al., 1995).
In another study based on passenger vehicles, there were 28 sites used to develop the speed prediction model and 20 other sites used to validate it for horizontal alignments of rural two lane highways in northern Iraq (Abdul-Mawjoud and Sofia, 2008). The regression models developed to predict the 85th percentile speed was also based on the geometry of the curves with the approach speed on the preceding tangent being based on various gradients. This study used 4 independent variables which were 85th percentile approach speed, radius, deflection angle and superelevation. With the application of data from 20 validation sites to the four individual equations developed for different ranges of gradient it was found that the mean absolute percent error in predicting the 85th percentile curve speed ranged from 7 to 9 percent indicating a reasonable degree of precision of the model.
23
The curvature change rate of single curves (CCRs) was identified to be highly successful at explaining the variability in operating speeds and accident rates (Lamm, Psarianos and Mailaender, 1999; Charlton and dePont, 2007) and it expresses CCRs in gon/km5 (gon is a measure of angle and there are 400 gon in a circle in comparison to 360 degrees or 2π radians). For multiple curves, a curve radii ratio was the measure employed and it was given as a ratio of the curve radius to the radius of the immediately preceding curve. Ratios greater than 0.8 had relatively minor effect on crash rate. For ratios less than 0.8 the crash rate increased as the ratio decreased and rose rapidly for values less than 0.2.
The road infrastructure as a parameter has been identified to impact on road traffic accidents. Shankar, Mannering and Barfield (1996) used a negative binomial model to establish the effect of weather and geometric parameters on road traffic accidents. The model suggests that effort should be taken to avoid steep grades and horizontal curves with low design speeds in areas with adverse weather. As an example the study revealed that removing all horizontal curves with design speed less than 96.5 kilometres per hour on a roadway section experiencing at least 5.1 cm of snowfall one or more days in a month can reduce the monthly accident frequency by 47.3%. Milton and Mannering (1998) used a negative binomial regression to isolate the effects of various highway geometric and traffic characteristics on annual accident frequency for the state of Washington, USA. Results from this study indicate accident frequency and exposure to accidents increase as the length of road section increases. Horizontal curves with more space between them had a tendency to increase accident frequency. An increase in horizontal curve radius decreases the number of accidents and smaller tangent lengths preceding a horizontal curve were found to lower the frequency of accidents. Also, road widths less than 3.5m were found to contribute to a reduction in accident frequency. Haynes et al. (2008) investigated the influence of road curvature on fatal crashes in New Zealand and found no evidence that frequently curved roads had more crashes than elsewhere supporting an earlier finding by Milton and Mannering (1998). The number of junctions per kilometre was found to have a negative association with crash rate and this was found to be strongly associated with urban settings. One of the limitations identified in the study by Haynes et al.(2008) was the small numbers of data (4058