Changes in access to health care in China, 1989 – 1997
JOHN S AKIN,1WILLIAM H DOW,2PETER M LANCE1AND CHUNG-PING A LOH11Department of Economics and 2Department of Health Policy and Administration, University of North Carolina at Chapel Hill, USA
The post-1979 period in China has seen the implementation of reforms that dismantled much of the Maoist era social welfare system and permitted a significant reallocation of society’s resources. The result has been rapid but uneven economic development that has profoundly altered the environment within which consumers make health investment decisions. Many studies report significant and apparently non-random reductions in health care utilization during this period. Scholars have tended to focus on the loss of insurance coverage and the growth of fees for services in explaining such reductions. An alternative explanation is growing inequality in access to care. This possibility has not received much research attention. As a result, our understanding of the patterns of changes in health care access, and of the types of populations that have been most adversely affected, has been rather limited.
This research examines the distribution of the changes in several indicators of access to health care across communities during the period 1989 to 1997. We find evidence of relatively uneven changes to these indicators. Money charges for routine services increased consistently, though this trend was less pronounced in lower-income communities. Most communities experienced reductions in travel distance to clinics but increases in distance to hospitals. There were major improvements to the quality of care in wealthier rural areas, but not in poorer villages. Wealthier villages experienced less improvement in waiting time and drug availability. These trends appear to be closely associated with changing economic circumstances during the reform era.
Key words:health, health care, access, equality, China
Introduction
Before the late 1970s, basic health services were readily available at low cost for most citizens in both rural and urban areas of China, as part of a wide-ranging social welfare system. However, profound reforms have steadily eroded that system. Additionally, deregulation and development altered substantially the distribution of resources within society. As the circumstances confronting consumers evolved, so did their behaviour. Many studies find significant and apparently non-random reductions in care utilization during the last two decades (Bloom and Gu 1997;Hesketh and Zhu 1997a;Gao et al. 2001). These changes have elicited a great deal of concern, particularly since reductions in utilization have often been the greatest for less advantaged groups.
Changing patterns of utilization can be attributed to many factors, including the loss of state-provided health insurance and the possibility of growing inequality of access to quality care. While the former possibility has received substantial attention (e.g. Akin et al. 2004), the latter has been less thoroughly examined. As a result, we do not have a meaningful sense of its importance. This is an important gap in our understanding of the implications of the reform era for care utilization (and, hence, the ultimate health) of the populace. The dramatic overall economic development and institutional changes have occurred unevenly across China’s communities. For instance, Akin et al. (2004) report differences in changes to health insurance coverage across
communities during the 1990s. However, an informed policy response to non-random reductions in utilization also requires a clearer understanding of the distribution of changes inaccess
to care.
This paper begins to address this gap by considering the distribution of changes in access to care across communities. Our concern is whether certain populations (such as the poor or rural residents) thought to have benefited less from the reform era were also particularly adversely affected by changes in access to care. To examine this, we utilize the 1989 and 1997 waves of the China Health and Nutrition Survey, a rich, longitudinal micro-level survey of Chinese households and their communities. Our data can provide insight into changes during the second decade of the reform era, a period of time for which our understanding of the health care system is particularly patchy (partly because the change was more subtle compared with the more institutionally obvious upheavals of the first decade). We are thus in a position to examine the changes that occurred in a more recent, but also murky, period in terms of the evolution of the health care system. The indicators of access to health care that we consider include distance to closest health facility, service price, time spent waiting to be treated, staff qualifications and drug availability.
The remainder of this paper is organized as follows. The next section provides the social and policy background for three
aspects of health service access – price and facility placement, drug availability and staff availability. The methods section describes the data and general patterns of change. This is followed by the results from multivariate statistical analysis. The final section concludes.
Background
Health care prices and facility placement
Perhaps the most important structural change to the health care market after the late 1970s was the decentralization of public health services, which left provincial and county governments responsible for providing health care to their people. Thus, most of the financial burden now falls on these levels of government and on individual facilities. However, most local governments can only afford basic salaries for health staff. Thus, they have inevitably come to develop a heavy reliance on user fees to finance a large proportion of service delivery (Bloom and Gu 1997).
In an attempt to make care equally accessible to rich and poor, health care prices have been set below actual cost since the 1970s. Central Price Commissions unilaterally set prices until the mid-1980s, after which local authorities were allowed to negotiate. Although local authorities’ financial concerns have been given some consideration, prices for most services are still far below the level at which costs would be fully recovered (Hsiao 1995; Hesketh and Zhu 1997a; Liu et al. 2000). Liu et al. (2000) compare the regulated fees with average costs for 130 frequently utilized health service items in Shandong province in 1994, and find that the fee for 125 of them was set below cost (most of the exceptions are high-tech service items). Roughly 70% had cost recovery rates below 50%.
However, price regulations are frequently violated. The Ministry of Health regularly reminds local authorities to reinforce self-policing on both overcharging and double-charging by unbundling.1Liu et al. (2000)found that hospitals charge more than actual cost for many services. However, very little is known about which regions and income groups experienced the most significant unofficial price increases. One might speculate that the wealthy, with their greater financial capacity to pay for care, had experienced larger price increases. However, the very fact that so much of the variation in fees had been unofficial has made it difficult to draw any concrete conclusions.
At the same time, smaller price increases (or even decreases) in poorer communities (if they did occur) might result in significant reductions to the quality of care, as facilities with a better capacity to self-finance are able to bid skilled personnel and even equipment away from others, while those confronted with a more meagre revenue base either cut quality or close altogether. Clearly the latter possibility suggests that physical access to care, in terms of the distance travelled to receive treatment, may also be changing as well. As health care resources are attracted to more lucrative markets, the number of facilities in poorer areas may well have been falling. Alternatively, if a facility exits a market, this might result in
the entry of another type of facility. For instance, it could be that a market is not lucrative enough to support the sort of high cost care that hospitals offer, but a hospital’s departure might create scope for more clinics offering lower quality, but also lower cost, care. Thus, the effect of the changes described above on distance might be complex, and depend on the facility strata under consideration. Finally, it is also true that the reform era involved a certain degree of administrative consolidation to reduce public expenditures. This has often been accompanied by consolidation of service provision, including the merging of previously distinct facilities. This may also have generated variation in distance to care.
Drug availability
Under current financial arrangements, hospitals have to recover revenue from alternative sources in order to make a profit (or even survive). Since Western drugs can be marked up by up to 15% (and Chinese drugs by 25%), sales of these drugs have become an important source of extra income (Hsiao 1995). This has had conflicting implications for the quality of care: hospitals and physicians have been given incentives to sell more drugs, but there is a related tendency toward over-prescription. On the other hand, a stable drug supply is often related to a higher quality of care (e.g.Litvack and Bodart 1993; Chawla and Ellis 2000). The financial incentive does motivate sufficient supply of critical medicines. More clinics now provide needed medicine and more hospitals have their own pharmacies and relatively stable drug supplies. However, given the revenue incentives behind these changes, it is not clear that poorer communities have shared equally in improvements to drug availability. Given the likely associ-ation between drug availability and the quality of care, it is possible that poorer communities have not benefited substan-tially from these developments, even as it seems likely that their quality of care may have eroded in other respects.
Staffing of health care facilities
Since relaxation of regulations on the salaries of health staff, individual facilities have motivated physicians by linking pay to performance. This has contributed to an exodus of physicians from low-revenue rural areas to high-revenue urban ones, as financed facilities have attracted better-trained physicians by offering more attractive compensation packages. Many facilities with poor revenue-generating potential collapsed, leaving their clientele with less access to care. Meanwhile, rich areas have developed an enhanced capacity to train more physicians as well as to attract more highly skilled physicians. These trends may have contributed to a worsening of staffing disparities between communities (Bloom 1997;Bloom and Gu 1997).
Methods
DataOur data are drawn from the 1989 and 1997 panels of the China Health and Nutrition Survey (CHNS), a unique, longitudinal micro-level study that contains household, community and health/family planning facility surveys in
nine Chinese provinces. The 1989 panel was the first gathered, while the 1997 panel is the most recent one in the public domain. The basic sampling scheme and definitions of CHNS communities were established in 1989. A multi-stage, random cluster process was used to draw the sample surveyed in each of the provinces. Counties in the nine provinces were stratified by income (low, middle and high) and a weighted sampling scheme was used to randomly select four counties in each province. The provincial capital and a lower income city were also selected. Villages and townships within counties and urban and suburban neighbourhoods within cities were selected randomly. The 190 primary sampling units consisted of 32 urban and 30 suburban neighbourhoods, 32 towns and 96 villages. It is important to recognize that neither the CHNS sampling scheme nor our sampling of CHNS communities (described below) yields a nationally representative sample. (For instance, the CHNS scheme effectively over-represented urban areas.)
Our sample contains 155 communities surveyed in both 1989 and 1997. The geographic distribution of these communities is provided in Table 1. There are 22 communities located in cities, 24 in suburban areas, 25 in towns and 84 in rural villages. The communities are evenly distributed in seven provinces – Jiangsu, Shandong, Henan, Hubei, Hunan, Guangxi and Guizhou – with slightly fewer from Jiangsu and Guizhou. The rural villages are further separated into richer (35) and poorer ones (49). We categorize communities as poor or rich if the average income for the community falls short of or exceeds, respectively, the overall average income for the sample.2Although these are expansive definitions, our results are essentially robust to the introduction of much stricter definitions, such as designating the villages with average incomes in the highest and lowest quartile (among
communities) as rich and poor, respectively. InTable 2, we provide a transition matrix that illustrates some of the economic dynamism of our sample. What the table illustrates is a pattern noted by numerous observers: regionally uneven development. Some communities have benefited tremen-dously from the opportunities created by the ongoing reforms, while others have suffered from other concurring changes (such as the retrenchment of state industries).
Access measures
The access measures we examine include distance to closest health facility, service charges, time spent waiting to be seen by a health professional, whether treatment is provided by a doctor trained in Western medicine (later referred to as a Western doctor), and whether basic medicine is available in the facility. For this analysis, we construct two basic strata of facilities, clinics and hospitals. Clinic includes village health (including rural health posts), neighbourhood, work unit, woman and child health, and private clinics, while hospital encompasses township, county, street/community, work unit, district, city, army, university affiliated, provincial, specialty and private hospitals.3
Distance to facility is based on the distance from the centre of the community to the closest health facility reported in the community survey. We do not attempt any imputation for missing values for distance. Service charges and waiting time are based on community medians4of facilities that surveyed households in the communities report as actual care alternatives, while the Western doctor and medicine avail-ability values are community means.5These four variables are constructed from household reports of facility characteristics, rather than from independent interviews of the facilities themselves. As such, these measures in some sense reflect more of a demand-side perception, rather than a supply-side measurement of local health care market conditions. For instance, access measures are averages weighted by the number of times households refer to each facility, rather than the actual distribution of facilities themselves. These measures might even provide a more accurate picture of local market conditions. For example, households may report more accurate fee information than would facilities, which may be doing a poor job of the sort of self-policing demanded by the Ministry of Health.6We assume that missing price and quality values can be reasonably represented by the mean value in communities from the same province and of the same urbanicity because of the similarity in their competitive environment. Thus, missing values for these measures are Table 1. Summary statistics and variable description (n¼310)
Variable Mean Variable description city 0.142 Equals 1 if located in a city suburb 0.155 Equals 1 if in a suburban area town 0.161 Equals 1 if in a town rich_village 0.226 Equals 1 if in a poorer village poor_village 0.316 Equals 1 if in a richer village Jiangsu 0.116 Equals 1 if in Jiangsu province Shandong 0.148 Equals 1 if in Shandong province Henan 0.155 Equals 1 if in Henan province Hubei 0.148 Equals 1 if in Hubei province Hunan 0.155 Equals 1 if in Hunan province Guangxi 0.148 Equals 1 if in Guangxi province Guizhou 0.129 Equals 1 if in Guizhou province year97 0.500 Equals 1 if in year 1997 suburb97 0.077 suburbpyear97
town97 0.081 townpyear97
rich_village97 0.113 rich_villagepyear97 poor_village97 0.158 poor_villagepyear97 Jiangsu97 0.058 Jiangsupyear97 Shandong97 0.074 Shandongpyear97
Henan97 0.077 Henanpyear97
Hubei97 0.074 Hubeipyear97 Hunan97 0.077 Hunanpyear97 Guangxi97 0.074 Guangxipyear97
Table 2. Transition matrix 2: over-the-years quartiles
1989 Village type 1997 Village type Total Poorest Middle Richest
Poorest 18 19 4 42
Middle 7 26 5 38
Richest 0 2 3 5
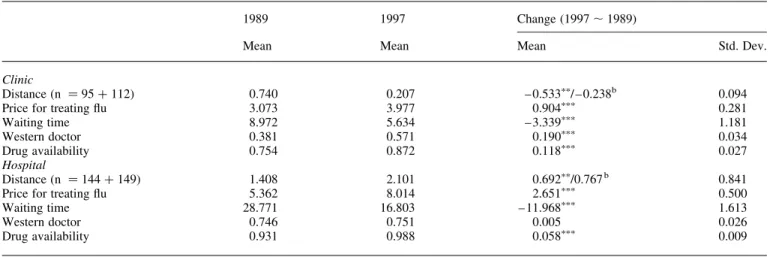
imputed with urban or rural level medians7for each province. Table 3reports summary statistics for these access measures and their overall changes over time, and Figure 1 further compares the change in each access measure across commu-nity strata.
During the 8 years from 1989 to 1997, distance to the closest clinic decreased on average by a small amount (about 0.5 km). However, this change was not felt evenly across community strata. The largest decreases occurred in poorer villages, bringing the average minimum distance down to a level similar to those seen in the richer villages, closing some of the gap between rich and poor communities. Meanwhile, distance to the closest hospital increased by 0.7 km. The increase was substantial in the suburban areas and modest in cities and poorer villages. Overall, the trends in changes in access to health facilities seem to have been particularly favourable to the poorest populations.
Charges for treatment of illness (flu in this study8) increased by 29% in clinics and 49% in hospitals. This may seem large but is not altogether surprising given the dynamism of the overall environment. China’s GDP per capita grew from 1855 yuan in 1990 to 3666 yuan (at 1990 prices) in 1998 (source: Statistics Division, United Nations Economic and Social Commission for Asia and the Pacific). It is also not surprising to see the largest increases in cities, where income per capita soared.
Waiting time fell from an average of 9 minutes to only 6.1 minutes in clinics, and from 29.4 minutes to 17.8 minutes in hospitals. The reductions in waiting times are significant and are observed across all community strata. In 1989, the main service deliverers in hospitals were Western doctors; the likelihood of being seen by one was about 75%. This figure was twice that of clinics, where village doctors were most prevalent. However, the gap narrowed over the years. By 1997, the probability of being seen by a Western doctor in a
clinic increased by almost 20%, while it was generally stable in hospitals. Richer villages seem to have experienced significant improvements in staff qualification in hospitals, while all other strata experienced slight declines.
Most hospitals were able to provide needed medicine to patients by 1989. Almost 99% of the hospitals did so by 1997. But only 75% of clinics were able to supply needed medicine in 1989. By 1997 this figure had improved to 87%.
The focus of this paper is the distribution of changes in facility access, price and quality of health care across communities.
Figure 1illustrates the distribution of access changes across community strata, but it is not clear that the pattern is statistically significant. It is also unclear whether the pattern will remain once administrative region is controlled for, because economic development has been so geographically uneven. In order to avoid confounding community location and strata with changes in access, a multivariate analysis is needed. Since our access measures are continuous, we can apply straightforward linear regressions. For the availability of Western doctors and medicine, we estimate linear probability models. The right-hand-side explanatory variables include community type, province, year dummy, community-year interactions and province-year interactions. Thus, for health care access outcome ACCESSitwhere i is community and t is time, we estimate
ACCESSit¼b0þb0_1997p1997iþ(1997ipb1_1997þ(1 – 1997i)pb1_1989)px1itþ(1997ipb2_1997þ(1 – 1997i)pb2_1989) px2itþ…þ(1997ipbJ_1997þ(1 – 1997i)pbJ_1989)pxJitþ1it where 1997iequals 1 if the community observation is drawn from 1997 and 0 otherwise and there are J explanatory variables (geographic and socioeconomic characteristics of the community). This specification permits examination of the degree to which changes in access to care were distributed across different types of communities. We report robust
Table 3. Change in access to health care between 1989 and 1997 in China (n¼310)a
1989 1997 Change (1997,1989)
Mean Mean Mean Std. Dev.
Clinic
Distance (n ¼95þ112) 0.740 0.207 – 0.533pp/ – 0.238b 0.094 Price for treating flu 3.073 3.977 0.904ppp 0.281 Waiting time 8.972 5.634 – 3.339ppp 1.181 Western doctor 0.381 0.571 0.190ppp 0.034 Drug availability 0.754 0.872 0.118ppp 0.027 Hospital Distance (n ¼144þ149) 1.408 2.101 0.692pp/0.767b 0.841 Price for treating flu 5.362 8.014 2.651ppp 0.500 Waiting time 28.771 16.803 – 11.968ppp 1.613
Western doctor 0.746 0.751 0.005 0.026
Drug availability 0.931 0.988 0.058ppp 0.009
pp
significant at 5%;pppsignificant at 1%.
aDistance is measured in kilometres, price in yuan, waiting time in minutes and Western doctor and drug availability in proportion/percentage. bAverage change for the unbalanced panel.
standard errors that are adjusted for clustering at the community level.
Results
The results of the regression analyses for clinic and hospital services are reported in Tables 4 and 5, respectively. Throughout the regressions, Guizhou is the omitted province, city is the omitted stratum and 1989 is the omitted year.
Distance
During the 8-year period from 1989 to 1997 most communities witnessed significant reductions in distance to clinic level facilities (with a baseline reduction of 2.5 km). The access improvement may seem to have been unequal across strata (particularly in favour of villages) but the difference is not statistically significant. The lack of statistical significance may be due to the substantial number of missing values in the community survey from which we obtain distance measures. Although they enjoyed closer access to clinic level facilities in 1989, communities in wealthier provinces (such as Jiangsu and Hunan) experienced less improvement over the years. The average distance to the closest hospital has generally increased. The change is not significantly different across strata, although the average distance seems to have increased more in suburban and urban communities. In contrast to poorer Guizhou province, Jiangsu, Shandong, Henan and Guangxi all experienced smaller increases in distance.
Price
From our results for changes in clinic price, it would seem that increases in clinic service prices over the 8-year period closely followed the patterns of economic development. The associ-ation appears to be strong at both the province and community levels. Jiangsu, one of the highest CHNS provinces in terms of GNP per capita, experienced significantly greater price increases. The average price increase in Jiangsu was approximately 4.6 yuan more than that in the baseline province (Guizhou). For the other provinces the price change was not significantly different, but it is noteworthy that the magnitudes of these changes are in the same order from high to low as the GNP per capita for provinces.
In 1989, villages faced significantly lower prices for clinic services than other economically better-developed areas. Villages continued to benefit from even lower real prices for clinic services over the years: the price fell by 1.3 yuan (after compensating for the baseline increase of 2.1 yuan) for poorer villages and by 0.8 yuan for the richer villages. Townships have also seen average service price fall by 0.5 yuan. Suburban communities experienced greater price increases than those in urban areas, but the difference is not significant. Overall, the average service price at clinics seems to have changed over time in favour of communities with lower levels of economic development.
This basic pattern also emerges for changes to the price of hospital care. In both Jiangsu and Hubei (another province in relatively good economic condition) the service price
Table 4. Access to clinic care between 1989 and 1997 in China
Clinic (1) (2) (3) (4) (5)
Distance Price Waiting time Western doctor Drug availability suburb 0.626 (0.844) 0.079 (0.579) 4.259 (5.217) – 0.124 (0.092) – 0.000 (0.070) town – 0.512 (0.895) – 0.426 (0.640) – 1.466 (2.294) – 0.253ppp (0.088) 0.110 (0.074) rich_village 1.004 (0.866) – 0.813p(0.483) – 0.083 (2.166) – 0.319ppp(0.075) 0.120pp(0.059) poor_village 0.976 (0.926) – 0.919p(0.466) – 1.617 (2.862) – 0.351ppp(0.075) 0.014 (0.060) suburb97 – 0.711 (0.836) 0.130 (2.283) – 6.775 (5.519) 0.124 (0.122) 0.008 (0.093) town97 0.517 (0.879) – 2.562pp(1.236) – 1.994 (2.900) 0.332ppp(0.120) – 0.089 (0.098) rich_village97 – 0.844 (0.869) – 2.877pp (1.112) – 3.932 (2.712) 0.280pp (0.112) – 0.105 (0.073) poor_village97 – 0.816 (0.908) – 3.384ppp(0.944) – 2.959 (3.166) 0.172 (0.104) – 0.002 (0.076) Jiangsu – 3.512ppp(1.048) – 0.119 (0.749) – 5.195 (6.143) – 0.503ppp(0.095) – 0.017 (0.057) Shandong – 2.959ppp(1.052) – 0.259 (0.635) – 7.855 (6.209) – 0.248pp(0.109) – 0.361ppp(0.093) Henan – 3.196ppp (1.028) – 1.109p (0.587) – 8.415 (6.234) – 0.317ppp (0.096) – 0.050 (0.064) Hubei – 3.034ppp (0.999) 0.722 (0.775) – 2.247 (6.286) 0.012 (0.112) – 0.136pp (0.061) Hunan – 3.321ppp(1.067) 1.012 (0.766) – 0.785 (7.562) – 0.013 (0.113) – 0.033 (0.073) Guangxi – 3.270ppp(1.036) – 0.908 (0.618) – 1.537 (6.812) – 0.125 (0.104) – 0.119p(0.060) Jiangsu97 3.437ppp(1.020) 4.629pp(1.808) 7.248 (6.330) 0.271pp(0.126) 0.045 (0.060) Shandong97 2.722ppp(1.009) 1.325 (1.182) 8.716 (6.398) 0.097 (0.140) 0.172 (0.117) Henan97 3.017ppp (0.985) 0.054 (0.907) 7.278 (6.448) 0.298ppp (0.108) – 0.019 (0.060) Hubei97 2.876ppp(0.953) 3.194 (2.015) 4.787 (6.719) – 0.017 (0.117) 0.019 (0.085) Hunan97 3.425ppp(1.031) 0.807 (1.117) 4.735 (7.675) – 0.024 (0.119) – 0.045 (0.099) Guangxi97 3.423ppp(1.018) 0.228 (0.916) 5.565 (6.944) 0.106 (0.116) 0.076 (0.071) year97 – 2.531pp(1.049) 2.100p(1.196) – 5.676 (6.133) – 0.102 (0.118) 0.121p(0.071) Constant 2.723pp (1.086) 3.699ppp (0.653) 12.834pp (5.811) 0.787ppp (0.101) 0.811ppp (0.063) Observations 207 310 310 310 310 R-squared 0.341 0.280 0.105 0.315 0.207
Note: Robust standard errors in parentheses.
increased by an additional 5 yuan on top of the baseline increase of 6.5 yuan. The difference in the change in hospital service price is quite significant across community strata during the 8-year period. The largest increase appeared in communities in cities and suburban areas, while smaller increases occurred in economically less-developed commu-nities such as towns and villages. The price increase in poor villages is 6.5 yuan less than that in cities in the same province. These results suggest that the clinic and hospital service prices have been fairly stable for economically disadvantaged communities.
Waiting time and staff quality
Waiting time is often driven in large part by staffing conditions in health facilities. In a relatively understaffed clinic or hospital, a patient usually has to spend more time waiting to be seen. Waiting time often can be reduced at the expense of the quality of care, if health facilities enhance staff levels at the cost of quality. Because of this likely tradeoff in terms of quantity and quality, a joint analysis of changes in waiting times and in staff quality (in terms of the degree of training of the care performer) would be more appropriate than separate examination of the results on waiting time and staff quality. It is important to emphasize that in the Chinese cultural setting, doctors trained in the Western medical tradition are not necessarily regarded as superior or preferred to those trained in traditional Chinese medicine. Depending upon the
preferences of the patient and their health concerns, there are circumstances under which either type of care-giver might be preferred. It is common that large-scale facilities employ both types of physicians, although Western doctors typically outnumber Chinese doctors (Hesketh and Zhu 1997b). In our sample, we find a rather small representation of Chinese-style doctors in both clinics (0.04 – 0.07) and hospitals (0.08 – 0.07) over the years. Therefore, we will focus on Western medicine doctors in our analysis of staff quality.9
For clinics, the coefficients suggest that the average waiting time has generally been reduced and the change seems to favour communities in economically well-developed strata and provinces. However, none of the coefficients is sufficiently statistically significant to permit strong conclusions to be drawn. Staffing quality has a very different pattern. In 1989, the average probability of being seen by Western doctors was 0.54 (¼0.79 – 0.25) for towns, 0.47 (¼0.79 – 0.32) for richer villages, and 0.44 (¼0.79 – 0.35) for poorer villages. Over the years, the probability for towns increased by 0.33 and surpassed the average probability for cities by 1997. The probability in richer villages also increased by 0.28 during the same period of time. Poorer villages did not experience similar improvement.
People in Jiangsu and Henan provinces had significantly lower probabilities of being seen by Western doctors in clinics in 1989, but the probabilities significantly improved over the years (by 0.27 and 0.30, respectively). Given no significant Table 5. Access to hospital care between 1989 and 1997 in China
Hospital (1) (2) (3) (4) (5)
Distance Price Waiting time Western doctor Drug availability suburb 0.790ppp (0.255) 0.349 (0.929) – 2.818 (5.267) – 0.017 (0.054) – 0.022 (0.038) town 0.218 (0.283) – 1.053 (0.734) – 7.293 (5.250) – 0.045 (0.055) 0.021 (0.029) rich_village 1.728ppp(0.411) – 0.940 (0.916) – 8.182 (4.993) – 0.161ppp(0.058) 0.043p(0.024) poor_village 1.724ppp(0.340) – 2.138ppp(0.703) – 15.359ppp(4.057) – 0.085 (0.053) – 0.028 (0.028) suburb97 2.584 (2.706) – 0.445 (2.987) 6.140 (6.017) 0.006 (0.069) 0.025 (0.038) town97 – 0.726 (0.519) – 5.338pp (2.166) – 4.485 (5.897) – 0.054 (0.084) – 0.027 (0.025) rich_village97 – 0.358 (0.544) – 6.245ppp (1.898) – 3.547 (5.659) 0.151pp (0.072) – 0.041p (0.024) poor_village97 – 0.252 (0.478) – 6.465ppp(1.791) 2.671 (4.632) 0.003 (0.066) 0.038 (0.027) Jiangsu 0.547 (0.372) 3.198ppp(1.050) 15.236ppp(5.331) – 0.054 (0.079) 0.034p(0.018) Shandong 0.536 (0.446) 4.709ppp(0.910) 3.883 (4.911) – 0.077 (0.072) – 0.034 (0.029) Henan 1.932ppp (0.504) – 0.291 (0.556) – 2.627 (4.106) 0.003 (0.056) 0.003 (0.025) Hubei 0.393 (0.362) 2.131ppp (0.546) 8.021 (5.191) 0.161ppp (0.047) 0.010 (0.028) Hunan 0.037 (0.359) 1.752ppp(0.598) 8.680 (5.681) 0.154ppp(0.048) – 0.061p(0.032) Guangxi 0.488 (0.407) 0.323 (0.534) 17.356ppp(5.589) 0.110pp(0.045) – 0.013 (0.028) Jiangsu97 – 1.136p(0.640) 4.886ppp(1.826) – 4.969 (5.697) – 0.006 (0.094) – 0.031p(0.019) Shandong97 – 1.175p (0.701) – 1.566 (2.023) 3.384 (5.377) 0.025 (0.100) 0.029 (0.029) Henan97 – 1.252p (0.637) – 0.859 (1.234) 7.849p (4.315) – 0.041 (0.071) – 0.015 (0.026) Hubei97 1.773 (2.401) 4.877p(2.684) – 2.376 (5.420) – 0.174pp(0.077) – 0.035 (0.029) Hunan97 – 1.094 (0.703) 1.026 (1.348) – 0.242 (6.254) – 0.282ppp(0.095) 0.048 (0.029) Guangxi97 – 1.374pp(0.617) – 1.516 (1.255) – 11.733pp(5.655) – 0.173ppp(0.066) 0.014 (0.029) year97 1.199p (0.689) 6.477ppp (1.960) – 11.248pp (5.143) 0.076 (0.069) 0.053pp (0.026) Constant – 0.298 (0.299) 4.706ppp (0.693) 30.038ppp (4.939) 0.773ppp (0.055) 0.940ppp (0.026) Observations 293 310 310 310 310 R-squared 0.123 0.411 0.365 0.148 0.248
Note: Robust standard errors in parentheses.
p
change in waiting time, these increases in the probability of a Western doctor being the care-giver suggest real quality improvements in the clinics of these provinces.
For hospital services, we find a significant reduction of 11 minutes from average waiting time at the baseline. Compared with the baseline, the reduction in average waiting time is significantly smaller in Henan province (about 7.8 minutes less than that seen by communities in Guizhou province) and significantly larger in Guangxi province (about 12 minutes longer). In 1989, Guangxi was among the two provinces that had the longest waiting time in the CHNS sample (the other was Jiangsu), so the huge reduction has helped to close the gap between Guangxi and other provinces. The shorter waiting time in Guangxi came with a compromise in staff qualifications: patients in this province were 17% less likely to be treated by Western doctors in 1997 than they had been in 1989. Hubei and Hunan, for which average waiting time did not change much, experienced declines of 17 and 28%, respectively, in the probabilities that patients were treated by Western doctors. None of the community strata experienced a significantly different reduction in waiting time at hospitals, but residents of richer villages experienced an increase (by 15%) in the likelihood of receiving treatment from Western doctors. Overall, we find that between 1989 and 1997 staff qualification improved in clinics but deteriorated in hospitals. The quality of care delivered in both types of facility seems to have increased significantly in richer villages but insignificantly or to a lesser degree in poorer ones. This may suggest inter-regional flows of well-trained staff. Richer villages have grown significantly better off over the years, with both reduced waiting time and better-trained staff.
Drug availability
Average drug availability in clinics increased by 12% over the 8-year period. It is of note that we find no evidence that improvements to drug availability were any different for different provinces and community strata. There are a number of explanations for such equal increases. It may be that most clinics provide the same basic services, so that improvements to the availability of medicine were rather uniform nation-wide. It is also likely that the scales at which most clinics operate do not allow them to run their own pharmacies to attract revenue from drug selling, effectively precluding the possibility that wealthier regions might have experienced soaring improvement in drug supply.
In terms of the average availability of basic medicine in hospitals, communities in richer villages seem to have experienced significantly less increase than those in other strata. Communities in Jiangsu province experienced the least increase, possibly because they started off in a much better absolute position.
Conclusion
Decentralization of public health services in China set in motion a number of long-term changes that greatly affected
the health care market. The ramifications of these changes will likely be felt for decades to come. The changes that seem particularly important in this regard include drastic reductions in central government funding of health services, greater reliance on local government support and user fees as the main cost-recovery mechanism, and a loosening of restrictions on health care workers’ location and remuneration.
In many respects, economic conditions in China have evolved in such a fashion that it would be reasonable to expect the net effect on the health system not to have been, on balance, positive. For instance, steadily worsening deficits contribute to the tendency of local governments to provide little support beyond base salary for health workers. Regional disparities in economic development have effec-tively conspired to eliminate many health facilities in poorer areas, because they were unable to charge user fees to raise the funds needed to compete with the physician compen-sation packages offered by facilities in wealthier markets. To be sure, health facilities in richer areas have also had to contend with limitations to the revenues generated from official user fees. However, in many cases they compensated by violating central price regulations, performing unnecess-ary and expensive high-tech procedures, and/or over-prescribing medication.
This paper greatly extends the rather sparse literature tracking changes in access to care. First, it considers many more dimensions of access than earlier work (e.g.Ministry of Health, PRC 1993,1998). Most of the existing examinations of changing access to care focus on distance (or sometimes price), whereas this paper considers a wide range of facility attributes that can conceivably play a role in shaping utilization patterns. Secondly, our work involves multivariate analysis of changing access to care using a detailed longitudinal data set. We are able to control for the association between different community characteristics and thus identify the degree to which access has changed for various types of communities. This has been a major shortcoming of most earlier work, which considers changing access along various lines separately, making it difficult to assess results (e.g. is growing inequality in access between rich and poor communities genuine or a spurious artifact of the relationship between income and some other community characteristic(s)?).
Our findings suggest that, between 1989 and 1997, while travel distances to hospitals increased for all strata of communities, the distance to clinics reduced significantly. Poorer provinces experienced greater erosion of access to hospital services but more improved access to clinic services than richer ones. This evidence is consistent with the direction of change we had earlier hypothesized. As also anticipated, charges for routine health services increased, but more so in economically better-developed provinces and in city and suburban communities. Our analysis of staffing conditions and quality suggest that the wealthier rural regions experienced the greatest improvement in the average quality of the care deliverer. Quality improvement was far less pronounced in the poorest rural areas that probably needed it
most. Waiting time in both clinics and hospitals seems to have fallen for most communities, but the observed reduction in clinics is not statistically significant. We also find that drug availability in both clinics and hospitals increased across all regions and strata, but that the increase in clinics was smaller in wealthier rural communities. It is somewhat surprising that the increase was smaller in rural areas given that drugs provide a significant revenue-generating potential for facili-ties. However, one possible explanation for this is that, given their rapid income growth in the 1980s, the wealthier rural areas had simply experienced more of an increase in drug availability than poorer areas during that decade. They may have arrived at the rational and efficient (given market conditions and the incentive structure confronting facilities) level of drug availability for their type of rural communities at an earlier time, and hence had less room for increase in the 1990s.
Certainly one must be careful in interpreting these findings in terms of their implications for an eventual impact on welfare. If health care services at a point in time are in fact being over-used (i.e. used at greater than the level called for by allocative efficiency) then changes in quality variables, such as cleanliness of the facility, could actually add to the extent of over-use by making the services more attractive. This line of reasoning would suggest that reducing quality of the care (such as by the common practice of purposefully putting the poor in crowded ward rooms) would move the level of services provided toward optimality. Our data and methods are not sufficient for determining the optimal output level for health services. We can only suggest how usage will react to changes in prices, quality and other factors. If the results suggest that improving quality will attract more users (as they do), the managers of health services (and perhaps the political process) will have to decide whether their own objectives suggest that the correct policy is to raise or lower quality. If, in fact, they do desire to reduce usage, they may want to consider quality changes that are not harmful to health outcomes.
Nonetheless, the results present something of a mixed picture in terms of the access changes experienced by the poorest populations. It is encouraging that changes to the cost of health services and drug availability did not occur to the particular detriment of the poorest communities. The observed decline in access to hospitals, possibly due to poor revenue-generating capacity, seems to be compensated for with improved access to clinics. For poorer communities, this may even suggest deeper penetration of health care, because clinics are particularly important to delivering care to lower income and rural populations. But on the other hand, the quality of care deliverers did not increase as much in the poorest communities as in others. This result may serve as confirmation that poorer communities have been losing well-trained doctors to hospitals in high-income communities. To maintain treatment capacity, facilities in the future may have to rely more heavily on village doctors or health workers. It also may be necessary to subsidize some poorer communities in order to enable them to provide the desired level of care availability. These are possibilities that deserve further research.
Endnotes
1Such documents can be found on the website of the Ministry of
Health at: [http://www.moh.gov.cn/ghcw/zcxx/jggl/index.htm].
2The significantly larger proportion of poorer villages is a result of
income being distributed unevenly among households.
3There are other minor facility types that we exclude for various
data-related reasons. In particular, we do not include pharmacies, which have increasingly added formally trained doctors to their staff (particularly in the era following the one that we consider in this analysis). However important pharmacies may have become, almost none of the CHNS respondents in the 1989 – 97 period list them as a source of care. It would thus be difficult to incorporate them into our analysis and, given the paucity of reports of pharmacies as sources of care, it is questionable whether pharmacies were important sources of care for the sample and time period analyzed. However, quite a few sources have suggested that their importance grew in the last several years, and hence any extension of analyses such as ours beyond 1997 should probably incorporate them.
4We use medians to avoid outliers in the reported measures. Using
community means produces very similar results.
5When community medians are used the results are similar except
that the regional and time differences in medicine availability are very imprecisely estimated.
6There is some debate about whether it is preferable to use
consumer reports concerning local facility characteristics or to gather such information from facilities themselves. However, there is evidence suggesting that in many contexts it may not be particularly important which approach is adopted. For instance,Akin and Schwartz (1986)find information gathered from individual consumers to be highly reliable. The authors have also done a short analysis with the Indonesian Family Life Survey (IFLS). In the IFLS, individual respondents provide reports of facility attributes that can be very precisely linked to information gathered in separate facility surveys, allowing for comparison of such things as consumer reports of the fee for a specific service with the fee level reported by local facilities. The reports provided by IFLS consumers very closely match the information recovered in the facility interviews.
7Using means for imputation produces very similar results, which
are not reported here.
8We use the price of flu treatment because it is a common
intervention and the only one for which we have sufficient observations to conduct the analyses in this paper. However, it is important to recognize that this variable has its limitations. However common in any given intervention, it does represent one of a vast array of potential treatments. It is also possible that this measure is somewhat contaminated by quality variation, since higher prices in some communities may simply reflect more extensive flu treatment regimens. However, constructing a more representative measure would require far more information concerning prices than the CHNS, or any other publicly available data source, offers. A good proxy variable will correctly order the facilities with respect to overall cost levels for patients. It is reasonable to expect that facilities with low prices for flu treatment will in general be low price facilities and that those charging high prices for flu treatment will tend to have high overall price schedules.
9Doctors trained in both disciplines are of high quality more often
than not. Unfortunately, this category is not specified in CHNS data until 1991, and thus will also be missing from our study.
References
Akin J, Schwartz JB. 1986. Demand analysis with price information obtained directly from respondents. World Bank Population, Health and Nutrition Technical Note 86 – 22. Washington, DC: World Bank. Akin J, Dow W, Lance P. 2004. Did the distribution of health insurance in China continue to grow less equitable in the nineties? Result from a longitudinal survey. Social Science and Medicine 58: 293 – 304.
Bloom G. 1997. Financing rural health services: lessons from China. In: Colclough C (ed.) Marketing education and health in developing countries – miracle or mirage. Oxford: Clarendon Press.
Bloom G, Gu X. 1997. Health sector reform: lessons from China.Social Science and Medicine45: 351 – 60.
Chawla M, Ellis RP. 2000. The impact of financing and quality changes on health care demand in Niger. Health Policy and Planning15: 76 – 84.
Gao J, Tang S, Tolhurst R, Rao K. 2001. Changing access to health services in urban China: implications for equity.Health Policy and Planning16: 302 – 12.
Hesketh T, Zhu W. 1997a. Health in China The healthcare market.British Medical Journal314: 1616 – 8.
Hesketh T, Zhu W. 1997b. Health in China Traditional Chinese medicine: one country, two systems.British Medical Journal315: 115 – 7. Hsiao W. 1995. The Chinese health care system: lessons for other nations.
Social Science and Medicine41: 1047 – 55.
Liu X, Liu Y, Chen N. 2000. The Chinese experience of hospital price regulation.Health Policy and Planning15: 157 – 63.
Litvack J, Bodart C. 1993. User fees plus quality equals improved access to health care: results of a field experiment in Cameroon. Social Science and Medicine37: 369 – 83.
Ministry of Health, People’s Republic of China (1993). Research on National Health Services – Analysis Report of the National Health Services Survey in 1993. Beijing.
Ministry of Health, People’s Republic of China (1998). Research on National Health Services – Analysis Report of the National Health Services Survey in 1998. Beijing.
Acknowledgements
We are grateful for financial support from the National Institute of Child Health and Human Development (Grant # HD38063).
Biographies
John S Akin is a professor of Economics at the University of North Carolina at Chapel Hill. He has been involved in research in health economics and health financing for developing countries for many years. He is a co-author of the World Bank’s policy paper on health financing,
Financing health care in developing countries: an agenda for reform.
Address: Department of Economics, University of North Carolina at Chapel Hill, Chapel Hill, NC 27599-3305, USA.
William H Dow is assistant professor of Health Policy and Adminis-tration in the School of Public Health at the University of North Carolina at Chapel Hill, and a Fellow at the Carolina Population Center. He holds a Ph.D. in economics from Yale University. Address: Department of Health Policy and Administration, School of Public Health, University of North Carolina at Chapel Hill, Chapel Hill, NC 27599-7400, USA.
Peter M Lance is a Doctoral candidate in Economics at the University of North Carolina at Chapel Hill. He is writing a thesis on the demand for health care in lower income nations. He is also interested in applied econometrics, international health and economic models of health behaviour.
Chung-Ping A Loh is a Doctoral candidate in Economics at the University of North Carolina at Chapel Hill. He is writing a thesis on health behaviour and labour market constraint. He is also interested in international health and economic models of health behavior. Address: Department of Economics, University of North Carolina at Chapel Hill, Chapel Hill, NC 27599-3305, USA.
Correspondence: Peter M Lance, Department of Economics, University of North Carolina at Chapel Hill, Chapel Hill, NC 27599-3305, USA. Email: pmlance@email.unc.edu; tel: þ1-919-966-2383; fax: þ 1-919-966-4986.