ROAD COMMISSION FOR
OAKLAND COUNTY
33rd Annual Three-Year Financial Plan
Fiscal Years 2014 - 2016
33
rdANNUAL THREE-YEAR
FINANCIAL PLAN
Road Commission for Oakland County
Fiscal Years 2014 – 2016
Quality Life through Good Roads.
We Care.
Prepared by the Financial Planning Group
February 2013
31001 Lahser Road
Beverly Hills, MI 48025
TABLE OF CONTENTS
Page
List of Tables ii
List of Figures iii
Preface 1
Acknowledgements 4
I. Introduction 5
II. Revenue Projections 7
III. Customer Needs – Unavoidable Cutbacks 10
IV. Financial Planning Guidelines 11
V. Review of Existing Resources 12
A. Revenue 12
B. Staffing 12
C. Vehicle Fleet 13
D. Physical Plant 13
VI. Projected Funding Sources 19
A. Federal Funds 19
B. State Revenues 20
C. Local Funds 21
D. Fees & Other Revenues 21
E. Fund Balance 22
VII. Projected Expenditures 26
A. Areas of Community Concern 26
1. Gravel Roads 26
2. Paved Road Program 26
3. Traffic Management System 32
4. Drainage Systems and Structures 32
B. PC Network Plan 32
C. Non-Departmental Expenditures 33
D. Capital Outlay 34
E. Road Improvement Program (RIP) 36
F. Attrition and Staff Cuts 36
VIII. Unmet Needs 37
APPENDIX A - Status of Vehicle Fleet 41
APPENDIX B - Road Improvement Program 48
LIST OF TABLES
Table No. Title Page
1 Statement of Projected Revenues 9
2 Revenues by Source
A. Actual and Budgeted (FY2004 - FY2013) 14
B. Projected (FY2014 - FY2016) 15
3 History of Budgeted Positions (FY2004 - FY2016) 18
4 Statement of Expenditures 28
• Actual, Budgeted & Projected (FY2012 – FY2016)
5 Expenditures by Category 31
• Actual, Budgeted & Projected (FY2012 – FY2016)
6 Non-Departmental Fixed Charges 35
• Actual, Budgeted & Projected (FY2012 – FY2016)
LIST OF FIGURES
Figure No. Title Page
1 Total Revenue by Source
A. FY2004 – FY2013 16
B. FY2012 – FY2016 17
2 Revenues by Source and Proportion
A. FY2014 Revenue Contributions (%) 23
B. FY2015 Revenue Contributions (%) 24
PREFACE
The Road Commission for Oakland County (RCOC) remains committed to the agency’s strategic vision:
QUALITY LIFE THROUGH GOOD ROADS
ROAD COMMISSION FOR OAKLAND COUNTY - WE CARE
The RCOC strategic focus – its mission – remains:
• Safe and convenient roads
• Responsive and dependable service
• Respect for the environment
• Sensitivity to community concerns
• Sound financial management
It also remains the mission of RCOC to provide its staff with:
• A cooperative work environment
• Opportunity for learning and growth
• Respect for the dignity of each individual
• Fair and equitable dealings
The vision and complementary mission statement provide the focus for the financial goals, objectives and actions culminating in this Financial Plan.
The plan is impacted by worldwide events. The global economic challenges show little sign of ending. Stock and bond markets remain volatile, while food and energy prices continue to rise. Experts suggest that the real estate bubble could be about to burst in China. In addition, the federal debt-ceiling and other fiscal challenges continue to influence the US economy.
However, Michigan continues to recover from its recent economic downturn and is doing better than many other states. It is projected that the moderate economic recovery will help to lower the state's unemployment rate from the current 8.9 percent to 8.4 percent by the end of 2013 and to 7.7 percent by the end of 2014. It is estimated that the state will add nearly 50,000 jobs over the next year and more than 61,000 jobs during 2014, due mainly to high-wage sectors such as professional, business and scientific services. The auto sector has been strong, and the housing market is showing signs of turning around. The unemployment rate has dropped five percentage points since the end of 2009.
Due to continued high gas prices, gasoline usage is down. As a result, RCOC’s largest source of operating revenue, the fuel tax, continues to decline. Over the past 10 years, the statewide fuel tax revenue declined 11.4 percent. Unfortunately, the decline compounds the problem of the fuel tax revenue not keeping up with the rate of inflation for many years. Each year, RCOC’s revenues fall further and further behind the ever-increasing expenses necessary to maintain and improve the road network, many of which actually exceed the inflation rate.
Michigan’s economic recovery has been positively impacted by increased auto sales, resulting in an annual increase of 1.98 percent in the state’s vehicle registration fees. The vehicle registration fees are the second largest source of operating revenue for RCOC. The combination of declining fuel tax revenue and increasing vehicle registration fees has resulted in a 0.15 percent increase from the prior fiscal year in RCOC's Michigan Transportation Fund (MTF) revenue. However, from 2002 to 2012, MTF revenues were down 6.7 percent statewide and 2.6 percent for RCOC. The most recent annual revenue forecast by the state Treasury Department projected that the state's transportation
experienced lesser increases than the state-wide average, this Financial Plan used a 0.45 percent increase for FY2014 rather than 0.5 percent.
Beginning in FY2011, the Michigan Department of Transportation (MDOT) has instituted a patchwork of one-time and short-term fixes to provide the local match to its federal aid. Several Michigan road commissions have had to turn back federal funds because they could not provide the local match. Soon, many other Michigan road agencies will do the same, which will mean that another state could receive those federal funds. It would be embarrassing for the state, if it weren’t even able to use the funds Michigan is eligible to receive.
Other events that adversely affect RCOC are the state’s continued annual transfer of $10 million from the MTF to the Secretary of State and the ongoing Inter-Departmental Grants (IDGs) to various other state departments. In addition, in its on-going effort to balance its budget, the Michigan state government continues to evaluate various alternatives for shifting state-wide financial resources, and this evaluation may include reallocating some current resources from transportation purposes to other uses.
Consistent with the above events, this Financial Plan continues to highlight a troubling trend: The state-collected revenues that RCOC uses for road maintenance and operating expenses continue to lag inflation, meaning our costs are increasing more rapidly than our funding. RCOC strongly advocates an increase in the state’s fuel taxes and other user fees as part of the remedy to this situation. Failure to adequately fund Michigan’s road needs will result in a return to the poor statewide road conditions of the mid-1990s.
Key components of this Financial Plan include
• Continued funding of a computer plan that includes continued modernization of the Integrated Enterprise Software Package. Major software affected by this effort includes the Geographic Information System (GIS), customer-service system, maintenance management work-order system and management system. The financial-management system includes modules for finance, budgeting, payroll, human resources, purchasing, inventory and facility and asset management.
• Inclusion of an Unmet Needs table containing detailed information regarding the reductions in service and needs and improvements that must be delayed due to anticipated limitations in funding.
• While some road equipment capital outlay is provided in FY2014, it will not be enough to significantly improve the status of RCOC’s fleet-readiness.
• Highlights of the last Strategic Planning meetings between RCOC staff and officials of the cities, villages and townships in Oakland County, include:
Conditions of paved roads utilizing RCOC’s Pavement Management System (PMS) that optimizes resources spent to extend the life of a road,
Benefits of roundabouts (continuous traffic flow, increased traffic safety),
Inadequacy of transportation investments and potential alternative funding strategies.
• A gravel-road planning process established a methodology to prioritize the paving of gravel roads in Oakland County. The gravel roads considered eligible for paving must be either primary roads or local roads with traffic counts greater than 800 vehicles per day. The prioritization system is keyed to safety, road function, traffic counts and corridor completion. This process identified a need to pave more than 150 miles of gravel roads. The 30-Year Gravel-Road Paving Plan specifically targeted about 40 miles of the highest-priority roads to be paved using federal funds.
• As part of its effort to cope with its decreasing MTF revenue, RCOC is forced to reduce many of its expenses. Examples of these on-going reductions include the continuing 50 percent reduction in staff travel, 33 percent reduction in staff training and 20 percent reduction in each department’s “discretionary” allocations in FY2014 through FY2016.
• In addition, this Financial Plan anticipates RCOC continuing to reduce full-time staff cumulatively to 163 vacant positions beginning in FY2014 and increasing to 269 vacant positions by FY2016. In an effort to offset these forced reductions, RCOC has increased the amounts dedicated to seasonal salaries. RCOC intends to supplement its winter maintenance operations with an additional temporary, part-time work force.
• Future funding for the Tri-Party Program from the County’s general government is uncertain. RCOC’s contribution to this program is projected at $1million for each year of the planning period.
Based on discussions during the Strategic Planning process, this Financial Plan addresses:
• The attempt to maintain and improve the level of service provided on county roads for the residents and travelers in Oakland County. This includes maintaining an acceptable level of truck-fleet readiness.
• Leveraging funds through aggressive matching with other agencies and private
developers.
• Continued containment of costs through revised health care benefits, risk management activities and privatization of certain contracted road services.
As mentioned earlier, RCOC strongly advocates an increase in the state fuel taxes and the introduction of other road funding mechanisms such as local-option funding and mileage-based user fees. RCOC will continue to provide statewide leadership directed toward securing adequate and equitable distribution of state and federal road funding. These efforts are crucial to the continued economic vitality of both Oakland County and the State of Michigan.
To help focus public attention on Michigan's inadequate road funding, RCOC has been advising its customers: "Take a close look at the roads you drive. Unless we receive additional funding, this is the best they will look for a long time. We no longer have funds to adequately repair the roads to eliminate potholes on our paved roads or to add more gravel to our gravel roads. The roads will get worse, and that will impact our ability to attract new employers and developers and retain the jobs we have. It also means you'll pay more to repair the damage to your car caused by rough roads."
Respectfully submitted,
Dennis A. Lockhart, Chairman Financial Planning Group
ACKNOWLEDGMENTS
The Financial Plan (Fiscal Years 2014 – 2016) was produced through the combined efforts of the Financial Planning Group (FPG) comprised mainly of the following individuals:
Dennis A. Lockhart Director of Finance – Chairperson
Dennis G. Kolar Managing Director
Gary C. Piotrowicz Deputy Managing Director – County Highway Engineer
Thomas G. Blust Director – Engineering
Thomas G. Noechel Programming Supervisor - Engineering
Pamela M. Cahill Director – Human Resources
Michael L. Harris Senior Human Resources Specialist – Human Resources
Patrick J. Carty Director – Legal
David A. Czerniakowski Director – Customer Services Danielle M. Deneau Director – Traffic-Safety
Charles T. Keller Traffic Engineer – Traffic-Safety
Ahmad Jawad Signal Systems Engineer – Traffic-Safety
Mark S. Goemaere Superintendent – Traffic-Safety Gilbert H. Luebke Superintendent – Traffic-Safety
David A. Evancoe Director – Planning & Environmental Concerns Judit K. Wittbrodt Transportation Planning Coordinator – PEC
Wayne A. Miller Information Systems Supervisor – PEC
Mary N. Gillis Director – Central Operations
Russell M. Curl Fleet Manager – Central Operations
John M. Lowe Superintendent – Central Operations
Darryl M. Heid Director – Highway Maintenance
Jay B. Carter Maintenance Operations Engineer – Highway Maintenance
David W. Lewis Superintendent – Highway Maintenance
Richard D. Wood Superintendent – Highway Maintenance
Neal W. Farner Superintendent – Highway Maintenance
Willis M. Greer Superintendent – Highway Maintenance
Matt A. Mountain Superintendent – Highway Maintenance
Mark A. Hirt Superintendent – Highway Maintenance
FINANCIAL PLAN - RCOC - FISCAL YEARS 2014-2016
I. INTRODUCTION
The development of the three-year Financial Plan is best described as a process to compile, review, analyze and justify information from numerous sources in an effort to forecast the future needs of the Road Commission for Oakland County (RCOC). Similarly, the expected revenues are forecast for the same three-year period and balanced against the agency’s ability to satisfy the needs of the motoring public. Prioritizing the listed needs contributes to defining the needs even more clearly and precisely. At this juncture, a commitment is made for including and satisfying certain needs while excluding others due to fiscal constraints. An extensive list of unmet needs is prepared that documents the discrepancy between available resources and tasks to be accomplished.
This Financial Plan illustrates the financial challenges faced by RCOC. Both state-collected and federal road funding sources remain inadequate to meet RCOC’s needs, and there is little hope that this will change during the three-year period covered by this document. For many years, state-collected road funding – the primary funds used by RCOC for road maintenance and operating expenses – has not kept up with inflation as depicted in the following tables.
Change in Statewide MTF Revenues: FY2002 – FY2012:
FY2002 FY2012 Change
%
Total MTF Revenues $2,014,365,028 $1,879,214,797 -6.7%
Gas Tax Revenues $934,945,378 $828,116,880 -11.4%
Change in RCOC MTF Revenues: FY2002 – FY2012:
RCOC MTF Revenues $59,752,972 $58,198,152 -2.6%
Growth in RCOC Major Expenditures: FY2002 – FY2012
(Examples - per like quantity)
Diesel Fuel $401,282 $1,636,809 308.4% Gasoline $154,582 $594,546 285.6% Asphalt $139,520 $282,879 102.8% Cold Patch $194,131 $319,354 64.5% Salt $995,742 $1,967,373 97.6% 5’ Float Blade $40,145 $94,905 136.4%
Traffic Signal Cabinet $1,141 $3,696 223.9%
Notes: For all line items, FY2012 quantities were used to calculate the cost increase per like quantity.
The actual total expenditure for each year is not shown because the total quantities purchased each year varied.
There was no comparable purchase of equipment in these years, therefore cost increase for equipment could not be demonstrated.
The largest source of RCOC revenues comes from the state-collected gas tax and vehicle-registration fees. Revenue generated by the gas tax remained stagnant from when the gas tax was increased by four cents per gallon in 1997 until 2004 when it started to decline. The tables on page 5 illustrate the decrease in the Michigan Transportation Fund (MTF) from 2002 through 2012 for both the state as a whole and for RCOC. They also track the dramatic decline of the gas tax for this period. For comparison purposes, the increase in expenses RCOC has faced over the same period is also depicted. The decline in funding and erosion of the purchasing power of MTF has forced RCOC to cut staff and services each year since FY2008. Given the dismal forecasts for state road funding, it has become clear that the cuts will have to go deeper, jeopardizing vital services RCOC provides for the traveling public.
The current Financial Plan is based on the assumption that there will be no increase in the state-collected gas tax during the next three years. RCOC relies on MTF dollars for all routine road maintenance and operating expenses, including pothole patching, winter road maintenance and gravel-road grading. Due to shrinking MTF revenue and drastically increasing expenses, RCOC has been forced to reduce or eliminate some of its activities, including routine asphalt overlays and concrete repairs. As of FY2007, all of the MTF revenue was needed to meet basic operating expenses.
Federal monies are the primary source of funding for major road-improvement projects for RCOC. However, after deductions for the Congestion Mitigation and Air Quality (CMAQ) program, 75 percent of the remaining federal road funds coming to Michigan, according to state statute, is dedicated to the Michigan Department of Transportation (MDOT). The remaining 25 percent is made available to the state’s 83 county-level road agencies and 500-plus cities and villages.
MAP-21, the Moving Ahead for Progress in the 21st Century Act was signed into law on July 6, 2012. Funding surface transportation programs at about $105 billion for FY2013 and FY2014, MAP-21 is the first highway authorization enacted since 2005. MAP-21 extended the previous federal transportation bill, known as SAFETEA-LU, for the remainder of FY2012 with new provisions for FY2013 and beyond taking effect on October 1, 2012. MAP-21 maintains the funding levels at FY2012 levels plus a minor adjustment for inflation - $40.4 billion from the Highway Trust Fund (HTF) for FY2013 and $41.0 billion for FY2014.
MAP-21 includes a performance-based multimodal program addressing challenges the U.S. transportation system is facing such as improving safety, maintaining infrastructure condition, improving efficiency and reducing delays. It also builds on many of the highway, transit, bicycle and pedestrian programs and policies established in 1991. The act restructured the core highway formula programs and eliminated earmarks. Activities carried out under previously existing formula programs were incorporated into a new core formula program structure.
Under MAP-21, the federal gasoline and diesel taxes remained unchanged. MAP-21 is not expected to have significant impact on the federal funds currently allocated to RCOC for major road projects because the funding allocation formulas remain the same as in SAFETEA-LU. The new bill reauthorizes the federal-aid highway program for two fiscal years only. In the absence of a six-year bill, state and local transportation agencies are unable to make long-term plans for ambitious projects.
The federal gasoline and diesel taxes that fund the federal surface transportation programs are becoming more and more obsolete every year. The tax rates have not kept pace with inflation. Recent large increases in the price of fuel and a lagging economy have reduced the traffic growth in the last few years. Hybrid vehicles and the Corporate Average Fuel Economy (CAFE) standards have also eroded this source of revenue going into the HTF by making cars more fuel-efficient. Due to further continued decline in vehicle miles traveled (VMT), coupled with higher fuel efficiency, the HTF will likely experience continued revenue shortfalls in the future. There is a consensus among
transportation and economic experts that the HTF is no longer a dependable source of revenue. For this reason, many transportation officials urge Congress to fundamentally change the nation’s approach to financing and managing transportation systems. They advocate the application of new sources of revenue (e.g., privatization, tolling, mileage-based user fees) and flexibility in financing transportation projects needed to keep commuters moving, shippers hauling and, consequently, the economy recovering.
Federal funds can be used only for specific major improvements, such as road widening, and cannot be used for road maintenance activities. Due to the current financial crisis, both MDOT and local road agencies might no longer be able to provide the match for some of the federal road funding to which they are entitled. This could mean the loss of critical federal funds and drastically reduced road and bridge programs statewide.
In summary, there are insufficient revenues to maintain, much less improve, our road system. The situation will only get worse because the primary methods of funding road improvements and maintenance (state gas tax and registration fees and federal funds) continue to lag inflation. Consequently, we expect to see a continuing decline of road and bridge conditions on our road network. Failure to fund operations at an appropriate level can have an impact on the safety of Michigan’s motorists.
The Michigan Transportation Asset Management Council, after reviewing the 2011 pavement management data, concluded that Michigan’s roads continue to deteriorate at an increasingly rapid rate. The Council projects that the situation will only get worse in the coming years because Michigan’s roads are deteriorating faster than they can be maintained with existing revenues. There has been a dramatic increase in the number of lane miles in poor condition, i.e. needing structural improvement (rehabilitation and reconstruction). In 2004, 13.6 percent of lane miles were in poor condition. By 2011, that number had more than doubled to 35.18 percent. The cost of returning a poor road to good condition is four to five times greater than the cost of returning a fair road to good condition. Allowing more roads to reach poor condition will dramatically increase the cost of repairing the road network.
This Financial Plan provides the blueprint for the agency’s efforts to maintain services to motorists in Oakland County from FY2014 to FY2016. RCOC is making every effort to most efficiently use the available funds. However, because of the road-funding crisis described above, this Financial Plan paints a picture that includes the necessary reduction of some RCOC activities and staff levels during the three-year planning period.
II. REVENUE PROJECTIONS
It is anticipated that state motor fuel taxes and license fees will remain the major source of agency revenue throughout the planning period covered by this Financial Plan. While revenue increases have been proposed in Lansing, it is far from clear that they will gain the necessary support. As a result, no increase is projected for the three future years. MTF revenues are in a crisis and failing to provide for adequate preservation and maintenance of the road system. Increases in commodity prices for steel, concrete, petroleum, asphalt and construction machinery resulted in dramatic erosion of the purchasing power of the declining MTF revenues. Further rising of construction costs and stagnant MTF revenues are expected during the current financial planning period, making MTF an unreliable revenue source. While state government and legislators have expressed their intention to secure more reliable and robust revenue sources for transportation, their efforts are in an early stage. Thus, revenue projections for the planning period cannot take them into consideration.
RCOC’s annual maintenance contract with MDOT is projected at the level of $10,500,000 during the planning period. This amount is lower than the actual amount in FY2012 which was required to perform the necessary maintenance on the state trunklines. The projected amount was provided by MDOT considering the existing uncertainties with its
budget. MDOT is also facing stagnant MTF revenue projections. Therefore, it is unlikely that the maintenance contract will be increased.
Road construction funded by the Transportation Economic Development Fund (TEDF) is expected at a very low level in FY2014 compared to the actual FY2012 and FY2013 budgeted amounts. The projections for FY2015 and FY2016 are more optimistic.
The federal aid for road improvements, mainly in the form of Surface Transportation Program funds, is expected to decrease from about $20.7 million annually to about $8.7 million over the three-year period. Federal aid for Intelligent Transportation System (ITS -- transportation technology) projects is expected to be slightly above $2 million during the planning period.
In conclusion, during the planning period of FY2014 - FY2016, total revenues are expected to be stagnant. They will somewhat decrease in FY2015 compared to the FY2014 level and decrease in FY2016. The available revenues will not cover the expected increase in expenses and certainly will not allow for the needed road-construction work. Declining revenues coupled with the increasing costs of material and equipment will force RCOC to make further cuts in services and staffing. A detailed account of the projected revenue from all sources is provided in Table 1.
Table 1
Road Commission for Oakland County
STATEMENT OF PROJECTED REVENUES
Fiscal Year Ending 9/30
REVENUES 2012 2013 2014 2015 2016
ACTUAL BUDGET PROJECTION PROJECTION PROJECTION STATE & FEDERAL REVENUES
MOTOR FUEL TAXES & LICENSE FEES $58,198,153 $57,698,700 $57,958,400 $58,219,200 $58,481,200 STATE ECONOMIC DEVELOPMENT FUND 6,003,667 1,690,000 1,000,000 6,800,000 6,800,000 STATE MAINTENANCE CONTRACT 11,501,683 10,500,000 10,500,000 10,500,000 10,500,000
STATE-OTHER 122,210 200,000 200,000 200,000 200,000
FEDERAL AID-RIP 20,355,006 16,976,000 20,680,500 18,215,500 8,715,000 FEDERAL REVENUE-MEDICARE PART D 721,521 300,000 300,000 300,000 300,000 FEDERAL AID-SigPro/ITS 2,832,046 2,080,000 2,160,000 2,240,000 2,320,000 --- --- --- ---
TOTAL $99,734,286 $89,444,700 $92,798,900 $96,474,700 $87,316,200
LOCAL REVENUES
CITY/TWNSHP/OTHER LOCAL CONTRIBUTIONS $5,013,747 $3,307,500 $3,659,750 $4,047,250 $2,670,000 COUNTY CONTRIBUTIONS 1,031,733 1,000,000 1,000,000 1,650,000 1,000,000 OTHER CONTRIBUTIONS (INCL W.O.) 923,057 1,260,000 1,260,000 1,260,000 1,260,000 TRAFFIC SIGNAL MAINTENANCE 1,320,228 1,400,000 1,400,000 1,400,000 1,400,000
ITS/SEMSIM LOCAL 0 0 0 0 0
S.A.D. (ENG & ADMINISTRATION) 624,007 600,000 600,000 600,000 600,000 --- --- --- ---
TOTAL $8,912,772 $7,567,500 $7,919,750 $8,957,250 $6,930,000
FEES & OTHER REVENUE
INTEREST EARNED $212,664 $100,000 $100,000 $100,000 $100,000
PERMIT FEES 382,294 300,000 300,000 300,000 300,000
INSPECTION CHARGES 484,448 500,000 500,000 500,000 500,000 CALCIUM CHLORIDE REVENUE 540,935 750,000 550,000 600,000 600,000 SALE OF MAPS & PLANS 5,257 15,000 15,000 15,000 15,000 PROCEEDS OF EQUIPMENT DISPOSALS 63,565 50,000 50,000 50,000 50,000
PURCHASE DISCOUNTS 0 2,000 2,000 2,000 2,000
SUNDRY REVENUES 1,481 15,000 15,000 15,000 15,000
SALE OF PROPERTY 0 0 0 0 0
PROCEEDS-LONG TERM DEBT/INSURANCE 0 0 0 0 0
--- --- --- ---
TOTAL $1,690,644 $1,732,000 $1,532,000 $1,582,000 $1,582,000
--- --- --- ---
TOTAL REVENUES: $110,337,702 $98,744,200 $102,250,650 $107,013,950 $95,828,200
(INCREASE) DECREASE FUND BALANCE 0 4,357,692 3,440,000 0 0 --- --- --- ---
III. CUSTOMER NEEDS – UNAVOIDABLE CUTBACKS
The strategic focus of the current Financial Plan remains excellence in delivery of services in response to the needs of RCOC’s customers in the face of increasing financial belt tightening.
RCOC identified four areas of major concern to our communities as part of the Strategic Planning process and set about incorporating these four areas of concern into the financial and budgetary processes of the agency. The four areas of strategic customer concern are as follows:
• Improved safety and condition of gravel roads,
• Improved safety, capacity and condition of paved roads,
• Improved traffic management, and
• Improved road drainage.
Since 1989, the Financial Planning Group (FPG) has re-examined these areas of concern as part of its yearly planning effort. The FPG has determined that these areas of customer concern are still valid and should guide RCOC’s Financial Planning Process for the up-coming three-year period. These concerns are strategically reflected throughout the expenditure discussions of this Financial Plan.
For many years, despite shrinking transportation funds, RCOC was able to deliver its services and accomplish scheduled construction projects. Eventually, RCOC was forced to reduce services due to the dismal state of road funding and has completely eliminated a number of road improvement and maintenance activities. Elimination or reduction of services and programs impacted the following activities and needs:
• major road resurfacing work (typically includes base repair, removal of existing pavement and placement of three or four inches of new asphalt),
• 50/50 Drainage Program (cost sharing program with local communities to improve drainage),
• Tri-Party program (reduction in funding of the program),
• simple road resurfacing (1.5 inch asphalt overlays),
• concrete repairs,
• new gravel applications for gravel roads,
• underground electrical work,
• pavement markings,
• contracted traffic signal upgrades,
• traffic signal configuration design work,
• traffic sign materials,
• guardrail materials,
• attenuator materials,
• equipment replacements (deferred the purchase of equipment that have exceeded the replacement standard),
• buildings and grounds need projects (HVAC replacement at various locations, security gates and parking lot repaving)
Given the expected lack of increase in revenues for the planning period, further reduction to services will likely have to be made. The unmet needs are discussed in Chapter VIII of
IV. FINANCIAL PLANNING GUIDELINES
Facing the Greatest Challenges -- Balancing Staff, Equipment and Projects
The FPG, in light of anticipated revenues, its assessment of strategic customer needs and in consultation with the Managing Director, has adopted guidelines to direct its recommendations regarding allocation of resources. The guidelines established for this Financial Plan are as follows:
• Revenue projections assume no increases in fuel taxes or vehicle registration fees.
• No new revenue sources are expected.
• Existing revenue sources continue to decrease or might even disappear, e.g., funding for the Tri-Party Program from Oakland County is uncertain for future years.
• Available fund balances are required to fund continuing activities during the planning period thus further depleting the savings of the agency.
• Revenue from the sale of excess RCOC property was not considered as available.
• Improving roadway safety and conditions, service delivery, and fleet readiness are priority concerns.
• No additional staff positions are anticipated. The engineering co-op program has been eliminated. No full-time vacancies will be filled unless justified. The staff level will be lowered through attrition, if possible. If the necessary staff reduction cannot be achieved through attrition, other means will have to be considered.
• Travel and training budgets will be further reduced where appropriate.
• Agency-wide efforts to implement cost-saving measures continue.
• Implementation of a comprehensive computer plan and software update plan must be continued. However, a lower PC replacement level has been established and less training will be available.
• Office equipment (copier and fax machines) will be replaced only if they fail to work.
• Heavy equipment replacement will be possible at a very low level. It has been made difficult due to the price increases triggered by federally mandated emission requirements.
• Additional funds would be needed for equipment repair and refurbishing.
• The equipment fleet will be kept at a reduced size based on the reduction of the work force and the equipment taken out of service at the end of its useful life.
• An appropriate balance of staff, equipment and projects must be worked out by the Financial Planning Group through thorough and careful analysis.
This Financial Plan assures that RCOC will continue to operate as efficiently and effectively as possible. It enables the agency to continue exploring ways of using technology to streamline operations and to consider the option of privatizing activities if it makes good business sense to do so. RCOC is committed to fulfilling its commitment to do the best it can with the available resources, to maintaining and improving the condition of its roads, including addressing congestion and enhancing safety.
Similar to the last three planning periods, this Financial Plan includes all three years (FY2014- FY2016) in the detailed planning and balancing process to assure the best possible use of the available revenue.
V. REVIEW OF EXISTING RESOURCES
The FPG has evaluated RCOC resources in four categories:
A. Revenue
In addition to the state and federal sources outlined in section VI of the report, funding is received through contributions from local units of government and from private sector fees for RCOC services. RCOC also contracts with the State of Michigan for services performed on state trunklines. Unfortunately, the popular Tri-Party program has been reduced in recent years due to declining contributions from the county general government, and those contributions are uncertain in the future.
Table 2A and Figure 1A illustrate the historic trends between FY2004 and FY2013 and funds received from various revenue sources grouped by category. They clearly show the significant decrease of gas-tax revenues since FY2004 compared to previous years. Table 2B includes the projected revenue for the planning period. Figure 1B displays the unfavorable trend of the anticipated stagnant revenue during the planning period with some increase in FY2015. When corrected for inflation, the purchasing power of the expected revenue will be decreasing while construction costs are anticipated to further increase.
B. Staffing
For FY2013, only 415 positions were budgeted. One hundred and thirty five actual fulltime positions were eliminated through attrition since FY2007 when the agency had 556 full-time positions. The temporary position of superintendent in training was discontinued in FY2008. The agency eliminated the engineering co-op program. In FY2010, one department was merged into two other departments.
According to the financial planning guidelines governing the work of the FPG, further staff reductions are planned for the period covered by this Financial Plan. The departmental staffing allocations for FY2014 through FY2016 are summarized in Table 3 along with historic staffing levels from FY2004 through FY2013. Vacancies in full-time positions will be filled only if it is determined that the workload of the position cannot be distributed to other positions. Moreover, in FY2014 the staffing level will have to be reduced by 28 positions. It is expected that 53 more positions will have to be eliminated in FY2015. In FY2016, 53 additional positions will have to be eliminated. The staff level will be lowered through attrition, if possible. If the necessary staff reduction cannot be achieved through attrition, other means will have to be considered. The drastic reduction in the workforce will have a significant impact on the level of service provided to the public.
Currently, RCOC has fewer employees than in 1962, when Oakland County had about half the population it has today and one-fifth as much traffic. Since 1962, many roads have been widened or paved and many new traffic signals and signs installed.
The staffing level is at a critical point and future attrition might not be sustainable. In a search for new job models, the agency implemented an experiment for the winter of 2012 – 2013 by setting up a temporary part-time crew supplementing the core group of full-time employees responsible for winter maintenance activities. This arrangement responds to the importance of the winter maintenance in the eyes of the public while keeping staffing-related expenses down. The experiment will be evaluated at the end of the winter.
C. Vehicle Fleet
In the past, major vehicle purchases, coupled with aggressive preventive maintenance and improved vehicle specification procedures, resulted in a high level of fleet readiness. Each major vehicle type has been assigned a DX (discard) standard based on age to determine total needs. Fleet acquisitions were made on a priority basis based on the age and condition of the equipment that had to be removed from active fleet service. In recent years, while the FPG recognized the ongoing need for vehicle fleet improvement, there were dramatically shrinking funds available for this task. As a consequence, fleet acquisitions could address only selective vehicle needs. Today, the vehicle fleet is in a dire need of rejuvenation, since the majority of the equipment has exceeded the DX standards and could fail at any moment.
During FY2012, a fleet-size reduction was implemented to “right-size” the fleet due to decreases in the work force and to account for equipment that has been taken out of service. The result of the FY2012 right-sizing was the removal of 39 equipment units from the fleet. This is an on-going process and was also applied for the current financial planning period. Current costs for fleet replacements were also reviewed and reductions in the estimated costs have been made based on information available through the State’s MiDeal contracts. It is anticipated that reduction in cost will be achieved through the specification of equipment that utilizes “standard” packages and also reduces long term fuel costs.
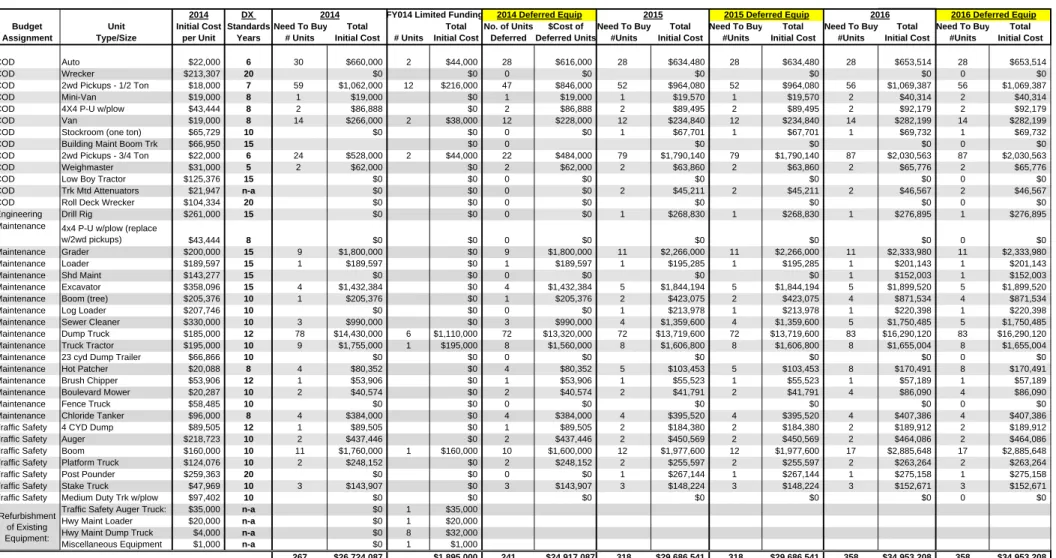
In determining capital outlay priorities for FY2014, efforts were made to prioritize the equipment involved in the core mission of the agency. The majority of the investment will be geared towards improving services such as snow plowing and signal maintenance. Additional funds were also set aside to refurbish existing vehicles including snowplow trucks, an auger truck and a loader. The refurbishment of these vehicles will extend the service life of a few essential pieces of equipment, knowing that sufficient funds are not available to initiate a full replacement plan at this time.
D. Physical Plant
The number of buildings owned and maintained by RCOC will remain the same during the period covered by this Financial Plan. Because of the funding crisis, there are no major building improvements planned for the financial planning period. Table 7 contains the agency’s Unmet Needs including several major buildings and grounds needs that could not be funded in the current Financial Plan. With the Traffic Operation Center lease with Oakland County expiring in 2015, either a lease extension will be necessary or other accommodations will have to be made.
Table 2A
Road Commission for Oakland County REVENUES BY SOURCE (Actual and Budgeted)
FY2004 - 2013
Actual Actual Actual Actual Actual Actual Actual Actual Actual Budgeted REVENUE SOURCE FY2004 FY2005 FY2006 FY2007 FY2008 FY2009 FY2010 FY2011 FY2012 FY2013
($) ($) ($) ($) ($) ($) ($) ($) ($) ($) STATE MTF 64,494,903 61,014,417 61,703,567 61,682,103 59,886,096 57,664,585 57,424,979 57,332,602 58,198,153 57,698,700 OTHER STATE 19,406,244 25,659,569 18,330,989 19,974,794 16,386,996 17,872,966 11,385,454 18,761,717 17,627,560 12,390,000 FEDERAL AID 28,017,896 14,008,032 21,078,499 25,577,385 18,611,506 13,893,537 20,553,349 20,242,453 23,908,573 19,356,000 LOCAL 9,385,307 10,297,476 9,133,687 12,866,717 8,998,571 10,334,485 9,622,814 9,218,560 8,912,772 7,567,500 OTHER 2,066,180 3,891,731 4,258,525 4,275,735 3,272,934 2,073,857 1,858,619 1,774,178 1,690,644 1,732,000 PROCEEDS * 2,577,821 791,459 556,064 0 0 0 0 0 0 0 TOTAL 125,948,351 115,662,684 115,061,331 124,376,734 107,156,103 101,839,430 100,845,215 107,329,510 110,337,702 98,744,200 *
Table 2B
Road Commission for Oakland County
REVENUES BY SOURCE (Projected)
FY2014 - FY2016
REVENUE SOURCE FY2014 FY2015 FY2016
($) ($) ($) STATE MTF 57,958,400 58,219,200 58,481,200 OTHER STATE 11,700,000 17,500,000 17,500,000 FEDERAL AID 23,140,500 20,755,500 11,335,000 LOCAL 7,919,750 8,957,250 6,930,000 OTHER 1,532,000 1,582,000 1,582,000 PROCEEDS 0 0 0
(Long-term debt or insurance)
Figure 1A
Road Commission For Oakland County
0 20,000,000 40,000,000 60,000,000 80,000,000 100,000,000 120,000,000 140,000,000 2004 2005 2006 2007 2008 2009 2010 2011 2012 2013 R ev en u e ( $) Fiscal Year
Total Revenue by Source -- FY2004 - 2013
PROCEEDS OTHER LOCAL FEDERAL AID OTHER STATE STATE MTF
Figure 1B
Road Commission For Oakland County
0 20,000,000 40,000,000 60,000,000 80,000,000 100,000,000 120,000,000 2012 2013 2014 2015 2016 R ev en u e ( $) Fiscal Year
Total Revenue by Source -- FY2012 - 2016
OTHER LOCAL FEDERAL AID OTHER STATE STATE MTF
Table 3
Road Commission for Oakland County HISTORY OF BUDGETED POSITIONS
Department 2004 2005 2006 2007 2008 2009 2010 2011 2012 2013 2014 2015 2016 Managing Director 8 8 8 8 8 7 8 7 7 7 7 7 7 Customer Services 7 7 7 7 7 7 6 19 16 15 15 15 15 Finance 16 16 16 16 16 15 15 14 14 13 13 13 13 Legal 10 10 10 10 10 10 9 9 8 6 6 6 6 Central Operations 73 73 73 73 73 70 64 60 57 52 52 52 52 Human Resources 6 6 6 6 6 6 6 6 5 5 5 5 5 Engineering 86 86 86 86 83 80 75 71 67 63 63 63 63
Planning & Environmental Concerns 11 11 11 11 11 10 10 12 11 11 11 11 11
Traffic-Safety 99 99 100 (1) 99 98 94 91 85 80 77 77 77 77
Permits & Environmental Concerns 20 20 20 20 20 19 17 0 0 0 0 0 0
Highway Maintenance 221 (1) 221 (1) 221 (1) 221 (1) 220 212 184 181 165 166 166 166 166
Total 557 (1) 557 (1) 558 (1) 557 (1) 552 530 485 464 (2) 430 415 415 (3) 415 (4) 415 (5)
Budget Reductions 4 22 67 86 120 135 <28> <28> <28>
387 <53> <53>
334 <53>
(1) Added temporary position of superintendent in training 281
(2) Two positions were permanently eliminated (3) To be reduced by 28 positions in Fiscal Year 2014 (These positions need to be identified.)
(4) To be reduced by further 53 positions in Fiscal Year 2015 (These positions need to be identified.)
(5) To be reduced by further 53 positions in Fiscal Year 2016 (These positions need to be identified.)
VI. PROJECTED FUNDING SOURCES
Funding sources for RCOC have traditionally come from three areas: federal, state and local. RCOC is actively pursuing increased funding from these sources as well as private support from developers who could absorb the cost for certain improvements. There is a widening gap between Oakland County’s road network needs and the ability to fund them through traditional public means. In response to diminishing confidence in adequate future revenues from the gas tax and vehicle registration fee, RCOC needs to find new revenue sources for funding road projects.
Overall, state and federal revenues are projected to provide most (90 - 91 percent) of total revenues during the planning period. The anticipated federal and state revenues are summarized below.
Fiscal Year State Revenue Federal Revenue State and Federal Revenues Total Revenues Percentage of Total 2014 $69,658,400 $23,140,500 $92,798,900 $102,250,650 91% 2015 $75,719,200 $20,755,500 $96,474,700 $107,013,950 90% 2016 $75,981,200 $11,335,000 $87,316,200 $95,828,200 91% A. Federal Funds
Federal road funds have been authorized and defined by multi-year federal legislation. MAP-21 provides authorization until the end of FY2014. Federal road funds are distributed through several program categories. The funds are primarily generated by the federal gas tax of 18.4 cents per gallon. Federal funds are not guaranteed each year like the MTF revenue. They are not true revenues, but rather construction-specific funds for which RCOC, cities and villages compete. Industry analysts indicate that higher construction costs resulting from increases in steel, cement and petroleum prices have affected the overall growth in road construction. If prices continue to rise as expected, higher costs will cause a decrease in the purchasing power of the federal funds and force road authorities to postpone important planned projects.
RCOC has successfully secured federal funds for projects for the planning period. The FY2013 budgeted level of federal funding is about $19 million. For the planning period, federal funding is projected at the $11 million to $23 million level annually. However, if RCOC cannot provide the required matching funds due to the continuing financial crisis, these funds could be lost.
Fiscal Year Total Funds Federal Funds % of Total
2014 $102,250,650 $23,140,500 23%
2015 $107,013,950 $20,755,500 19%
2016 $95,828,200 $11,335,000 12%
Annual federal fund allocations for paving gravel roads were previously approved by the Oakland County Federal Aid Funding Committee. For FY2014 through
match. With these limited revenues, less than one mile of gravel-road paving can be completed each year. Additional paving may be done at the initiative of local communities and developers, which is encouraged by the communities and RCOC staff. RCOC maintains almost 800 miles of gravel roads. Some of these roads carry traffic volumes exceeding 1,000 vehicles per day. The combination of the notorious freeze/thaw cycles of the Michigan winter, poor soils and high traffic demands cause severe deterioration of the gravel roads. At times, RCOC maintenance crews simply cannot prevent the deterioration of the gravel surfaces in spite of their best efforts.
In addition to the funds awarded for construction projects, the Intelligent Transportation Systems (ITS), RCOC Fleet Management project and FAST-TRAC signal projects have received federal aid in previous years from other program sources or earmarks. Federal-aid revenue received for these projects is budgeted at the level of $2.1 million for FY2013. These projects are expected to receive funds from federal sources and are budgeted at around the $2.1 million to $2.3 million level during the planning period of FY2014 to FY2016.
B. State Revenues
The Michigan Transportation Fund (MTF) revenue from motor fuel taxes and registration fees is expected to continue to be the major source of revenue for RCOC throughout the period covered by this plan. MTF revenues are expected to be stagnant, somewhat above the FY2013 budgeted level during the planning period of FY2014 through FY2016. As a percentage of total revenues, MTF revenue will vary between 54 percent and 61 percent during the planning period.
Fiscal Year Total Funds MTF Revenue % of Total
2014 $102,250,650 $57,958,400 57%
2015 $107,013,950 $58,219,200 54%
2016 $95,828,200 $58,481,200 61%
The continued erosion of the purchasing power of the MTF revenue due to the increased costs of road improvements and maintenance activities is a major concern to all local road agencies. Research shows that Oakland County remains a donor county, contributing more to the state MTF than it receives back. While efforts to increase the state fuel tax are ongoing, they are not expected to impact revenues during this planning period.
Another element of state revenue is the state Transportation Economic Development Fund (TEDF). TEDF revenues will represent a minor share (1 to 7 percent) of the agency’s total revenue. These funds are project specific, based on competition with city and village projects in Oakland County.
Fiscal
Year TEDF Funds (All Sources) Total Percentage TEDF
2014 $1,000,000 $102,250,650 1%
2015 $6,800,000 $107,013,950 6%
An additional element of state funding, the contract to maintain state trunklines, is expected to remain at the same level during the period covered by this plan. The contract is projected to yield $10.5 million each year during the planning period. Due to cost increases, flat revenue from the state maintenance contract means that RCOC will be able to perform less and less work on the state trunklines. This revenue source will continue to represent a considerable share of the agency’s revenues (9 to 10 percent) as shown in the following table.
Fiscal Year State Maintenance Contract Total (All Sources) State Maintenance Percentage 2014 $10,500,000 $102,250,650 10% 2015 $10,500,000 $107,013,950 10% 2016 $10,500,000 $95,828,200 11% C. Local Funds
Funding from all local sources projected for the financial planning period is shown in the following table.
Fiscal Year Local Funds Percentage of Local
Total
2014 $7,919,750 8%
2015 $8,957,250 8%
2016 $6,930,000 7%
Total local funding is projected at the level between $7 million to $9 million during the period covered by this Financial Plan. This revenue source will represent a minor share (7 to 8 percent) of the agency’s revenues.
Among the other various local revenue sources, the traffic signal maintenance revenue is projected to be steady during the planning period at the level of $1.4 million. The current Financial Plan, in contrast to past plans, does not include funding for signal projects, ITS and RCOC’s Fleet Management programs from local sources.
D. Fees and Other Revenues
Private-sector revenue from fees and other sources comprises approximately 1.5 percent of total revenue. One major source is the revenue from the agency’s calcium chloride “enterprise” program, projected at about $550,000 to $600,000 annually throughout the three-year period. The agency continues to monitor these local revenues, especially those related to agency services for which user fees are applied. This monitoring ensures that revenue received is consistent with service rendered.
E. Fund Balance
The use of $4.4 million of fund balance in FY2013 includes a “carry over” amount for various road-construction projects that were budgeted in the previous fiscal year. This Financial Plan anticipates that the use of fund balance will be $3.4 million in FY2014 and zero during the rest of the financial planning period.
Figure 2A
Road Commission for Oakland County
State MTF 57% Other State 11% Federal Aid 23% Local 8% Other 1%
Figure 2B
Road Commission for Oakland County
State MTF 55% Other State 16% Federal Aid 19% Local 8% Other 2%
Figure 2C
Road Commission for Oakland County
State MTF 61% Other State 18% Federal Aid 12% Local 7% Other 2%
VII. PROJECTED EXPENDITURES
RCOC has been striving to respond to recent funding challenges by improving efficiencies and cutting costs whenever possible. Examples of this effort include application of new technologies and cutting-edge equipment, use of recycled-asphalt products, privatization, restructuring retirement benefit plans and increasing healthcare contributions for non-represented employees.
Projected expenditures by department with details by category are shown in Table 4. Expenditures for all categories are summarized in Table 5. The major costs for the agency, beyond salaries, are described in the next section, listed by community concerns, the computer plan, capital outlay, the Road Improvement Program and others.
A. Areas of Community Concern
1. Gravel Roads:
Maintenance of Gravel Roads:
RCOC maintains nearly 800 miles of gravel roads, one of the largest gravel road systems in Michigan. Many of these gravel roads are in developing areas where traffic volumes can exceed those normally seen on paved roads in other parts of the state.
The Financial Plans of past years consistently have recognized gravel road maintenance as a strategic community concern. RCOC materials (new gravel and slag) were allocated to maintain the surface of the gravel roads. This work was accomplished by RCOC staff rather than private contractors. In recent years, the combined budget for gravel and slag had to be decreased due to lack of funding. During the current financial planning period, further cuts will have to be made. Reduction in this service will lead to rougher gravel roads and less convenient travel for residents.
Gravel Road Improvement Program (GRIP):
The popular Gravel Road Improvement Program (GRIP), in which communities pay for materials while RCOC supplies labor and equipment to improve drainage and spread gravel, will continue to be offered during FY2014 to FY2016 as long as the communities have funds for the new gravel.
2. Paved Road Program:
The computerized database within the Pavement Management System (PMS) remains the major analytical tool for identifying and prioritizing county road maintenance and resurfacing projects. This system quantitatively identifies the condition of county road pavements, prioritizes road segments requiring repaving and provides basic budgetary data for planning purposes.
RCOC recognized the benefit of a Preservation Overlay program (simple 1.5 inch asphalt overlay) many years ago. However, due to decreasing revenues, RCOC was forced to discontinue this program. This activity is not included in the current financial plan due to lack of funding. Similarly, the agency’s concrete patch program and crack sealing program had to be cut.
The Road Improvement Program (RIP) for FY2014 contains a total of $27.5 million for improvement of roads beyond maintenance work. Of this, $7.5 million is for pavement rehabilitation projects, $2.5 million is for paving gravel roads and the remainder for capacity and safety improvements.
Projects in progress, which are carried over from the previous year, total $8.5 million.
For FY2015, the RIP contains $25.3 million for improvement of roads including $13.2 million for pavement rehabilitation. Projects carried over from FY2014 total $15.1 million.
For FY2016, the RIP contains $16.1 million for road improvement projects including $10.6 million for pavement rehabilitation and $2.1 million for paving gravel roads. In FY2016, project completion from the previous year totals about $10.6 million.
The RIP can be found in Appendix B including a list of projects for each year of the financial planning period grouped by type of project. The list also indicates the funding sources and the estimated total project costs. The costs in Appendix B include RCOC labor and equipment costs while Table 4 shows salaries and other expenditures separately.
Table 4
Road Commission for Oakland County STATEMENT OF PROJECTED EXPENDITURES
Fiscal Year Ending 9/30
2012 2013 2014 2015 2016
EXPENDITURES ACTUAL BUDGET PROJECTION PROJECTION PROJECTION
BOARD OF ROAD COMMISSIONERS
SALARIES $31,001 $31,000 $31,000 $31,000 $31,000
SUPPLIES, MATERIALS & PARTS 0 250 250 250 250
CONTRACTED SERVICES 79,900 110,000 110,000 110,000 110,000 OTHER EXPENSES 15,826 17,365 15,433 15,588 15,368 CAPITAL OUTLAY 0 0 0 0 0 --- --- --- --- TOTAL $126,727 $158,615 $156,683 $156,838 $156,618 MANAGING DIRECTOR SALARIES $496,777 $498,973 $506,330 $512,553 $518,854 SUPPLIES, MATERIALS & PARTS 43,589 41,800 41,500 41,500 41,500 CONTRACTED SERVICES 89,369 110,000 110,000 110,000 110,000 OTHER EXPENSES 39,240 30,000 28,159 28,847 27,870 CAPITAL OUTLAY 0 0 0 0 0 --- --- --- --- TOTAL $668,975 $680,773 $685,989 $692,900 $698,224 CUSTOMER SERVICES SALARIES $868,529 $859,466 $871,353 $881,407 $891,587 SUPPLIES, MATERIALS & PARTS 8,949 12,025 12,025 12,025 12,025 CONTRACTED SERVICES 19,530 33,920 33,920 33,920 33,920 OTHER EXPENSES 1,904 2,602 2,631 2,776 2,570 CAPITAL OUTLAY 0 0 0 0 0 --- --- --- --- TOTAL $898,912 $908,013 $919,929 $930,128 $940,102 FINANCE SALARIES $797,902 $806,980 $818,410 $828,077 $837,866 SUPPLIES, MATERIALS & PARTS 9,500 10,486 9,171 9,325 9,107 CONTRACTED SERVICES 14,552 75,510 51,760 76,760 51,760 OTHER EXPENSES 936 1,900 1,900 1,900 1,900 CAPITAL OUTLAY 0 0 0 0 0 --- --- --- --- TOTAL $822,890 $894,876 $881,241 $916,062 $900,633 LEGAL SALARIES $474,253 $477,379 $484,480 $490,486 $496,567 SUPPLIES, MATERIALS & PARTS 32,761 37,147 36,951 37,316 36,797 CONTRACTED SERVICES 19,862 16,000 20,277 20,431 20,591 OTHER EXPENSES 2,841 3,000 3,000 3,000 3,000 CAPITAL OUTLAY 0 0 0 0 --- --- --- --- TOTAL $529,717 $533,526 $544,708 $551,233 $556,955 HUMAN RESOURCES SALARIES $351,985 $514,699 $539,712 $543,952 $548,245 EMPLOYEE BENEFITS 15,302 18,000 18,000 18,000 18,000
SUPPLIES, MATERIALS & PARTS 10,951 6,985 6,985 6,985 6,985 CONTRACTED SERVICES 71,906 104,100 129,100 104,100 104,100
OTHER EXPENSES 18,753 25,150 25,150 25,150 25,150
CAPITAL OUTLAY 0 0 0 0 0
--- --- --- ---
Table 4
Road Commission for Oakland County STATEMENT OF PROJECTED EXPENDITURES
Fiscal Year Ending 9/30
2012 2013 2014 2015 2016
EXPENDITURES ACTUAL BUDGET PROJECTION PROJECTION PROJECTION
PLANNING AND ENVIRONMENTAL CONCERNS
SALARIES $701,157 $754,424 $765,500 $774,869 $784,355 SUPPLIES, MATERIALS & PARTS 92,764 45,185 46,585 44,085 24,710 CONTRACTED SERVICES 389,300 478,685 553,690 463,090 492,690 OTHER EXPENSES 12,205 13,638 13,210 13,453 12,899 CAPITAL OUTLAY 16,751 10,000 0 0 0 --- --- --- --- TOTAL $1,212,177 $1,301,932 $1,378,985 $1,295,497 $1,314,654 CENTRAL OPERATIONS SALARIES $2,836,442 $3,042,345 $3,083,578 $3,118,454 $3,153,766 SUPPLIES, MATERIALS & PARTS 2,240,545 2,661,400 2,723,030 2,787,221 2,852,991 CONTRACTED SERVICES 137,141 139,078 132,956 134,661 136,427
OTHER EXPENSES 34,488 30,500 31,732 31,755 31,765
UTILITIES 634,506 775,000 798,250 818,160 838,580
REPAIRS & MAINTENANCE 3,177,507 3,121,724 2,766,930 2,792,686 2,754,380
CAPITAL OUTLAY 409,129 0 342,000 0 0
--- --- --- --- TOTAL $9,469,758 $9,770,047 $9,878,476 $9,682,937 $9,767,909
ENGINEERING
SALARIES $4,456,665 $4,377,107 $4,431,829 $4,478,114 $4,524,978 SUPPLIES, MATERIALS & PARTS 65,223 75,767 66,057 67,098 65,620 CONTRACTED SERVICES 40,209 35,995 42,700 37,700 37,700 OTHER EXPENSES 21,100 22,550 27,050 23,050 23,050 CAPITAL OUTLAY 59,067 0 0 0 0 --- --- --- --- TOTAL $4,642,264 $4,511,419 $4,567,636 $4,605,962 $4,651,348 TRAFFIC SAFETY SALARIES $4,826,084 $4,830,965 $4,894,204 $4,947,695 $5,001,853 SUPPLIES, MATERIALS & PARTS 1,533,576 1,224,657 1,205,169 1,210,041 1,190,334 CONTRACTED SERVICES 2,114,445 2,336,474 2,132,192 2,159,942 2,127,782
OTHER EXPENSES 12,522 22,750 22,750 22,750 22,750
UTILITIES 747,954 929,730 827,230 851,010 875,400
REPAIRS & MAINTENANCE 11,269 10,000 45,000 10,000 10,000
CAPITAL OUTLAY 4,705 3,250 163,250 3,250 3,250
--- --- --- --- TOTAL $9,250,555 $9,357,826 $9,289,795 $9,204,688 $9,231,369
HIGHWAY MAINTENANCE
SALARIES $9,479,864 $9,569,000 $9,692,841 $9,797,590 $9,903,648 SUPPLIES, MATERIALS & PARTS 3,229,650 5,536,600 6,020,752 6,018,257 5,999,763 CONTRACTED SERVICES 2,981,267 2,711,058 2,319,820 2,341,622 2,377,682
OTHER EXPENSES 1,947 6,000 4,000 4,000 4,000
REPAIRS & MAINTENANCE 0 0 52,000 0 0
CAPITAL OUTLAY 315,483 3,000 1,308,000 3,000 3,000
--- --- --- --- TOTAL $16,008,211 $17,825,658 $19,397,413 $18,164,469 18,288,093
Table 4
Road Commission for Oakland County STATEMENT OF PROJECTED EXPENDITURES
Fiscal Year Ending 9/30
2012 2013 2014 2015 2016
EXPENDITURES ACTUAL BUDGET PROJECTION PROJECTION PROJECTION
NON-DEPARTMENTAL
OTHER EXPENSES $1,177,864 $2,314,500 $2,376,700 $2,382,700 $2,423,700 EMPLOYEE BENEFITS 20,166,152 21,348,823 21,936,648 22,891,120 24,067,016 SUPPLIES, MATERIALS, & PARTS 46,552 182,000 182,500 183,000 183,000
CAPITAL OUTLAY 0 0 0 0 0
--- --- --- --- TOTAL $21,390,568 $23,845,323 $24,495,848 $25,456,820 $26,673,716 TOTAL OPER EXPENSES $65,489,651 $70,456,942 $72,915,650 $72,355,720 $73,882,100 IVHS/SEMSIM & SIGNAL PROGRAM 2,441,709 2,525,000 2,675,000 2,725,000 2,725,000
CONTINGENCY RESERVE 0 499,950 500,000 500,000 500,000
ATTRITION/PROGRAM/STAFF CUTS 0 (500,000) (2,900,000) (5,091,770) (5,053,900)
DEBT SERVICE 0 500,000 500,000 500,000 500,000
ROAD IMPROVEMENT PROGRAM 34,943,270 29,620,000 32,000,000 36,025,000 23,275,000 ---
TOTAL EXPENDITURES: $102,874,630 $103,101,892 $105,690,650 $107,013,950 $95,828,200
=========== =========== =========== =========== ===========
TOTAL WAGES & SALARIES $25,320,659 $25,762,338 $26,119,237 $26,404,197 $26,692,719 (INCLUDED ABOVE)
WAGES & SALARIES
AS A % OF TOTAL EXPENDITURES 24.61% 24.99% 24.71% 24.67% 27.85% CAPITAL OUTLAY $805,135 $16,250 $1,813,250 $6,250 $6,250
Table 5
Road Commission for Oakland County
EXPENDITURES BY CATEGORY
FY2012 - 2016
2012 2013 2014 2015 2016 EXPENDITURES ACTUAL BUDGET PROJECTION PROJECTION PROJECTION
SALARIES $25,320,659 $25,762,338 $26,119,237 $26,404,197 $26,692,719 EMPLOYEE BENEFITS 15,302 18,000 18,000 18,000 18,000 SUPPLIES, MATERIALS & PARTS 7,267,508 9,652,302 10,168,475 10,234,103 10,240,082 CONTRACTED SERVICES 5,957,481 6,150,820 5,636,415 5,592,226 5,602,652 OTHER EXPENSES 161,762 175,455 175,015 172,269 170,322 UTILITIES 1,382,460 1,704,730 1,625,480 1,669,170 1,713,980 REPAIRS & MAINTENANCE 3,188,776 3,131,724 2,863,930 2,802,686 2,764,380 CAPITAL OUTLAY 805,135 16,250 1,813,250 6,250 6,250 NON-DEPARTMENTAL 21,390,568 24,345,273 22,595,848 21,365,050 22,619,816 RIP/ITS/SEMSIM/SIG PROJ 37,384,979 32,145,000 34,675,000 38,750,000 26,000,000 TOTAL EXPENDITURES $102,874,630 $103,101,892 $105,690,650 $107,013,951 $95,828,201 SALARIES 24.61% 24.99% 24.71% 24.67% 27.85% EMPLOYEE BENEFITS 0.01% 0.02% 0.02% 0.02% 0.02% SUPPLIES, MATERIALS & PARTS 7.06% 9.36% 9.62% 9.56% 10.69% CONTRACTED SERVICES 5.79% 5.97% 5.33% 5.23% 5.85% OTHER EXPENSES 0.16% 0.17% 0.17% 0.16% 0.18% UTILITIES 1.34% 1.65% 1.54% 1.56% 1.79% REPAIRS & MAINTENANCE 3.10% 3.04% 2.71% 2.62% 2.88% CAPITAL OUTLAY 0.78% 0.02% 1.72% 0.01% 0.01% NON-DEPARTMENTAL 20.79% 23.61% 21.38% 19.96% 23.60% RIP/ITS/SEMSIM/SIG PROJ 36.34% 31.18% 32.81% 36.21% 27.13%
3. Traffic Management System:
In the current planning period, about $2.2 million per year in federal aid is expected for the Traffic Operations Center’s (TOC) signal-operations and maintenance projects. Federal funding has helped RCOC and various communities in Oakland County to execute capital improvements and to offset the cost of operating and maintaining the TOC and the FAST-TRAC real-time advanced traffic management system that utilizes video-imaging vehicle detection. Any costs above the federal funds for operating and maintaining the TOC are funded by RCOC and local communities and budgeted annually.
In order to reduce the traffic signal maintenance costs, RCOC continues to install LED traffic signal heads at intersections throughout the county. The LED signals lower operating costs as a result of their long life (approximately 10 years) and significantly lower electricity usage (less than 1/10th of incandescent light bulbs). Additionally, overhead internally illuminated case signs are being changed to retro-reflective materials that reduce power consumption to zero.
4. Drainage Systems and Structures:
Good drainage and adequately maintained structures are vital to the health of the road network. In the past, RCOC invested in structure maintenance and drainage improvement activities every year. Bridge maintenance included 100 percent RCOC-funded projects without any contribution of local communities, state or federal funds. Drainage improvements were funded by RCOC and the communities, each contributing 50 percent of the costs. The program was called the 50/50 Drainage Program. This program has been eliminated and is not included in the FY2014 to FY2016 RIP. Budget constraints and recent increased use of Tri-Party Program funds for drainage projects contributed to the elimination of the program.
The FY2014 to FY2016 RIP includes bridge maintenance and bridge rehabilitation in each of the three years. The projects are paid for with 100 percent RCOC funds with $925,000 budgeted in FY2014 and $1 million for both FY2015 and FY2016. Through the bridge and culvert inspection process it has been determined that the maintenance and rehabilitation of RCOC bridges and culverts constitute critical needs. By implementing an asset management approach, RCOC can extend the life of these structures at a lower cost in the short term and prevent more costly replacement projects in the future. The RIP also includes funds for bridge replacement projects for structures that are beyond their serviceable life. Approximately $2 million is budgeted each year with the Local Bridge Program providing 95 percent of the replacement costs. RCOC provides the 5 percent local construction match along with any design and right of way costs.
B. PC NETWORK PLAN
Computer systems have become an integral part of RCOC operations due to the increased productivity, instant communication and sophisticated technological solutions they offer. Thus, the Financial Planning Group pays special attention to maintaining all computer systems in reliable condition. The client/server wide-area network (WAN) uses Novell Netware administrative software to connect more than 240 personal computers. Novell GroupWise 7.0 is used for e-mail. Internet and Intranet access and external e-mail services are provided by an Internet Service Provider (ISP).