Matthias Dischinger und Nadine Riedel:
The Role of Headquarters Firms in Multinational Profit
Shifting Strategies
Munich Discussion Paper No. 2010-12
Department of Economics
University of Munich
Volkswirtschaftliche Fakultät
Ludwig-Maximilians-Universität München
The Role of Headquarters Firms in Multinational
Profit Shifting Strategies
Matthias Dischinger
∗University of Munich
Nadine Riedel
†Oxford University CBT & CESifo Munich
February 1, 2010
Abstract
This paper stresses the special role of multinational headquarters in corporate profit shifting strategies. Using a large panel of European firms, we show that multinational enterprises (MNEs) are reluctant to shift profits away from their headquarters even if these are located in high-tax countries. Thus, shifting ac-tivities in response to corporate tax rate differentials between parents and sub-sidiaries are found to be significantly larger if the parent observes a lower corpo-rate tax corpo-rate than its subsidiary and profit is thus shiftedtowards the headquar-ters firm. This result is in line with recent empirical evidence suggesting that MNEs bias the location of profits and highly profitable assets in favor of the headquarters location (for agency cost reasons among others).
Keywords: multinational firm, profit shifting, headquarters location
JEL Classification: H25, H26, C33
∗Department of Economics, University of Munich, Akademiestr. 1/II, 80799 Munich, Germany, phone: +49-89-2180-2279, e-mail: dischinger@lmu.de.
†Oxford University Centre for Business Taxation, Park End Street, Oxford, OX1 1HP, UK, phone: +44-1865-614845, e-mail: nadine.riedel@sbs.ox.ac.uk.
We are indebted to Johannes Becker, Ronald Davis, Michael Devereux, Clemens Fuest, Andreas Hau-fler, Harry Huizinga, Joel Slemrod and Johannes Voget for valuable comments on an earlier version of this paper. Financial support of the German Research Foundation (DFG) is gratefully acknowledged. The Centre for Business Taxation has a number of sources of funding from both public and private sectors. This paper forms part of the work undertaken under Economic and Social Research Council (ESRC) Grant RES-060-25-0033. The views expressed here are those of the authors; the Centre has no corporate views.
1
Introduction
In recent years, the public economics literature brought forward comprehensive empir-ical evidence that multinational enterprises (MNEs) shift paper profits from high-tax to low-tax economies in order to reduce their corporate tax burden. Common profit shifting strategies comprise the tax-favorable distortion of intra-firm transfer prices and the debt-equity-structure or the relocation of highly profitable assets like patents or trademarks to low-tax affiliates (see e.g. Hines and Rice, 1994; Clausing, 2003; De-vereux and Maffini, 2007; Buettner and Wamser, 2007; Dischinger and Riedel, 2010). In consequence, high-tax economies suffer from considerable tax revenue losses. Using information on a sample of European multinationals in 1999, Huizinga and Laeven (2008) for example show that the corporate tax base of Germany, which was the coun-try with the highest corporate tax rate in Europe at that time, would have increased by 14% in the absence of profit shifting incentives.
It is still largely unknown though which companies acutally engage in profit shifting behavior. Existing studies commonly assume shifting activities to be homogeneous across firms. An exception is a small literature which argues that intra-firm transfer prices for firm-specific R&D, innovation and patent rights are hardly observable to tax authorities and tax-related transfer price distortions are hence especially prevalent in R&D intensive firms (see e.g. Grubert, 2003; Overesch and Schreiber, forthcoming). The innovation of our paper is to provide evidence that the degree to which firms engage in profit shifting behaviour moreover depends on the location of the multinational headquarters firm. Precisely, we will show that multinationals are reluctant to shift profits away from their headquarters location, even if the headquarters reside in a high-tax country. Thus, profit shifting activities between parents and subsidiaries tend to be large if the parent firm observes a lower corporate tax rate than its subsidiary and profit is hence shiftedtowards the parent. If the parent is in the contrary located in a high-tax country, income shiftingaway from the parent firm is considerably smaller. The argument follows recent empirical evidence showing that MNEs bias the location of profits and profitable assets in favor of the headquarters location (see Dischinger and Riedel, 2009). This may reflect the central management’s incentive to keep corporate profits under its direct control at the headquarters firm, for example to avoid agency costs which arise if profitable assets and functions are managed by a geographically separated subsidiary abroad (see e.g. Chang and Taylor, 1999; Hamilton and Kashlak, 1999; O’Donnell, 2000). Moreover, the profitability bias may help to justify large wage
payments for the headquarters’ management and workers (see Budd et al., 2005)1 and
to avoid taxes upon the repatriation of profits from the subsidiaries to the parent firm (see Dischinger and Riedel (2009) for a detailed discussion).
In this paper, we assess how the profitability bias in favor of headquarters firms affects corporate profit shifting strategies. Our empirical analysis exploits the firm data base AMADEUS which contains detailed accounting information on European multinational subsidiaries and parent firms for the years 1995 to 2007. Controlling for unobserved heterogeneity across corporate subsidiaries, we test for multinational profit shifting behaviour by determining the sensitivity of the subsidiaries’ pre-tax profitability to changes in their corporate tax rate difference to the parent firm (see e.g. Huizinga and Laeven (2008) for a similar approach). The effect is statistically significant and indicates economically relevant profit shifting behaviour within multinational groups.
Following our argumentation above, we moreover assess whether the profit shifting intensity between subsidiaries and their parent depends on the location of the head-quarters firm in a high-tax or low-tax country. To do so, we split our subsidiary sample in subsamples of firms with a higher and lower corporate tax rate than the parent. The results indicate that profit shifting activities are by more than 50% smaller if the multinational headquarters observe a larger corporate tax rate than the subsidiary compared to the reverse scenario. This indicates that MNEs are eager to shift profits out of high-tax subsidiaries towards low-tax parents but are in the contrary reluctant to shift profits in the opposite direction, from high-tax parents to low-tax affiliates. We run a set of sensitivity checks to assess the robustness of our results which turn out to strengthen the findings.
The rest of the paper is structured as follows: Section 2 presents the data set used for the analysis and Section 3 describes the estimation strategy. In Section 4, the estimation results are presented and Section 5 concludes.
2
Data
Our empirical analysis relies on the commercial database AMADEUS which is compiled by Bureau van Dijk and contains detailed information on firm structure and accounting of national and multinational corporations in Europe. Our sample comprises firms in 1Among others, Budd et al. (2005) show that workers’ wages depend on their affiliate’s profitability.
Consequently, relocating profits between affiliates may affect the wage rate bargained at the firms of a multinational group.
the major countries of EU 27 plus Norway and Switzerland. The time period covered is 1995 to 2007. One major advantage of AMADEUS is that it allows to link accounting information on parent firms and their corporate subsidiaries which makes the data set ideal for our purpose.
Table 1A about here
-For an observation to be included in the sample, it has to belong to a multinational entreprise. The parent firms in our sample are global ultimate owners of a multinational group with at least one wholly-owned subsidiary in a foreign country. Note in this context that the data also comprises parent firms with foreign subsidiaries located outside our European sample countries as AMADEUS provides ownership links to foreign subsidiaries and parents on a worldwide basis although accounting information is available for European firms only. Moreover, to avoid our results to be driven by holding companies, we exclude small parent firms (with less than 25 employees) from the data whose total assets simultaneously comprise an overproportional fraction of financial assets (more than 75%). The subsidiaries in our sample likewise belong to a multinational group in the sense that they are wholly owned by a parent corporation in a foreign country. The subsidiaries may own (further) subsidiaries themselves whereas this is not decisive for our qualitative results. Again, the sample comprises subsidiaries with parent firms outside Europe. The country statistics for the parent and subsidiary sample are presented in Table 1A.2
Note moreover that the AMADEUS data has the drawback that information on the ownership structure is available for the last reported date only which is the year 2007 for most firms in our sample. Thus, in the context of our panel study, there is some scope for misclassifications of parent-subsidiary-connections since the ownership structure may have changed over the sample period. However, in line with previous studies, we are not too concerned about this issue since the described misclassifications introduce noise into our regressions that is expected to bias our results towards zero (see Budd et al., 2005).
2The coverage of firms varies between the countries as Bureau van Dijk draws on different
in-formation sources in different countries which vary in their coverage. Nevertheless, profit shifting is expected to be most pronounced for large multinational firms which tend to be captured in all our sample countries.
Finally, following previous studies (see e.g. Huizinga and Laeven, 2008), we moreover restrict the sample to firms which earn a positive pre-tax profit as taxation is expected to play a significant role in firms with positive profits only.
The observational unit in our regressions is the multinational affiliate, i.e. the parent or subsidiary, per year. The sample statistics are presented in Table 1B and are listed separately for the parent and subsidiary firms in our sample. In total, the data com-prises 83,800 subsidiary observations for 20,704 subsidiary firms and 51,142 parent observations for 12,694 parent corporations. Thus, the subsidiary and parent informa-tion is on average available for 4.05 years and 4.03 respectively. The average subsidiary observes a pre-tax profit of 4.1 million US dollars, and a fixed asset stock and annual payroll sum of 25.7 million US dollars and 6.1 million US dollars respectively. Unsur-prisingly, the average parent firm in our sample is considerably larger than the average subsidiary, exhibiting pre-tax profits of 68.7 million US dollars and a fixed asset stock and annual payroll sum of 577.8 and 94.7 million US dollars.
Table 1B about here
-As will be described in detail in the following section, the paper assesses the profit shifting activities between parent firms and their corporate subsidiaries (see e.g. Dischinger (2008) and Weichenrieder (2009) for a similar approach). The profit shifting incentive is thereby determined by the difference in the statutory corporate tax rate of parents and subsidiaries. For the subsample of subsidiaries, the incentive is captured by the differential between their own statutory tax rate and the statutory tax rate of the parent firm. For the average subsidiary in our sample, this difference is -2.8%, varying strongly between -49% and +53.2%. As our analysis will discriminate between high-tax and low-tax subsidiaries relative to their parent firm, we moreover assess the spread of the tax rate difference in the two sub-groups which turns out to be comparable in terms of both, the absolute subsample averages and the standard deviation.
For the subsample of parent firms, the profit shifting incentive is captured by the unweighted average statutory tax rate difference between the parent and its major-ity owned subsidiary firms worldwide. Analogously to the previous paragraph, the subsidiary list for our European parent firms in the sample comprises subsidiaries in-side and outin-side Europe. Information on the latter affiliates usually includes the host country and the parent’s ownership share. As size information is thus commonly not available, we determine an unweighted average of the tax rate differential between the
parent and its majority owned subsidiaries. In robustness checks, we also experimented with size-weighted averages for the subset of firms for which size information is available and find comparable results.
Furthermore, our analysis will control for other host country characteristics and thus we merge data on GDP, GDP per capita and a corruption index to the firm accounting data.3 As suggested by Table 1A, parent firms mainly tend to reside in the large
and highly developed Western European countries while subsidiary firms are spread across Europe, including Eastern European emerging markets. Hence, unsurprisingly the average subsidiary is located in a smaller market than the average parent firm (subsidiary host countries exhibit a GDP of 0.9 trillion US dollars vs. 1.1 trillion US dollars in parent host countries), in countries with a lower average GDP per capita (23,425 US dollars vs. 29,529 US dollars) and higher levels of corruption (an average Tranparency International corruption index of 6.6 vs. 7.5 in the average parent country, with smaller numbers indicating higher corruption levels).
3
Estimation Strategy
As described above, the aim of our analysis is to empirically determine profit shifting activities between multinational parent firms and their foreign subsidiaries and to assess whether the profit shifting intensity depends on the location of the parent firm in a high-tax or low-tax country relative to its subsidiaries.
We will follow previous studies and quantify profit shifting behaviour between parents and their subsidiaries by regressing affiliate profitability on the tax rate differential between the entities. Our argumentation above suggests that this sensitivity is larger if the parent firm resides in a country with a lower corporate tax rate than its subsidiary as this implies that profit is shifted towards and not away from the parent firm.
To implement this hypothesis empirically, we in a first step exploit the subsidiary sample and estimate a regression model which is captured by the following equation logP BTit=β0+β1T AXDIF Fit+β2(T AXDIF Fit×HT Sit) +β3Xit+ρt+φi+it (1)
whereasP BTit depicts the pre-tax profit of subsidiary i at time t. As the distribution
3The information on statutory tax rates is taken from the European Commission. Country data
for GDP and GDP per capita are obtained from the IMF World Economic Outlook Database October 2008. The Corruption Perceptions Index is taken from Transparency International and ranks from 0 (extreme level of corruption) to 10 (free of corruption).
of the pre-tax profit variable is strongly skewed, we use a logarithmic transformation. The variable of central interest in the analysis isT AXDIF Fit which stands for the
corporate tax rate differential between the considered subsidiaryi and its parent firm in year t. This variable is additionally interacted with a dummy HT Sit that takes on the value 1 if the subsidiary is located in a host country with a larger corporate tax rate than its parent’s host economy and 0 otherwise. The above discussion suggests that the corporate tax rate differential exerts a negative effect on the subsidiary’s pre-tax profitability and hence, β1 < 0. This effects is moreover hypothesized to be larger if
the subsidiary resides in a country with a higher corporate tax rate than the parent firm and hence, we expect β2 <0.
Xit depicts a vector of control variables which comprise the corporate input factors
(fixed asset investment and wage costs) as well as a set of time-varying country con-trols, precisely GDP (to account for market size), GDP per capita (to account for the country’s income and development level) and a corruption index (to account for the quality of governance institutions). Additionally, we include a full set of time fixed effects to account for common shocks to all subsidiaries over time and a full set of one-digit NACE industry-year fixed effects to pick up industry shocks. Moreover, a full set of affiliate fixed effectsφi is included to absorb time constant heterogeneity between
the entities which is also suggested by a Hausman-Test. it depicts the error term.
As a robustness test, we moreover assess our hypothesis at the other end of the profit shifting relation and reestimate equation (??) using the sub-sample of parent firms in our data. To identify high-tax and low-tax parents, we moreover define two parent samples: The first comprises parent firms which tend to be located in a high-tax country compared to their subsidiaries, precisely at least two thirds of the subsidiaries have to observe a lower host-country tax than the parent. Analogously, the second sample comprises parent firms which tend to be located in a country with a lower corporate tax rate than their subsidiaries, precisely at least two thirds of its subsidiaries have to observe a higher corporate tax rate. Note that this analysis is thus by its very nature less precise than the analysis in the subsidiary sample. Moreover, as the cut-off value of two-thirds is adhoc, we experimented with other cut-cut-off thresholds which derives comparable results to the ones reported in this paper.
As described in the previous section, we moreover capture the profit shifting incentive between the parent firm and its subsidiaries by calculating an unweighted average corporate tax rate differential between the parent and the affiliates. Analogously, to equation (??), the tax rate difference is interacted with a dummy variable that takes
on the value 1 if the parent firm is located in a low-tax country (as defined in the previous paragraph) and the value 0 if the parent is locted in a high-tax country (as defined in the previous paragraph). Again, we expect the coefficient estimates for both variables to be negative.
4
Empirical Results
The results are presented in Tables 2 and 3 whereas Table 2 depicts the regressions for the subsidiary sample and Table 3 depicts the regressions for the parent sample. All specifications include a full set of affiliate fixed effects and a full set of year fixed effects. Heterscedasticity robust standard errors which account for clustering at the affiliate level are reported in brackets below the coefficient estimates.
In Column (1) of Table 2, we employ the subsidiary sample and regress the sub-sidiaries’ pre-tax profit on the tax rate differential and its interaction with a dummy that indicates subsidiaries with a higher corporate tax rate than the parent. Simultane-ously, we account for the size of the input factors (the fixed asset stock and the payroll sum) and time-varying country controls. The coefficient estimate for the tax rate dif-ferential is negative and statistically significant, indicating that the multinational firms in our sample engage in profit shifting activities between their parent firms and sub-sidiaries. Moreover, the coefficient estimate for the interaction term equally exhibits a negative sign, thus suggesting that shifting activities are pronouncedly larger if the subsidiary is located in a country with a higher corporate tax rate and hence, profit is shifted from the subsidiary towards the parent firm. This result is confirmed if we additionally control for a full set of industry-year effects in Column (2). Quantitatively, Column (2) indicates that profit-shifting activities between parent firms and their sub-sidiaries are by more than 50% smaller if the parent observes a higher corporate tax rate than the subsidiary compared to the reverse scenario.
Table 2 about here
-In a second step, we moreover run separate estimations for the two sub-samples of high-tax and low-tax subsidiaries. Columns (3) and (4) depict the regression results for the low-tax subsidiary sample. The tax rate differential is found to exert a significantly negative effect on the subsidiaries’ pre-tax profitability indicating that MNEs engage in
profit shifting activities between high-tax parents and low-tax subsidiaries. The semi-elasticity is determined with−0.5. Columns (5) and (6) present the regressions for the subsample of high-tax subsidiaries and equally indicate a significantly negative semi-elasticity. The point estimate is−1.7 and is thus pronouncedly larger in absolute terms than the coefficient estimate for the low-tax subsidiary sample. Moreover, the coefficient estimates statistically differ at the 10% significance level. Thus, in quantitative terms, the estimations suggest that the sensitivity of the subsidiary’s pre-tax profitability to changes in the tax rate difference is by 77% smaller if the subsidiary observes a lower corporate tax rate than the parent.
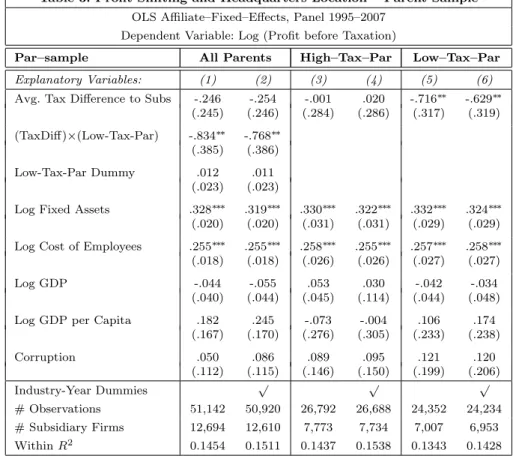
As a robustness test, we additionally analyze the other endpoint of the profit shifting linkage between parents and subsidiaries and focus on the sub-sample of parent firms. As described in the previous section, we expect that parent firms located in low-tax countries tend to react more sensitively to tax rate differences than parent firms located in high-tax countries. Specifications (1) and (2) present regressions of the parent firm’s pre-tax profitability on the average tax rate difference to the subsidiary firms and its interaction term with a dummy indicating parent firms in low-tax countries.4 Both coefficient estimates are negative whereas, however, only the coefficient estimate for the interaction term gains statistical significance. This indicates that it is mainly par-ent firms in low-tax economies whose profitability reacts sensitively to changes in the corporate tax rate differential, thus supporting the hypothesis that especially low-tax parents engage in significant profit shifting activities.5
Table 3 about here
-This result is supported by the specifications presented in Columns (3) to (6) which estimate the regressions separately for parents in high- and low-tax countries. Again, we find that significant effects prevail only in the latter subsample, suggesting that 4Following, our description in Section??, the parent dummy variable takes on the value 1 (0) if
the parent firm tends to be located in a country with a smaller (higher) corporate tax rate than two thirds of its majority-owned subsidiaries.
5In general, the analysis using the parent sample is less precise than the analysis in the subsidiary
sample though as it requires to determine low and high-tax parent firm with respect to all their subsidiaries. Since parent firms may simultaneously observe subsidiaries in countries with a higher and lower tax rate, this requires additional assumptions. As described in the previous section, we consider a subset of ‘extreme’ parents with more than two thirds of the subsidiaries being located in high and low-tax countries respectively.
MNEs are indeed reluctant to shift profits away from parent corporations, even if they are located in a high-tax country.
In a second robustness check, we moreover assess whether our results are driven by heterogeneity of multinational groups in other dimensions. To do so, we first account for the possibility that profit shifting behaviour may be determined by the relative size of the shifting entities. If profit is, for example, shifted from a large high-tax entity to a small low-tax entity, the shifting volume may be restricted by the low-tax affiliate’s ability to absorb and conceal the shifting volume. This might imply that the optimal shifting volume is large from the viewpoint of the small low-tax affiliate and hence strongly impacts on its pre-tax profitability while it is low from the viewpoint of the large high-tax affiliate and hence only weakly impacts on its pre-tax profitability. To account for that, we define a measure of the relative size of the shifting entities, precisely the logarithm of the ratio of the subsidiary’s total assets over the parent’s total asset. In Columns (1) and (2) of Table 4, we reestimate the Specifications (1) and (2) of Table 2 additionally including the relative size ratio and the interaction of the relative size ratio with the tax difference measure. While the coefficient estimate for the latter term turns out to be statistically insignificant, our baseline results prevail suggesting that profit shifting activities between parents and subsidiaries mainly run from high-tax subsidiaries to low-tax parents.6
Table 4 about here
-Moreover, profit shifting volumes between parents and subsidiaries may clearly de-pend on the number of subsidiaries and hence on the number of potential shifting partners within the multinational group. To account for that, we moreover reestimate Specifications (1) and (2) of Table 2 additionally including an interaction term of the logarithm of the number group subsidiaries and the corporate tax rate differential. As information on the number of subsidiaries is available in a cross-sectional dimension only, the information is absorbed by the subsidiary fixed effect. The results are depicted in Columns (3) and (4) of Table 4 and confirm our previous findings in the sense that 6Note that the robustness check comes at the costs of a reduced sample size as information on the
size of the parent firm is not available for all subsidiaries in our sample (as some subsidiaries e.g. observe non-European parent firms for which accounting information is not contained in the AMADEUS data or European parents for which unconsolidated accounting information is unavailable).
significant and economically large shifting activities are determined between high-tax subsidiaries and low-tax parent firms only.7
5
Conclusions
With the continuously rising economic importance of multinational firms, policy makers and researchers have increasingly worried about multinational tax planning strategies which involve paper profit shifting from high-tax to low-tax economies by distorting intra-firm transfer prices, the debt-equity structure or the location of value-driving assets. The topic receives especially high attention since a rising number of papers has presented empirical evidence that profit shifting activities are quantitatively large and deteriorate the corporate tax base of high-tax economies around the world. Thus, in recent year an increasing number of countries have introduced or tightened anti-shifting legislations, for example strengthened thin-capitalization rules or introduced transfer price documentation requirements (see e.g. Buettner, et al. 2006).
Our paper contributes to the profit shifting literature by showing that profit shifting behaviour is not homogeneous across MNEs but that multinational corporations are reluctant to relocate profits away from their headquarters firms even if these reside in a high-tax country. Thus, shifting volumes between parents and subsidiaries tend to be large if parent firms exhibit a lower corporate tax rate than their corporate subsidiaries and hence, profit is shifted towards the parent firm, while they in the contrary tend to be small in the opposite scenario when profits are shifted away from high-tax parents. Quantitatively, the estimations suggest that shifting (as measured by the profit sensitivity to changes in the tax rate differential) is by more than 50% reduced in the latter case.
This implies that hosting multinational headquarters firms tends to hedge high-tax countries against large paper profit outflows through multinational shifting activities. Thus, complementary to the introduction and tightening of other anti-shifting measures like transfer pricing or thin-capitalization rules, countries may consider to fight profit shifting activities by fostering the location of headquarters firms within their borders. Recent government interventions which aimed at attracting and retaining headquarters firms suggest that this is already taking place. Thus, recent years have for example seen several attempts of governments to influence international mergers and acquisitions in 7Again due to missing parent information, the robustness check comes at the costs of a reduced
order to avoid national firms to be taken over by foreign companies and to create successful national champions.
6
References
Budd, J.W., J. Konings and M.J. Slaughter (2005), Wages and International Rent Sharing in Multinational Firms, The Review of Economics and Statistics 87(1), 73-84.
Buettner, T., and G. Wamser (2007), Intercompany Loans and Profit Shifting - Evidence from Company Level Data, CES ifo Working Paper No. 1959, 2007.
Buettner, T., G. Wamser, M. Overesch, and U. Schreiber (2006), The Impact of Thin-Capitalization Rules on Multinationals’ Financing and Investment Decisions, CESifo Working Paper Nr. 1817, 2006. Chang, E., and M. S. Taylor (1999), Control in Multinational Corporations (MNCs): The Case of Korean Manufacturing Subsidiaries, Journal of Management, 25(4), 541565.
Clausing, K. (2003), Tax-Motivated Transfer Pricing and U.S. Intrafirm Trade Prices, Journal of Public Economics 87, 2207-2223.
Devereux, M.P. and G. Maffini (2007), The Impact of Taxation on the Location of Capital, Firms and Profit: A Survey of the Empirical Evidence, CBT Working Paper 07/02.
Dischinger, M. (2008), Profit Shifting by Multinationals and the Ownership Share: Evidence from European Micro Data, Munich Economics Discussion Papers, No. 2008-17 (Aug. 2008).
Dischinger, M., and N. Riedel (2009), There’s No Place Like Home: The Profitability Gap between Headquarters and their Foreign Subsidiaries, CESifo Working Paper No. 2866.
Dischinger, M., and N. Riedel (2010), Corporate Taxes and the Location of Intangible Assets within Multinational Firms, Munich Economics Discussion Paper No. 2010-9.
Grubert, H. (2003), Intangible Income, Intercompany Transactions, Income Shifting, and the Choice of Location, National Tax Journal 56(1), 221-242.
Hamilton, R. D., and R. J. Kashlak (1999), National Influences on Multinational Corporation Control System Selection, Management International Review, 39(2), 167189.
Hines, J.R., and E. Rice (1994), Fiscal Paradise: Foreign Tax Havens and American Business, Quarterly Journal of Economics, 109, 149-82.
Huizinga, H., and L. Laeven (2008), International Profit Shifting within Multinationals: A Multi-Country Perspective, Journal of Public Economics 92(5-6), 1164-1182.
O’Donnell, S. W. (2000), Managing Foreign Subsidiaries: Agents of Headquarters, or an Interdepen-dent Network?, Strategic Management Journal, 21, 525548.
Overesch, M., and U. Schreiber (forthcoming), Asset Specificity, International Profit Shifting and Investment Decisions, Zeitschrift fuer Betriebswirtschaftslehre.
Weichenrieder, A. (2009), Profit Shifting in the EU: Evidence from Germany, International Tax and Public Finance 16, pp. 197-281.
7
Appendix
Table 1A: Country Statistics
Variable Subsidiaries Parents
Austria 193 156 Belgium 1,008 782 Bulgaria 550 8 Czech Republic 465 76 Denmark 874 849 Estonia 365 30 Finland 558 285 France 1,729 1,630 Germany 1,292 1,417 Great Britain 3,416 1,325 Hungary 80 20 Ireland 31 76 Italy 1,014 1,518 Luxembourg 110 65 Latvia 14 0 Netherlands 750 1,250 Norway 407 331 Poland 1,018 62 Portugal 257 120 Romania 4,174 13 Slovakia 85 7 Spain 1,536 1,433 Sweden 777 1,073 Switzerland 1 168 Sum 20,704 12,694
Table 1B: Descriptive Statistics
Variable Obs. Mean Std. Dev. Min. Max.
Subsidiary Sample
Pre-tax Profits∗ 83,800 4,062.4 50,049.3 1 8,055,052 Fixed Assets∗ 83,800 25,653.2 429,889.9 1 4.61e+07
Cost of Employees∗ 83,800 6,077.7 43,943.4 1 6,326,555
Tax Rate Difference to Par∗∗ 83,800 -.028 .099 -.490 .532
Tax Rate Difference to Par∗∗, High-tax Subs 31,701 .069 .065 .0001 .532 Tax Rate Difference to Par∗∗, Low-tax Subs 52,099 -.087 .063 -.490 -.0001
GDPN 83,800 895.9 854.0 5.6 3,320.9
GDP per Capita∗ 83,800 23,424.6 13,958.5 1,566.9 103,125 Corruption Index 83,800 6.5 2.2 2.6 10.0
Parent Sample
Pre-tax Profits∗ 51,142 68,711.1 581,872.2 1 4.47e+07 Fixed Assets∗ 51,142 577,818 4,054,623 2 2.41e+08 Cost of Employees∗ 51,142 94,717.0 556,298.8 1 2.26e+07
Avg. Tax Rate Difference to Subs∗∗∗ 51,142 .014 .087 -.395 .432 GDPN 51,142 1,100.1 812.1 5.6 3,320.9
GDP per Capita∗ 51,142 29,529.7 10,302.4 1,566.9 89,923.2
Corruption IndexF 51,142 7.5 1.5 2.6 10
Notes:
∗: in thousands of US dollars;∗∗: difference in the statutory corporate tax rates of the considered subsidiary and its
parent firm;∗∗: unweighted average tax rate difference between the considered parent firm and all majority-owned
sub-sidiaries (inside and outside our European sample countries);N: in billion of US dollars;F: Transparency International’s
Table 2: Profit Shifting and Headquarters Location – Subsidiary Sample
OLS Affiliate–Fixed–Effects, Panel 1995–2007 Dependent Variable: Log (Profit before Taxation)
Sub–sample All Subsidiaries Low–Tax–Subs High–Tax–Subs
Explanatory Variables: (1) (2) (3) (4) (5) (6)
Tax Difference to Parent -.530∗∗∗ -.507∗∗∗ -.549∗∗ -.507∗∗∗ -1.701∗∗∗ -1.696∗∗∗ (.178) (.181) (.194) (.198) (.366) (.367) (TaxDiff)×(High-Tax-Subs) -.629∗ -.641∗
(.384) (.384) High-Tax-Subs Dummy .050∗∗ .052∗∗∗ (.021) (.021)
Log Fixed Assets .094∗∗∗ .093 .094∗∗∗ .093∗∗∗ .096∗∗∗ .097∗∗∗ (.007) (.008) (.009) (.010) (.013) (.013) Log Cost of Employees .384∗∗∗ .385∗∗∗ .377∗∗∗ .381∗∗∗ .388∗∗∗ .383∗∗∗ (.013) (.013) (.015) (.016) (.025) (.026) Log GDP -.032 -.051 -.031 -.042 -.072 -.074∗ (.038) (.047) (.050) (.062) (.045) (.043) Log GDP per Capita -.011 .052 -.046 .019 .426∗∗ .519∗∗∗ (.072) (.077) (.088) (.095) (.202) (.202) Corruption .032∗∗ .031∗∗ -.228∗ -.258∗∗ .465∗∗∗ .454∗∗∗ (.015) (.015) (.122) (.123) (.137) (.137) Industry-Year Dummies √ √ √ # Observations 83,800 83,108 52,099 51,548 31,701 31,560 # Affiliates 20,704 20,449 14,805 14,592 9,039 8,981 WithinR2 0.1605 0.1639 0.1583 0.1634 0.1521 0.1578
Notes: Heteroscedasticity robust standard errors adjusted for firm clusters in parentheses.
∗, ∗∗, ∗∗∗ indicates significance at the 10%, 5%, 1% level. Observational units are profit-making multinational
subsidiariesper year. All specifications include a full set of affiliate dummies and a full set of year dummies. Sub-sample
High(Low)–Tax–Subs consists solely of subsidiaries that exhibit a higher (lower) statutory corporate tax rate than their parent firm.Tax Difference to Parent equals the subsidiary tax rate minus the parent tax rate.High-Tax-Subs Dummy is set to 1 if an observational unit exhibit a higher tax rate than the parent and set to 0 otherwise.
(TaxDiff )×(High-Tax-Subs)is the interaction term betweenTax Difference to ParentandHigh-Tax-Subs Dummy. 130 industry-year dummies (NACE Rev.1 1-digit level) are included where indicated.
Table 3: Profit Shifting and Headquarters Location – Parent Sample
OLS Affiliate–Fixed–Effects, Panel 1995–2007 Dependent Variable: Log (Profit before Taxation)
Par–sample All Parents High–Tax–Par Low–Tax–Par
Explanatory Variables: (1) (2) (3) (4) (5) (6)
Avg. Tax Difference to Subs -.246 -.254 -.001 .020 -.716∗∗ -.629∗∗
(.245) (.246) (.284) (.286) (.317) (.319) (TaxDiff)×(Low-Tax-Par) -.834∗∗ -.768∗∗
(.385) (.386) Low-Tax-Par Dummy .012 .011
(.023) (.023)
Log Fixed Assets .328∗∗∗ .319∗∗∗ .330∗∗∗ .322∗∗∗ .332∗∗∗ .324∗∗∗
(.020) (.020) (.031) (.031) (.029) (.029) Log Cost of Employees .255∗∗∗ .255∗∗∗ .258∗∗∗ .255∗∗∗ .257∗∗∗ .258∗∗∗
(.018) (.018) (.026) (.026) (.027) (.027) Log GDP -.044 -.055 .053 .030 -.042 -.034 (.040) (.044) (.045) (.114) (.044) (.048) Log GDP per Capita .182 .245 -.073 -.004 .106 .174
(.167) (.170) (.276) (.305) (.233) (.238) Corruption .050 .086 .089 .095 .121 .120 (.112) (.115) (.146) (.150) (.199) (.206) Industry-Year Dummies √ √ √ # Observations 51,142 50,920 26,792 26,688 24,352 24,234 # Subsidiary Firms 12,694 12,610 7,773 7,734 7,007 6,953 WithinR2 0.1454 0.1511 0.1437 0.1538 0.1343 0.1428
Notes: Heteroscedasticity robust standard errors adjusted for firm clusters in parentheses.
∗,∗∗,∗∗∗indicates significance at the 10%, 5%, 1% level. Observational units are profit-makingmultinational parents
per year. All specifications include a full set of affiliate fixed effects and a full set of year fixed effects. Subsamples
High(Low)–Tax–Par consists solely of parent firms that exhibit a higher (lower) statutory corporate tax rate than at least two thirds of their subsidiaries. Avg. Tax Difference to Subsidiaries equals the unweighted average difference between the considered parent firm’s statutory corporate tax rate and the statutory corporate tax of all majority owned subsidiaries. The variableLow-Tax-Par is a dummy set to 1 if the parent exhibits a lower corporate tax rate than at least two thirds of its subsidiaries and takes on the value 0 if at least two thirds of the subsidiaries exhibit a larger corporate tax rate than the parent.(TaxDiff )×(Low-Tax-Par)is the interaction term betweenTax Difference to Subsidiariesand theLow-Tax-Par Dummy. 130 industry-year dummies (NACE Rev.1 1-digit level) are included where indicated.
Table 4: Robustness Checks – Subsidiary Sample
OLS Firm–Fixed–Effects, Panel 1995–2007 Dependent Variable: Log (Profit before Taxation)
Par–sample Relative Size Subsidiary Number
Explanatory Variables: (1) (2) (3) (4)
Tax Difference to Parent -.332 -.327 .545 .525 (.356) (.351) (.690) (.698) (TaxDiff)×(High-Tax-Subs) -.774∗ -.726∗ -1.305∗ -1.227∗
(.448) (.447) (.732) (.727) High-Tax-Subs Dummy .039∗ .040∗ -.001 .003
(.023) (.023) (.034) (.034) (TaxDiff)×(Log Rel. Size) -.064 -.075
(.104) (.100) Log Relative Size .692∗∗∗ .695∗∗∗
(.025) (.024)
(TaxDiff)×(Log Number Subs) -.139 -.153 (.179) (.182) Log Fixed Assets -.033∗∗∗ -.033∗∗∗ .102∗∗∗ .104∗∗∗
(.009) (.009) (.015) (.015) Log Cost of Employees .260∗∗∗ .261∗∗∗ .399∗∗∗ .404∗∗∗
(.017) (.017) (.026) (.026) Log GDP -.021 -.030 -.010 -.011 (.046) (.051) (.055) (.061) Log GDP per Capita .401∗∗∗ .417∗∗∗ .629∗∗∗ .614∗∗∗ (.109) (.111) (.158) (.160) Corruption .038∗∗ .038∗∗ .044∗ .048∗ (.017) (.016) (.025) (.026) Industry-Year Dummies √ √ # Observations 55,664 55,353 24,534 24,404 # Subsidiary Firms 12,380 12,277 6,237 6,191 WithinR2 0.2132 0.2165 0.1629 0.1687 Notes: Heteroscedasticity robust standard errors adjusted for firm clusters in parentheses.
∗, ∗∗, ∗∗∗ indicates significance at the 10%, 5%, 1% level. Observational units are profit-making multinational
subsidiaries per year. All specifications include a full set of affiliate fixed effects and a full set of year fixed effects. Sub-sample High(Low)–Tax–Subs consists solely of subsidiaries that exhibit a higher (lower) statutory corporate tax rate than their parent firm.Tax Difference to Parent equals the subsidiary tax rate minus the parent tax rate.
High-Tax-Subs Dummy is set to 1 if an observational unit exhibit a higher tax rate than the parent and set to 0 otherwise.(TaxDiff )×(High-Tax-Subs)is the interaction term between Tax Difference to Parent andHigh-Tax-Subs Dummy. 130 industry-year dummies (NACE Rev.1 1-digit level) are included where indicated.Log Relative Sizeis the logarithm of subsidiary total assets over parent total assets. (TaxDiff)×(Log Rel. Size) is the interaction term between
Tax Difference to ParentandLog Relative Size.Log. Number Subsis the logarithm of the parent firm’s overall number of subsidiaries. (TaxDiff )×(Log. Number Subs) is the interaction term between Tax Difference to Parent and Log Number Subs.