Workload-Aware Load Balancing for Clustered Web Servers
∗Qi Zhang1 Alma Riska2 Wei Sun3 Evgenia Smirni1 Gianfranco Ciardo4 1Department of Computer Science, College of William and Mary
2Interfaces and Architecture Group, Seagate Research 3Symantec Corporation
4 Department of Computer Science and Engineering, University of California at Riverside
Abstract
We focus on load balancing policies for homogeneous clustered web servers that tune their param-eters on-the-fly to adapt to changes in the arrival rates and service times of incoming requests. The proposed scheduling policy, ADAPTLOAD, monitors the incoming workload and self-adjusts its balanc-ing parameters accordbalanc-ing to changes in the operational environment such as rapid fluctuations in the arrival rates or document popularity. Using actual traces from the 1998 World Cup web site, we conduct a detailed characterization of the workload demands and demonstrate how on-line workload monitoring can play a significant part in meeting the performance challenges of robust policy design. We show that the proposed load balancing policy based on statistical information derived from recent workload history provides similar performance benefits as locality-aware allocation schemes, without requiring locality data. Extensive experimentation indicates that ADAPTLOADresults in an effective scheme, even when servers must support both static and dynamic web pages.
Keywords: clustered web servers, self-managing clusters, load balance, locality awareness,
work-load characterization, static and dynamic pages.
1
Introduction
The wide deployment of web browsers as the standard interface for IT applications such as news sites, e-commerce stores, and search engines makes web server clusters the architecture of choice. Serving the ever-increasing and diversified customer population in such systems while ensuring high availability in a cost-effective way is a challenge. Service replication is the obvious vehicle to achieve scalability and avail-ability, but this requires robust load balancing policies, especially given the complexity of the workload characteristics experienced by a web cluster. Contemporary servers provide not only static and read-only in-formation, but also personalized dynamic pages created on demand. This, in conjunction with bursty client request rates that fluctuate dramatically even within short periods of time and the wide disparity of per-request CPU and I/O resource requirements, further complicates resource allocation in web server clusters. Being able to swiftly adapt the scheduling policy to the workload without human intervention is critical for the commercial success of web sites [21].
In this paper, we focus on self-adjusting strategies for effective load balancing in a locally-distributed web server cluster that provides replicated services. We assume a web server architecture consisting of a front-end device (commonly called a web switch) and a set of homogeneous, back-end web server nodes.
∗This work was partially supported by the National Science Foundation under grants EIA-9974992, CCR-0098278, and ACI-0090221. A preliminary version of this paper appeared at the22th
International Conference on Distributed Computer Systems, (ICDCS’02), pages 103–111, Vienna, Austria, July 2002.
The switch acts as the initial interface between the cluster nodes and the Internet, and distributes the incoming requests to the servers, trying to balance the load among them. The server nodes are responsible for serving individual requests [2]; in particular, a server node handles requests for static content located either in its local memory or in its local disk, while dynamic requests are forwarded first to a specialized server, e.g., a database server, before they can be transmitted to the client by the server node.
A robust self-tuned load balancing policy in such an environment is critical for high performance. Previ-ous research addressed issues of scalability, availability, and quality of service support within the context of load balancing in clustered web servers. For a comprehensive survey see [11]. However, most of these classic works on task assignment assume that job service requirements follow the well-behaved exponential distri-bution, thus they are less effective when the workload has highly variable arrival and service processes [23]. High variability in the arrival rates can be due to periodicity, e.g., dependence on the time of the day or day of the week, may be triggered by unpredictable events, e.g., breaking news in a news site, or may be due to the nature of Internet itself: bursty arrivals can lead to periods of transient overload where the number of requests in the system increases dramatically within a very short time period. Effective load balancing policies should offer rapid system adaptation under transient overload conditions. Variability in the service process becomes an additional obstacle to effective load balancing. For static requests, it is well-documented that the size of web documents (and consequently their service demands) follows heavy-tailed distributions [4, 7], while, for dynamic requests, there is virtually no correlation between document size and service demand.
Our thesis is that an effective load balancing policy must self-adjust its parameters as the arrival and service characteristics of the incoming workload change. In [23], we proposed a new policy named ADAPT -LOAD and gave a proof of concept that dynamically re-adjusting its parameters based on the monitored workload is a promising approach. ADAPTLOADadvocates dedicating servers to requests of similar size, with the aim of reducing the average job slowdown through separation of long and short jobs. The policy is based on the empirical distribution of the workload resource demands, i.e., the request sizes and their frequencies. Given that there areN identical servers, request sizes are partitioned intoN disjoint intervals,
[s0 ≡0, s1),[s1, s2), up to[sN−1, sN ≡ ∞), so that serveri, for1 ≤i≤N, is responsible for satisfying
requests whose size falls in theithinterval. Each request is forwarded to the appropriate server as determined
by its size. The key idea is to set the intervals so that each server is subject to a similar overall load.
While this approach is feasible postmortem, the ability to predict the request size distribution of the incoming workload is critical to the effectiveness of ADAPTLOAD in any practical setting. Using actual workload traces from the 1998 World Cup Soccer web site, we gave a first proof of concept using a simple simulation model; under certain assumptions, ADAPTLOADwas shown to be a promising load balancing policy in a constantly changing environment [23] and to effectively set its interval boundaries according to the current workload characteristics.
In this paper, we present a detailed simulation study of ADAPTLOAD’s performance under realistic ar-chitectural assumptions. First, by its nature, ADAPTLOADbehaves similarly to a “locality-aware” allocation policy [22], since it directs requests for the same document to the same server (unless changes in the request distribution force the interval boundaries to change, in which case requests for some documents will be di-rected to a different server). We conduct a workload characterization study and quantify the performance benefits of the implicit caching achieved by ADAPTLOAD. Furthermore, we compare its performance with
LARD, a locality-aware policy that aims to balance the load while achieving the benefits of explicit caching through a request assignment based on the contents of each server’s cache [22].
Second, we address the policy fairness by presenting a statistical performance study for various job sizes. Slowdown percentiles across the spectrum of job sizes indicate that ADAPTLOAD is able to consistently service all resource queues under transient overload conditions.
dynamic pages. For static pages, the size of the file returned in response to a request is a good characteri-zation of the length of the job, but this is not true for dynamic pages. Through experimentation, we show that ADAPTLOADcompares favorably to classic load balancing policies and that determining the interval boundaries from information on the static portion of the workload alone is effective even in the presence of moderately mixed workloads.
Our paper is organized as follows. Section 2 summarizes related work. Section 3 presents a detailed characterization of the workload used to drive our simulations, focusing on its transient characteristics. A detailed description of ADAPTLOADis presented in Section 4. Section 5 describes the architecture of the web server cluster we consider. Section 6 presents an analysis of the policy’s performance focusing on the implicit caching achieved by ADAPTLOAD. The behavior of the policy in the presence of both static and
dynamic pages is considered in Section 7 while an improved version of ADAPTLOADis presented in Section 8. Finally, Section 9 summarizes our contributions and outlines future work.
2
Related work
In a typical clustered web server system, URL requests arrive at a switch [10] responsible for routing requests to the server nodes [12, 14, 16, 22] according to a scheduling policy aimed at optimizing some performance measure, e.g., maximizing the number of network connections or minimizing the server expected response time. Many implementation alternatives (DNS-based, dispatcher-based at the network level, and server-based) exist to schedule client requests among multiple server nodes and provide load balancing coupled with high scalability and availability (see [11] for a survey of dynamic load balancing policies in web server clusters).
There is a significant body of research in task scheduling and load balancing, but the common assumption is that each job’s service requirement is exponentially distributed (see [17] and references therein). These traditional policies fail to balance the load if the workload is long tailed [17]. Instead, for long-tailed work-loads, there is an increasing trend toward policies that strive to avoid serving “long” and “short” jobs at the same server node [13, 16]. Furthermore, “locality-aware” policies that base their load balancing decisions on the cache contents of the server nodes have been shown to achieve superior performance [22].
If the workload (i.e., the distribution of file popularity) is known a priori, size-based policies have been shown to do well [13, 16]. Such policies easily apply to systems that support static pages. With regard to dynamic pages, there have been significant efforts in characterizing and modeling requests for personalized content [5, 9, 24, 25]. Web server data on actual e-commerce sites are nearly impossible to obtain as studies on such systems are subject to non-disclosure agreements. Consequently, one can only resort to synthetic workload generators to study such systems, the most prominent being the TPC-W benchmark [15]. Studies based on the TPC-W and its variants focus on bottleneck identification [1, 26, 20], and there is consensus that the CPU of the database server is almost always the bottleneck.
In this paper, we first assume that the workload is composed only of static pages but there is no a priori knowledge of the file popularity. Our work is in the same spirit as those in [13, 16] but, unlike them, it considers load-balancing as an on-line problem where the interval boundaries are periodically adjusted according to fluctuations in the workload arrival rate and service demands. Then, we show that size-based policies can be effective even for workloads that support both static and dynamic pages: using an on-line size-based policy even just for a portion of the workload (i.e., its static part) can result in effective load balancing.
Number of unique files Mean (byte) Median (byte) Maximum (Mbyte) Total Size (Mbyte)
17,332 11,786 3,714 3.1 194.7
Table 1: Statistical information regarding the unique files requested on June 24. Number of requests Mean (byte) Median (byte) Total Transferred (Mbyte)
38,834,515 5,248.5 963 189,800
Table 2: Statistical information regarding the total files requested on June 24.
3
The workload
In our evaluation of ADAPTLOAD, we use traces from the 1998 World Soccer Cup web site1. The server for this site was composed of 30 low-latency platforms distributed across four physical locations. Client requests were dispatched to a location via a Cisco Distributed Director, and each location was responsible for load balancing the incoming requests among its servers. Trace data were collected during 92 days, from April 26, 1998 to July 26, 1998, when the server was operational. For each request, the following information was recorded: IP address of the client issuing the request, date and time of the request, URL requested, HTTP response status code, and content length (in bytes) of the transferred document. The web site contained static pages only. For a detailed analysis of the World Cup workload see [4].
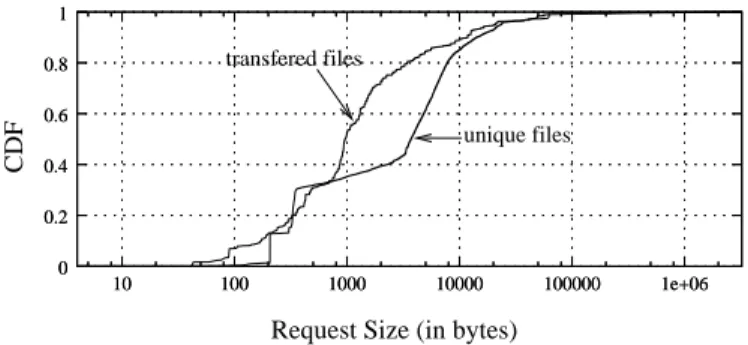
We focus on a single day of the trace (June 24), which we selected as representative. On that day, more than 38 million requests for 17,322 distinct files were successfully served and recorded in the trace. Tables 1 and 2 presents the statistics of the unique file size distribution and total file transfers, respectively. Note the disparity between mean and median in Table 1 and between the means in Tables 1 and 2, as well as the maximum document size. All indicate the presence of a long-tailed workload2. This is further confirmed by the cumulative distribution function (CDF) of the unique file sizes and total file transfers. Figure 1 clearly indicates that the majority of transfers are due to small files and only a small percentage is due to a few very large files.
We now turn to the request arrival rate and its relationship to the average request size. Figure 2(a) plots the number of request arrivals per minute as a function of time: there is a huge variability in the arrival rate over the course of the day, with two peaks during the evening hours. Figures 2(b) and 2(c) show the average and the coefficient of variation (C.V.) of the request size (during each minute) as a function of time: there is significant variability in the average request size during the course of the day, and coefficients of variation as high as ten indicate the presence of heavy tails. Note also the inverse behavior between workload arrival rate and service distribution: the two peaks in Figure 2(a) correspond to lower coefficients of variation in Figure 2(c). Similar characteristics are observed for nearly every high traffic day of the World Cup trace.
This analysis illustrates the difficulties in policy parameterization: the parameters need fast adaptation to changes in the request distribution, which can vary dramatically from one minute to the next within the course of a day. The next section discusses the sensitivity of the policy to the workload characteristics and alternatives to improve its robustness.
1
Available from the Internet Traffic Archive athttp://ita.ee.lbl.gov/.
2Reference [4] suggests that this workload can be effectively modeled using a hybrid distribution: a Lognormal distribution for
unique files transfered files 0 0.2 0.4 0.6 0.8 1 10 100 1000 10000 100000 1e+06 0 0.2 0.4 0.6 0.8 1 10 100 1000 10000 100000 1e+06 CDF
Request Size (in bytes)
Figure 1: CDFs of the unique and total file transfers on June 24.
(a) Arrival intensity: number of requests per minute
(b) Average request size
(c) C.V. of request size 6am 12pm 6pm 12am 6am 6am 12pm 12pm 6pm 6pm 12am 12am 4000 5000 6000 7000 8000 0 10000 20000 30000 40000 50000 60000 70000 80000 90000
Time (in seconds) Time (in seconds)
0 20000 40000 60000 80000 100000 0 10000 20000 30000 40000 50000 60000 70000 80000 90000 Requests
Time (in seconds)
Aver. Req. Size (Bytes)
CV of Request Size 10 2 4 6 8 0 10000 20000 30000 40000 50000 60000 70000 80000 90000
Figure 2: Arrival and service characteristics of requests on June 24.
4
A
DAPTL
OAD: on-line load balancing
In a cluster withN server nodes, ADAPTLOADrequires partitioning the possible request sizes intoN
inter-vals,{[s0 ≡0, s1),[s1, s2), . . . ,[sN−1, sN ≡ ∞)}, so that serveri, for1 ≤ n≤N, is assigned to satisfy
the requests for files with size falling in thenthinterval,[s
n−1, sn). The value of theN −1size boundaries
s1, s2, . . . , sN−1 is critical, as it determines the load seen by each server. These boundaries should result
in a uniform expected slowdown (defined as the ratio of the actual response time for a request to the ideal response time it would experience if it were serviced immediately) at each server, by providing each server
with approximately the same load. Since we are considering an homogeneous cluster, each interval should be set so that the requests routed to the corresponding server contribute a fraction1/N to the value of the expected total number of requested bytes,S. In other words, we should have, for1≤n≤N,
Z sn sn−1 x·dF(x)≈ 1 N Z ∞ 0 x·dF(x) = S N,
whereF(x) is the CDF of the request sizes. If the cluster consisted of heterogeneous servers, the policy could be extended to account for different server speeds, i.e., if server i’s speed is bi, then ADAPTLOAD
would allocate a fractionbi/PNj=1bj of the total load to serveri.
ADAPTLOADbuilds a discrete data histogram (DDH) encoding the empirical size distribution of batches ofK requests as they arrive in the system. Since ADAPTLOADis an online algorithm, it must manipulate DDHs efficiently, i.e., in constant time per request. To achieve this goal, we represent each DDH using a vectorV with a constant numberF of bins; for1≤f ≤F, thefthbinV[f]accumulates the total number
of bytes due to requests for files with size betweenCf−1andCf, whereCis some real constant greater than
one (using a value ofC close to one results in a fine DDH representation, but also in a larger value forF, sinceCF must exceed the size of the largest file that may be requested). Accordingly, the boundaries are
expressed in terms of bin indices, not actual file sizes.
Since a significant portion of the workload consists of a few popular files, it may not be possible to select
N distinct boundaries and still ensure that each interval[sn−1, sn)corresponds to a fraction1/N of the load.
This forces us to introduce “fuzzy” boundaries: we associate a probabilitypnto every boundary pointsn,
for1 ≤ n < N, expressing the portion of the requests for files of sizesnthat is to be served by servern.
The remaining portion1−pnof requests for this file size is served by servern+ 1, or even higher-numbered
servers. Thus, the boundaries are expressed as a sequence of N −1 pairs,[(sn, pn) : 1 ≤ n < N −1].
If many requests are for files of similar, but not exactly equal, size, ADAPTLOADworks well because it
nevertheless assigns these files to different bins. If many requests are for the same few files having exactly the same size, the “fuzzy” boundaries eventually cause multiple servers to have these files in their cache; at that point, ADAPTLOAD acts appropriately and balances the load among these servers. A case where
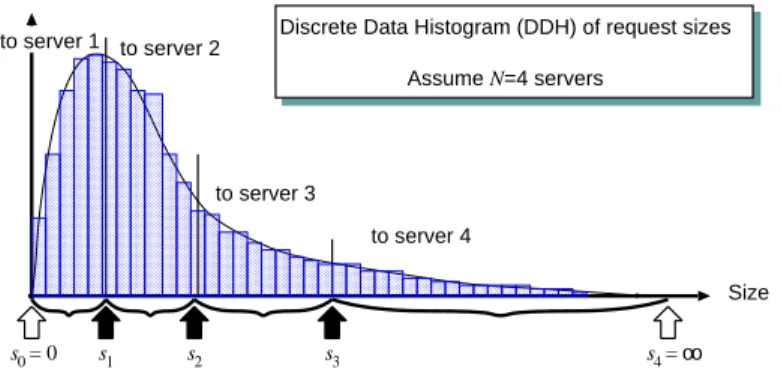
ADAPTLOADwould not work well is when there is a large number of requests, each for a different file, but all these files have the same size; however, in this a very unlikely case. Figure 3 gives an illustration of the high level idea of ADAPTLOAD.
Size Discrete Data Histogram (DDH) of request sizes
Assume N=4 servers
s = 00 s1 s2 s3 s =4 oo
to server 4 to server 1 to server 2
to server 3
Figure 3: High level idea of ADAPTLOAD.
In the previous section, we showed that the workload can be highly variable even across a single day. This suggests that frequent adjustments of thesnboundaries are imperative for high performance. A simple
way to do this is to use the lastKrequests seen by the system when computing the DDH needed to determine the boundaries for the allocation of the nextKrequests. The value ofKshould be neither too small (since we
1. initialize overall algorithm
a. set theN−1fuzzy boundaries[(s1,1),(s2,1), . . . ,(sN−1,1)]to reasonable guesses
b. initializeito the first batch index: i←0
c. initialize the used DDH: forf= 1toFdo Ui[f]←0
2. initialize the counters for a new batch ofKrequests:
a. initialize number of requests: R←0
b. initialize observed DDH: forf= 1toFdo Oi[f]←0
3. whileR < Kdo
a. get a new request, let its size bes, and incrementR
b. assign this request to a server based onsand[(s1, p1),(s2, p2), . . . ,(sN−1, pN−1)]
c. compute indexfsatisfyingCf−1≤s < Cf
d. addsto binfof observed DDH: Oi[f]←Oi[f] +s
4. compute the next used DDH: Ui+1←((1−α)Oi+ (α−αi+1)Ui)/(1−αi+1)
5. increment batch index: i←i+ 1
6. initialize computation of new fuzzy boundaries[(s1, p1),(s2, p2), . . . ,(sN−1, pN−1)]
a. initialize server index: n←1
b. initialize accumulated weight: A←0
c. initialize total weight inUi: B←0
d. compute total weight inUi: forf= 1toFdo B←B+Ui[f]
7. forf= 1toFdo
a. add thefth
bin of the used DDH toA: A←A+Ui[f]
b. whileA > n·B/N
I. set boundary for servern: sn←f
II. set fraction for servern: pn←1−(A−n·B/N)/Ui[f]
III. increment server index: n←n+ 1
8. go to 2. and process another batch ofKrequests
Figure 4: Setting the fuzzy boundaries[(s1, p1),(s2, p2), . . . ,(sN−1, pN−1)]with ADAPTLOAD.
must ensure that the computed DDH is statistically significant) nor too large (since we must adapt promptly to workload fluctuations).
Predicting the incoming workload based on batches ofKrequests helps ADAPTLOADcapture the clus-ter’s transient behavior. In [23], we showed that the performance of ADAPTLOADimproves if information from the entire workload history is used to predict the future workload, in a geometrically discounted fash-ion: the near past history weighs more than the far past one. The flow of incoming requests is partitioned into batches ofK requests and the “all batches DDH” is updated with the “current batch” DDH. The geo-metrically discounted history can be formalized as follows.
LetOibe a vector representing the DDH observed in theithbatch. Then, the DDHUi+1used to allocate
the next batch of requests is obtained as a geometrically discounted weighted sum of all the previously observed batches: Ui+1 = Pi j=0αi −jO j Pi j=0αi −j = (1−α)Oi+ (α−αi+1)Ui 1−αi+1 .
The coefficientα,0≤α≤1, controls the rate at which past data decreases in importance. The caseα= 0
corresponds to the algorithm previously presented, where only the last batchiis used to computeUi+1; the
caseα = 1corresponds to giving the same weight to all batches. For any given trace and value ofK, it is possible to find an a posteriori value ofαproviding nearly optimal performance: obviously, as a trend, the largerK, the smallerα. Fortunately, ADAPTLOADproves to be not too sensitive to the value chosen for the
(K, α)pair.
Figure 4 illustrates the algorithm that uses geometrically discounted history of past workload to deter-mine fuzzy boundary points for ADAPTLOAD. In the following sections, we concentrate on ADAPTLOAD’s
ability to cope with transient overloads by effectively balancing the load among the servers and by implicitly behaving like a locality-aware policy. Furthermore, we concentrate on ADAPTLOAD’s ability to treat fairly requests of different sizes as well as its performance under workloads that have both static and dynamic requests.
5
System architecture
We focus on evaluating how well ADAPTLOADbalances the load and on assessing the performance benefits
of the policy’s implicit tendency to achieve a high locality. To this end, we compare ADAPTLOADagainst the classic Join Shortest Queue (JSQ3) policy and LARD, a locality-aware request distribution strategy that explicitly exploits cache locality while striving to balance the load in the system [22]. LARD reduces the impact of I/O bandwidth by assigning the requests for a file to a server that most likely contains that file in its memory, if any. This achieves high locality and partitions the working set across all servers. Only when the load unbalance across servers is significant, LARD ignores locality and directs requests to under-utilized servers to balance the load, thus imitating the JSQ policy. The parameters that correspond to high and low load levels and indicate imbalance must be selected judiciously to absorb workload fluctuations and temporary imbalances without significantly reducing cache hit ratios [22].
Since our focus is on the performance of the three load balancing policies, we make the following assumptions. First, we assume that the cost of forwarding the request to the appropriate server is negligible. This assumption clearly favors LARD, which can only be implemented in a content-aware switch that has
exact knowledge of the contents of the memory of each server. ADAPTLOAD, instead, can be implemented
with a one-level routing mechanism, using a content-aware front-end device that forwards requests to a specific server according to their size [3]; this is computationally less expensive than LARD. In such an environment, ADAPTLOAD’s DDH is built and maintained at the front-end, which then makes the scheduling
decisions. However, ADAPTLOAD could also be implemented in a content-blind switch as a two-level request redistribution scheme: each request is forwarded to one of the servers using a simple policy such as round-robin, and this server then forwards it to the appropriate server based on the size of requested document [6]. In such an environment, ADAPTLOAD’s DDH is built and maintained by the servers of the cluster, provided they periodically communicate with each other to share their knowledge of the DDH and determine the boundaries.
We also assume that the web cluster contains mirrored homogeneous servers that operate independently from each other. Each server sends directly its response to the client (i.e., traffic does not flow through the switch) via a new network connection, assuming that the web server uses the HTTP 1.0 protocol. Each server has its own memory, local disk, and network card(s). We refer to the local memory as “cache” to stress that it is much faster than the local disk.
Once the request is assigned to a particular server, its flow is as follows. First, a connection is established between the client and the server. A Decision Process is responsible for establishing this connection and determining the file location, i.e., cache or local disk. We assume that this process introduces no contention and makes instantaneous decisions4. If the requested file is in the cache, it is scheduled for transmission and queued at the Network/CPU Queue, which has an infinite buffer and a Round Robin scheduling discipline
3
We also compared with Join Shortest Weighted Queue (JSWQ) as described in the preliminary version of this paper, whose performance now is very close or even worse than JSQ given our more detailed system assumptions. For this reason we chose JSQ as comparator.
4
Connection establishment and tear-down cost is ignored in the simulation model, although it may be significant. We stress that this cost is the same for all three policies. ADAPTLOADneeds a small modification to account for this: when the DDH is built, a constant (corresponding to the connection overhead) is added to each request size. The performance of the three policies is qualitatively the same whether the connection overhead is accounted for or not.
with a time slice equal to the time required to transfer 1.5 Kbytes (the maximum data length of an IEEE 802.3 Ethernet packet). This is an abstraction of the draining of the socket buffers to the network through the Ethernet card, each buffer containing (a portion of) the file corresponding to a connection. We further assume that the time to transmit a file that is in a socket buffer is approximated well by its size [18]. If the requested file is instead not in the cache, the request is sent to the Disk Queue, which has an infinite buffer and a FIFO (first-in-first-out) discipline. Once the requested file is fetched from the disk, it is placed in the cache following an LRU (Least Recently Used) replacement policy and enters the Network/CPU Queue for future transfer.
The processing time of a request is of course much smaller if served from the cache than from the local disk. We model this using the following parameters [19]: the transmission cost for a file at the network queue is 40µsper 512 bytes; the disk latency is 28ms(2 seeks + 1 rotation) and the transfer time from disk to cache is 410µsper 4 Kbytes (resulting in a peak transfer rate of 10 Mbytes/sec). Files larger than 44 Kbytes incur an additional latency of 14ms(1 seek + 1 rotation) for every additional 44 Kbytes block or part thereof.
6
Performance analysis of A
DAPTL
OADWe analyze ADAPTLOADvia a simulation driven by the trace presented in Section 3. Each entry in the trace corresponds to a single file transfer and provides the request arrival time and the number of bytes transferred (from which we infer the service time). Since the arrival time accuracy is only in seconds and many requests arrive at the cluster within one second, we introduce finer time scales by uniformly distributing the requests within the second they arrived. In all our experiments we strive to preserve the arrival process, as the system performance is sensitive to it. To simulate load conditions higher or lower than the one in the actual trace, we adjust the processing speed of the requests by changing the service rate at the network and disk queues. This allows us to examine the policy performance for heavily or lightly loaded clusters.
As described in the previous section, ADAPTLOADbalances the load on the back-end servers using its knowledge of the past workload distribution. Specifically, the algorithm of Figure 4 schedules theithbatch
ofKrequests according to boundaries computed using the(i−1)thbatch ofK requests. As expected, the
performance of the policy is sensitive to the value ofK. For the World Cup 1998 workload, we experimented with several values forKand searched for the optimal value ofαin[0,1]for each value ofK. WhenKis large enough, e.g.,215=32,768, the optimal value ofαis very close to0; whenKis small, e.g.,29= 512,
the optimal value ofαis closer to1. For simplicity, we fix (K, α) to(32,768,0), i.e., only the previous batch ofK requests is used to create the histogram. This choice of values proved to be nearly optimal [23]. Our analysis in the following sections focuses on the following questions:
• Can ADAPTLOADrespond quickly to transient overload?
We plot the average slowdown perceived by the end user during each time interval corresponding to N requests. Since the system operates under transient overload conditions and is clearly not in steady state, our experiments focus on examining ADAPTLOAD’s ability to respond to sudden arrival bursts and quickly serve as many requests as possible, as efficiently as possible.
• How close is ADAPTLOADto a locality-aware policy?
Although ADAPTLOADis not explicitly aware of the cache content of the servers, it achieves the same goal as a locality-aware policy: by sending requests for files with the same size to the same server, cache hits are maximized. To study the effect of cache size, we define the trace working set as the set of all unique files transferred on June 24, and observe the performance of ADAPTLOADas a function of the cache size, expressed as a percentage of this working set.
• Does the policy achieve equal utilization across servers?
Since ADAPTLOADbases its boundaries on knowledge of the workload distribution, we examine the per-server utilization as a function of time and comment on the policy’s ability to distribute the load effectively.
• Does ADAPTLOADtreat short jobs differently from long jobs?
This question refers to the policy’s fairness. To measure the responsiveness of the system, we report the average request slowdown of the classes of requests defined by the request sizes intervals.
• Can ADAPTLOADwork in mixed static/dynamic workloads?
We examine ADAPTLOAD’s ability to serve mixed workloads by considering its behavior when only
a fraction (i.e., the static part) of the workload data is used for statistical inference about the size of future requests.
In the following sections, we compare ADAPTLOAD’s performance with that achieved by JSQ and LARD. As mentioned in the previous section, the performance of LARD is sensitive to its parameterization. After extensive experimentation using the June 24 data set, we selected the low and high load parameters that achieved the best performance for LARD across all experiments. Here, we report results based on this optimal set of parameters only. Unless otherwise noted, we assume a cluster of four servers.
6.1 ADAPTLOADand locality awareness
The first set of experiments is designed to examine ADAPTLOAD’s performance as a function of the fraction of the working set that fits in the cache. We compare ADAPTLOAD’s performance with that achieved using the Join Shortest Queue (JSQ) and the LARD load balancing policies.
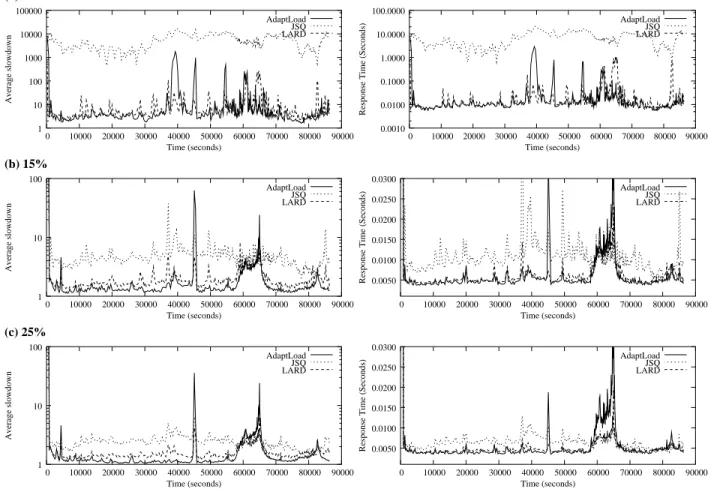
We design our experiments so that there is no file in the cache at the beginning of the simulation, thus the first request for a file results in a cache miss; this models a cold cache for all policies. We present performance metrics as averages computed for each group of 100,000 requests. In this fashion, we capture the user-perceived performance under a transient workload that changes dramatically over the course of a day. Figure 5 shows the average request slowdown as a function of time for three different cache sizes. Slowdown, the ratio of actual time spent in the system to the time spent in the system if the server were idle and the requested file in the cache, is the fundamental measure of responsiveness for servers, since users are more willing to wait for “large” requests than for “small” ones [8]. If the per-node cache size isx% percent of the working set, the effective cache size approaches the sum of the node cache sizes. Since our experiments consider four nodes, when the node cache size is 25% of the working set, we expect to capture almost the entire working set across the cluster.
Figure 5 (left column) indicates that JSQ’s slowdown is very sensitive to the cache size (a logarithmic scale is used for the y-axis). When the per-node cache size is 5% of the working set, ADAPTLOAD outper-forms JSQ by several orders of magnitude and peroutper-forms similarly to LARD. As the cache size increases, ADAPTLOAD’s gain persists until the per-node cache reaches 25% (i.e., the cached portion of the working set approaches 100%). After this cache size, JSQ’s performance keeps improving: if there is a high proba-bility that the requested document is cached, then JSQ is preferable as it minimizes queuing. We return to the issue of sensitivity to the cache size later in this section.
Figure 5 (right column) plots the average request response time for the three policies over time and further confirms the above observations. For this metric, the disparity in performance of the various policies is not as severe as for the slowdown, but the same trends persist except when the arrival rate is increased significantly. ADAPTLOAD’s performance is similar to LARD’s, but JSQ clearly outperforms them. Figure 2
shows that the C.V. of request sizes is relatively small in this busy period. Small caches are enough to hold almost all the requested files and achieve a large hit ratio, as is also shown by Figure 7. In this case,
(a) 5% (b) 15% (c) 25% 1 10 100 1000 10000 100000 0 10000 20000 30000 40000 50000 60000 70000 80000 90000 Average slowdown Time (seconds) AdaptLoad JSQ LARD 0.0010 0.0100 0.1000 1.0000 10.0000 100.0000 0 10000 20000 30000 40000 50000 60000 70000 80000 90000
Response Time (Seconds)
Time (seconds) AdaptLoad JSQ LARD 1 10 100 0 10000 20000 30000 40000 50000 60000 70000 80000 90000 Average slowdown Time (seconds) AdaptLoad JSQ LARD 0.0050 0.0100 0.0150 0.0200 0.0250 0.0300 0 10000 20000 30000 40000 50000 60000 70000 80000 90000
Response Time (Seconds)
Time (seconds) AdaptLoad JSQ LARD 1 10 100 0 10000 20000 30000 40000 50000 60000 70000 80000 90000 Average slowdown Time (seconds) AdaptLoad JSQ LARD 0.0050 0.0100 0.0150 0.0200 0.0250 0.0300 0 10000 20000 30000 40000 50000 60000 70000 80000 90000
Response Time (Seconds)
Time (seconds)
AdaptLoad JSQ LARD
Figure 5: Average request slowdown and average response time for ADAPTLOAD, JSQ and LARD as a function of time with per-node cache sizes of (a) 5%, (b) 15%, and (c) 25% of the working set.
queue length is more important than locality awareness and JSQ outperforms other policies. We discuss how to improve ADAPTLOADunder this condition in Section 8. Finally, observe a spike in ADAPTLOAD’s
curve around the 45,000th second, clearly visible in Figures 5(b)–(c). This is due to many requests for small files, more than what the previous workload suggested. This discrepancy is reflected in the server boundaries calculated by ADAPTLOAD, which result in a long queue at the first server and consequently
poor performance. The entire period from the 35,000th to the 45,000th second is characterized by such sharp oscillations in the workload and requests for many new small files that are not in the cache (Figures 6 and 7). This results in higher disk utilization and lower cache hit ratio, in particular for the first server, which receives requests for small files. Most workload oscillations, except the one at the 45,000th second, are handled well by ADAPTLOADwhen the cache size is larger (Figures 5(b)–(c)) but not when the cache size is small (Figure 5(a)). LARD performs better than ADAPTLOADin such situations, because it makes
scheduling decisions based on both the queue length and the cache content, thus avoids queue build-up at individual servers. However, ADAPTLOADquickly recovers and its performance levels are already restored in the next group of requests. In Section 8, we elaborate on how to further improve ADAPTLOAD by considering both queue length and workload characteristics when making scheduling decisions.
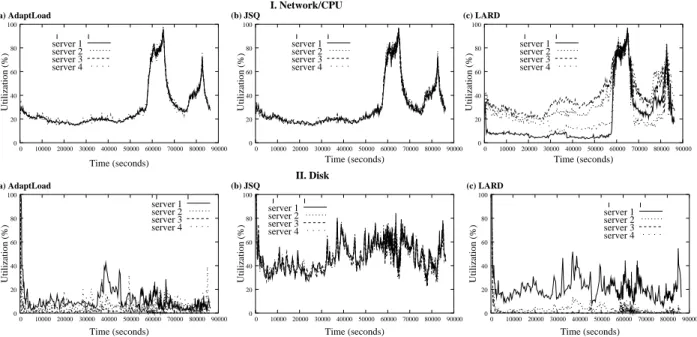
To further confirm ADAPTLOAD’s ability to balance the load, we compare the utilization of the net-work/CPU and disk servers for ADAPTLOAD, LARD, and JSQ when the per-node cache size is 15%. Fig-ure 6 (first row) shows that the network servers are evenly utilized across all four servers for ADAPTLOAD
and JSQ but not for LARD, which achieves good load balance only during high arrival rate periods, where it behaves like JSQ. Figure 6 (second row) gives the per-server utilization of the local disks and indicates that the I/O queues grow much faster with JSQ than with ADAPTLOADand LARD.
(a) AdaptLoad (b) JSQ (c) LARD
(a) AdaptLoad (b) JSQ (c) LARD
I. Network/CPU
Time (seconds) Time (seconds) Time (seconds)
Time (seconds) Time (seconds) Time (seconds)
II. Disk server 1 server 2 server 3 server 4 server 1 server 2 server 3 server 4 server 1 server 2 server 3 server 4 server 1 server 2 server 3 server 4 server 1 server 2 server 3 server 4 server 1 server 2 server 3 server 4 0 20 40 60 80 100 0 10000 20000 30000 40000 50000 60000 70000 80000 90000 0 20 40 60 80 100 0 10000 20000 30000 40000 50000 60000 70000 80000 90000 0 20 40 60 80 100 0 10000 20000 30000 40000 50000 60000 70000 80000 90000 0 20 40 60 80 100 0 10000 20000 30000 40000 50000 60000 70000 80000 90000 0 20 40 60 80 100 0 10000 20000 30000 40000 50000 60000 70000 80000 90000 0 20 40 60 80 100 0 10000 20000 30000 40000 50000 60000 70000 80000 90000 Utilization (%) Utilization (%) Utilization (%) Utilization (%) Utilization (%) Utilization (%)
Figure 6: Network/CPU and disk utilization for ADAPTLOAD, JSQ and LARD as a function of time with per-node cache size of 15% of the working set.
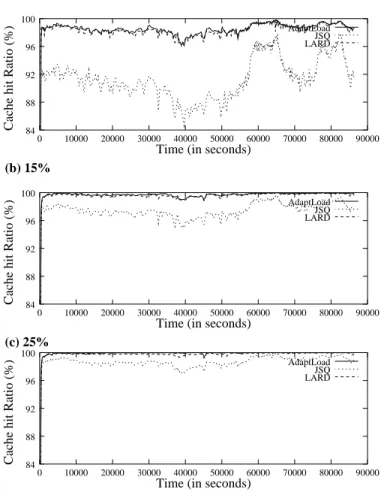
Since the cache size determines the cache hit ratios, which in turn determine what fraction of files is served by the disk, we plot the cache hit ratios for ADAPTLOADand JSQ as a function of time in Figure 7; the effect of cold misses is clearly visible at the beginning of the simulation across all cache sizes and for all policies. For small cache sizes, ADAPTLOAD behaves like LARD and achieves high cache hit ratios; almost 100% of requests find their target files in the server cache, even when the per-node cache size is only 15% of the working set. As cache size increases, the portion of the files that fit in cache increases, and the cache hit ratio achieved by JSQ improves greatly. Hit ratios greater than 90% for both ADAPTLOAD and LARD regardless of the cache size suggest a high concentration of user interests: a few popular documents are responsible for the majority of requests. This is corroborated by Figure 2(c): the higher the C.V., the lower the cache hit ratio, and explains why JSQ performs worse than ADAPTLOADespecially during the morning and early afternoon hours when the C.V. of request service time is high.
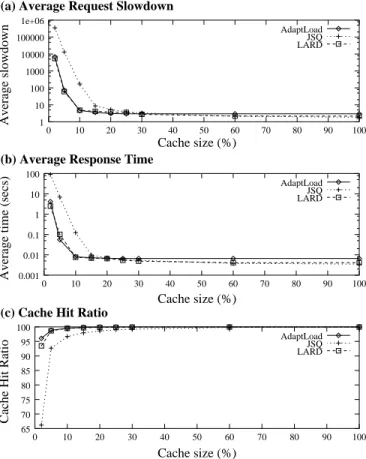
To quantify policy sensitivity to cache size, we run experiments where the per-node cache size ranges from 2% to 100% of the working set. Figure 8 shows the average request slowdowns, average request response time, and cache hit ratio for the three policies as a function of cache size. The values in this graph are averages computed over the entire trace. The performance of JSQ deteriorates fast when the per-node cache size falls below 20%, while ADAPTLOADand LARD maintain high performance even with a per-node cache size of 10%. A crossover point exists when the per-node cache size is about 25%: after this point, JSQ and LARD provide slightly better performance than ADAPTLOAD. The reason for this is that, with so much cache, almost all files requested multiple times reside in the cache of each server, thus the most important factor to achieve the highest performance becomes load balance: JSQ does (very slightly) better than ADAPTLOADat this since its dispatcher knows the current queue length of each server.
(a) 5%
Time (in seconds)
(b) 15%
(c) 25%
Time (in seconds) Time (in seconds)
84 88 92 96 100 0 10000 20000 30000 40000 50000 60000 70000 80000 90000 AdaptLoad JSQ LARD 84 88 92 96 100 0 10000 20000 30000 40000 50000 60000 70000 80000 90000 AdaptLoad JSQ LARD 84 88 92 96 100 0 10000 20000 30000 40000 50000 60000 70000 80000 90000
Cache hit Ratio (%)
AdaptLoad JSQ LARD
Cache hit Ratio (%)
Cache hit Ratio (%)
Figure 7: Cache hit ratios for ADAPTLOAD, JSQ and LARD as a function of time with per-node cache sizes of (a) 5%, (b) 15%, and (c) 25% of the working set.
6.2 Fairness
ADAPTLOADbases its decisions solely on the size of the requested files, independently of the queue length of each server. Given that most requests are for some popular files and the average size of a requested file is around 5 Kbytes, we must address the question of fairness: What is the performance for different request sizes?
We present a percentile histogram of the slowdowns of all requests in the trace (recall that the total number of requests on June 24 is nearly 39 million). A partition of the range of requested file sizes in bins of powers of 2 results in 22 bins,[2i−1,2i), for1 ≤ i≤ 22. We classify the slowdown of a requested file
into four categories: between 1 and 5 (low), between 5 and 20 (medium), between 20 and 100 (high), and above 100 (very high), and we compute the percentile of each slowdown category within each binbi.
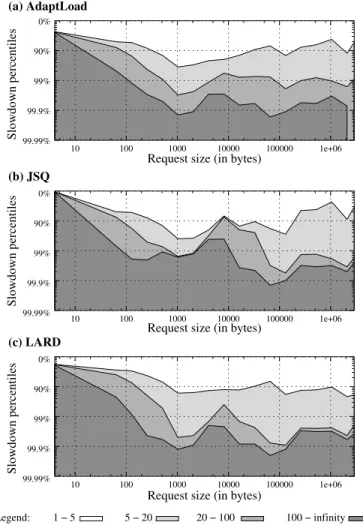
Figure 9 shows the slowdown percentiles as a function of the file size for ADAPTLOAD, JSQ, and LARD when the per-node cache size is 15% of the working set. The y-axis is in logarithmic scale and decreasing order: the darkest area corresponds to very high slowdowns, while the lightest one corresponds to low slowdowns. Figure 9 is best understood by imagining vertical lines for each file size. For example with ADAPTLOAD(Figure 9(a)), 98% of the files that are 1,000 bytes have a slowdown from 1 to 5, 1.5% of the
files have a slowdown from 5 to 20, 0.4% of the files have a slowdown from 20 to 100, and only 0.01% have slowdown greater than 100.
(a) Average Request Slowdown
(b) Average Response Time
(c) Cache Hit Ratio
65 70 75 80 85 90 95 100 0 10 20 30 40 50 60 70 80 90 100
Cache Hit Ratio
AdaptLoad JSQ LARD 0.001 0.01 0.1 1 10 100 0 10 20 30 40 50 60 70 80 90 100
Average time (secs)
AdaptLoad JSQ LARD 1 10 100 1000 10000 100000 1e+06 0 10 20 30 40 50 60 70 80 90 100 Average slowdown AdaptLoad JSQ LARD Cache size (%) Cache size (%) Cache size (%)
Figure 8: Average request slowdown, response time, and system cache hit ratio for ADAPTLOAD, JSQ and
LARD as function of cache size.
Files between 1 Kbytes and 0.1 Mbytes, which account for almost 50% of the entire workload, have similar slowdowns with ADAPTLOADand LARD, but higher slowdowns with JSQ. Requests for very small
files, less than 50 bytes, have high slowdowns under all policies, but this is just due to the definition of slowdown as a ratio and is not a problem in practice, since their response time is nevertheless still small in an absolute sense. Finally, for large files, ADAPTLOADperforms best.
We conclude that ADAPTLOADtreats all classes of file sizes fairly, and guarantees low slowdowns for the medium-size files that are most commonly requested from a web site [9].
6.3 Scalability
In all previous experiments, we assumed four servers. To demonstrate that ADAPTLOADscales well with
the number of servers, we also experimented with systems having 8, 12, 16, and 20 servers. Results are reported in Figure 10, assuming that the per-server cache size is 5% or 10% of the working set. Performance improves in all policies as the servers increase from 4 to 8, and stabilizes around 12: given the parameters of the simulation, increasing the number of servers to beyond 12 does not help performance. The figure also illustrates that the ADAPTLOADand LARD curves are very close to each other, consistently outperforming JSQ.
(c) LARD Legend: 1 − 5 5 − 20 20 − 100 100 − infinity (a) AdaptLoad (b) JSQ 99.9% 99% 90% 0% 99.99% 99.9% 99% 90% 0% 99.99% 99.9% 99% 90% 0% 99.99% 10 100 1000 10000 100000 1e+06 100 1000 10000 100000 1e+06
Request size (in bytes)
10 100 1000 10000 100000 1e+06
10
Request size (in bytes)
Request size (in bytes)
Slowdown percentiles
Slowdown percentiles
Slowdown percentiles
Figure 9: Slowdown percentiles plot under (a) ADAPTLOAD(b) JSQ (c) LARD.
(a) 5% (b) 10%
Number of servers
Average Slowdown Average Slowdown
Number of servers 1 10 100 1000 10000 100000 2 4 6 8 10 12 14 16 18 20 AdaptLoad JSQ LARD 1 10 100 1000 2 4 6 8 10 12 14 16 18 20 AdaptLoad JSQ LARD
Figure 10: Average slowdown for ADAPTLOAD, JSQ, and LARD as a function of different number of servers with per-server cache sizes of (a) 5% and (b) 10% of the working set.
6.4 ADAPTLOAD’s sensitivity to workload characteristics
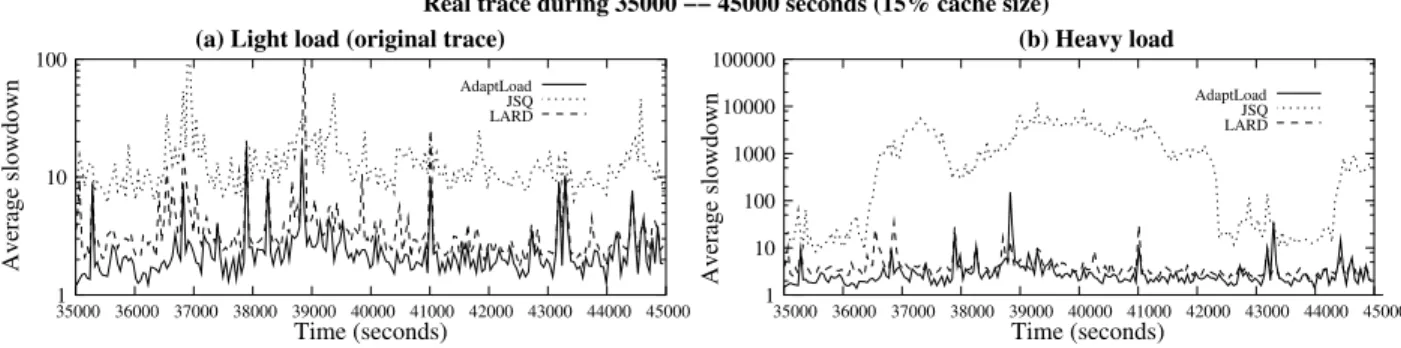
In Section 3, we discussed the variability of the workload characteristics across the entire trace. Here, we concentrate on the performance of ADAPTLOADfor two portions of the trace having different statistical characteristics. First, we concentrate on the time period from the 35,000thto the 45,000thsecond, where the arrival intensity is low but the service is highly variable (i.e., the C.V. of the request size is around 8). Then, we focus on the time period from the 58,000th to the 68,000th second, where the arrival intensity is very
high but many requests are for the same files, significantly lowering the C.V. of the request size (i.e., around 4).
In Figure 11, we report on the average policy slowdown across time for these two time periods but we scale the request arrival rate in order to make the system operate under “light load” and “heavy load”. The cache size is 15% of the working set. Under light load during the 35,000thto the 45,000th second period, the network/CPU utilization was around 20% and the disk utilization reached 40% while, under heavy load, the network/CPU utilization was around 40% and the disk utilization reached 80%. For this part of the trace, the disk is the bottleneck device. Note that ADAPTLOADand LARD do significantly better than JSQ, and their performance advantage increases as load increases. Under light load, ADAPTLOAD’s performance is similar to LARD’s, offering a slight quantitative benefit.
From the 58,000thto the 68,000thsecond and under light, load the network/CPU utilization ranges from 25% to 50% while the disk utilization is consistently less than 15%. Under heavy load, the utilization ranges from 50% to nearly 100% for network/CPU and is less than 20% for the disk. For this part of the trace where requests are for the same files, the working set fits better in the cache and the network/CPU is the bottleneck. Under light load, ADAPTLOADis consistently better than JSQ and LARD. Under heavy load, ADAPTLOADcontinues to outperform JSQ and LARD until the 65,000th second, when the network/CPU utilization reaches 100% and JSQ and LARD balance load better.
To summarize, ADAPTLOADis a load balancing algorithm that works well under both high and low variability in the service and arrival processes. However, when the cluster operates under heavy load, i.e., the high arrival rate is the dominating factor in cluster performance, ADAPTLOAD’s performance drops because it does not explicitly consider the current queue length at each server. In Section 8, we present an algorithmic modification to address this limitation.
58000 59000 60000 61000 62000 63000 64000 65000 66000 67000 68000
Time (seconds)
58000 59000 60000 61000 62000 63000 64000 65000 66000 67000 68000
Time (seconds) (b) Heavy load Real trace during 35000 −− 45000 seconds (15% cache size)
(a) Light load
Real trace during 58000 − 68000 seconds (15% cache size)
1 10 100 35000 36000 37000 38000 39000 40000 41000 42000 43000 44000 45000 1 35000 36000 37000 38000 39000 40000 41000 42000 43000 44000 45000 10 100 1000 10000 100000 1 10 100 1 10 100 Time (seconds) Time (seconds) Average slowdown
Average slowdown Average slowdown
Average slowdown
(a) Light load (original trace)
(b) Heavy load (original trace)
JSQ LARD AdaptLoad JSQ LARD AdaptLoad JSQ LARD AdaptLoad JSQ LARD AdaptLoad
Figure 11: Average slowdown for ADAPTLOAD, JSQ, and LARD as a function of the workload characteris-tics (per-server cache size is set to 15%).
7
A
DAPTL
OADand dynamic workload
As presented in the previous sections, ADAPTLOADconsiders only static requests for actual files stored in the servers’ local disks. Nowadays, however, most web server clusters must also process dynamic requests, which usually require accessing database information or executing applications at specialized servers. Such dynamic requests have unknown size, thus they cannot be assigned to servers according to ADAPTLOAD’s rules, nor would it make sense to do so, since they do not correspond to pre-existing files that might be in the cache. For the same reason, while the resource requirements for dynamic pages are known after-the-fact, it does not make sense to use them for the computation of ADAPTLOAD’s parameters, i.e., the DDH. We then modify the algorithm of Figure 4 to handle dynamic requests as well as static ones, by distributing static requests according to the ADAPTLOADpolicy and dynamic requests according to the JSQ policy.
7.1 System architecture in the presence of dynamic pages
For dynamic requests, the following modifications to the server architecture of Section 5 are made. The decision process recognizes incoming dynamic requests and queues them at the Dynamic Request Queue for processing. We assume that the reply to a dynamic request is generated by a database or specialized server within the cluster. We modeled the time required to generate a dynamic request is drawn from a Lognormal distribution with mean 3.275 ms and C.V. equal to 3.4, parameters obtained using the TPC-W workload that emulates the behavior of an online bookstore [26]. The dynamic page generation time includes contention at the application and database servers. We assume that the dynamic server serves requests using the processor sharing discipline. Once the reply has been generated, it enters the network queue of the server for transmission and is handled in the same way as a static request.
To study the effect of dynamic requests, we modify our static trace to generate a mixed static-and-dynamic stream of requests. From our trace of (static) requests, we randomly select requests as possible candidates for being considered dynamic, independently and with a given probabilityβ(a parameter in our study). Because the file size that results from a dynamic request is relatively small in practice, a selected candidate request is classified as dynamic only if its size is less than 100 Kbytes (this means that the fraction of dynamic requests is almost β, since almost all requests are for sizes less than 100 Kbytes). All other requests are classified as static, their size is known, and their processing proceeds as usual. If a request is classified as dynamic, the associated size on the original trace is taken to be the size of the reply (to be eventually transferred over the network), but the time to compute this reply is sampled from a Lognormal distribution as described above.
7.2 Performance analysis under dynamic load
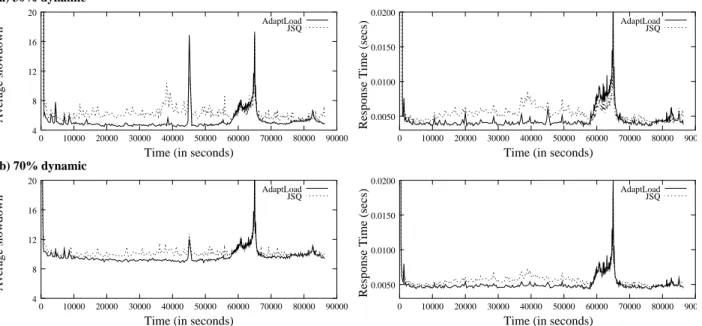
We evaluate ADAPTLOAD’s performance under two workload scenarios, withβ = 30% or70%. We assume a local cache equal to 30% of the working set, i.e., a total 120% of the working set is present in the cache of the cluster. This choice was made to favor JSQ which we have shown to work well when the per-node cache size is at least 25% of the working set. Figure 12 presents the average request slowdown for the ADAPTLOAD
and JSQ policies under the two scenarios. In both cases, ADAPTLOADcontinues to outperform JSQ (except for the spike around the 45,000th second in Figure 12, as is already the case when all workload is static). Comparing Figures 12(a) and (b), we find that the average request response times increase for both policies as the fraction of dynamic requests increases from 30% to 70%. This is simply due to the additional service time that dynamic requests spend at the application server. Since ADAPTLOADbehaves like JSQ on dynamic requests, the performance gap between ADAPTLOADand JSQ decreases as the fraction of dynamic requests
(a) 30% dynamic (b) 70% dynamic 0.0050 0.0100 0.0150 0.0200 0 10000 20000 30000 40000 50000 60000 70000 80000 90000 AdaptLoad JSQ 4 8 12 16 20 0 10000 20000 30000 40000 50000 60000 70000 80000 90000 Average slowdown AdaptLoad JSQ 4 8 12 16 20 0 10000 20000 30000 40000 50000 60000 70000 80000 90000 Average slowdown AdaptLoad JSQ 0.0050 0.0100 0.0150 0.0200 0 10000 20000 30000 40000 50000 60000 70000 80000 90000 AdaptLoad JSQ
Time (in seconds)
Time (in seconds) Time (in seconds)
Time (in seconds)
Response Time (secs)
Response Time (secs)
Figure 12: Average request slowdown and response time for ADAPTLOADand JSQ as a function of time
with (a) 30% and (b) 70% dynamic requests in the workload when the per-node cache size is 30% of the working set.
8
Improving A
DAPTL
OADADAPTLOADexcels when the per-node cache size is small but, when it is so large that a request can be cached in several servers, performance is less sensitive to the locality of files than to the queue length at the network card. In such cases, JSQ and LARD perform better than ADAPTLOADbecause they are designed to equalize the queue length at each node. This suggests that adjusting the size boundaries so that each server has approximately the same queue length may benefit ADAPTLOAD’s performance.
IfQ(n)is the current queue length at servernfor1 ≤ n≤ N, the expected queue length after a time intervalT (equal to the expected time between two successive adjustments, i.e., the time for the nextK requests to arrive) can be approximated by
Q0
(n) =Q(n) +L(n)− T ·µ
fs(n), (1)
where L(n) is the expected number of requests assigned to server nduring the time interval T, µ is the service rate, andfs(n) is the mean size of the new arrival requests in this time interval. T ·µ/fs(n)is the expected number of requests processed duringT assuming that the server is always busy.
Our previous work has shown that knowledge of a finite portion of the past workload can be used as an indicator of future behavior. To computeL(n)andfs(n), we then define two additional vectorsXiandYi+1,
also withF bins. For1≤ f ≤F,Xi[f]records the number (not total size) of requested files with size in
the range[Cf−1, Cf]seen in theith
batch, whileYi+1[f]predicts the number of requested files in this range
for the(i+ 1)thbatch. The entries of vectorX
iare initialized to0and incremented (by one) when those of
Oiare, in lines 2.b and 3.d of Algorithm 4, respectively. VectorYi+1, likeUi1, is obtained as a geometrically discounted weighted sum of all the previously observed batches:
Yi+1 =
(1−α)Xi+ (α−αi+1)Yi
7’. determine whether load imbalances warrant adjustments
a. compute queue lengths assuming no change: forn= 1toNdo
Q0(n) =Q(n) +L(n)−T·µ/fs(n)
b. compute their maximum and minimum: Qmax=max{Q0(1), Q0(2), . . . , Q0(N)}
Qmin=min{Q0(1), Q0(2), . . . , Q0(N)}
8’. ifQmax>TH1and(Qmax−Qmin)>TH2then
a. compute desired queue length: Q00= 1/N·PN
n=1Q
0(n)
b. compute desired number of requests: forn= 1toNdo
L0(n) =Q00−Q(n) +T·µ/fs(n)
c. initialize computation of new fuzzy boundaries
I. initialize server index: n←1 II. initialize accumulated queue length weight: Z←0
d. forf= 1toFdo
I. add thefth
bin ofYitoZ: Z←Z+Yi[f]
II. whileZ > L0(n)do
i. set boundary for servern: sn←f
ii. decrementZ: Z←Z−L0(n)
iii. set fraction for servern: pn←1−Z/Yi[f]
iv. increment server index: n←n+ 1
Figure 13: Setting the fuzzy boundaries[(s1, p1),(s2, p2), . . . ,(sN−1, pN−1)]in the second scan of DDH,
with the goal of equalizing the queue lengths of theN servers. FromYi+1, we can then estimate
L(n) =Yi+1[sn−1]·(1−pn−1) + sn−1 X f=sn−1+1 Yi+1[f] +Yi+1[sn]·pn and fs(n) = Ui+1[sn−1]·(1−pn−1) + sn−1 X f=sn−1+1 Ui+1[f] +Ui+1[sn]·pn /L(n).
Analogously, timeT can be predicted using a geometrically discounted weighted sum of all the previously observed times required to receive batches ofK requests.
We define two threshold values,TH1andTH2, set to avoid unnecessary re-adjustments when the load
is light (Q0
(n) ≤ TH1 for all serveri), or when the queue lengths are similar (|Q0(n)−Q0(m)| ≤ TH2
for any two serversnandm). In our experiments, we set bothTH1 andTH2 to 4. If the conditions of
both thresholds are violated, we perform a second scan of the DDH to equalize the expected queue length as Q00
=PN
n=1Q
0
(n)/N. Inverting Equation 1, we deduce the desired expected number of new requests that should be assigned to servernas
L0
(n) =Q00
+ T·µ
fs(n) −Q(n) (2)
and adjust the fuzzy boundaries accordingly. Figure 13 presents the algorithm for this second scan of the DDH. This code should be inserted after step 7 in Figure 4.
In addition to this heuristic explicitly aimed at equalizing queue length, we also consider “loading” idle servers to equalize the servers’ utilization. If a request arrives when the server it should join according to the improved ADAPTLOADalgorithm is busy, and if a different server is idle, the request is dispatched to the idle server. Figure 14 shows the average slowdown and response time of the original ADAPTLOADpolicy on the left versus those achieved by the improved version on the right. The per-node cache size is 60% of the working set, a favorable setting for JSQ and LARD. ADAPTLOAD’s performance improves significantly.
(a) AdaptLoad (b) Improved AdaptLoad 0.005 0.010 0.015 0.020 0.025 0.030 0 10000 20000 30000 40000 50000 60000 70000 80000 90000
Response Time (seconds)
AdaptLoad JSQ LARD
Time (in seconds)
1 10 100 0 10000 20000 30000 40000 50000 60000 70000 80000 90000 Improved AdaptLoad JSQ LARD
Time (in seconds)
Average Slowdown
Time (in seconds)
Response Time (seconds)
Time (in seconds)
1 10 100 0 10000 20000 30000 40000 50000 60000 70000 80000 90000 AdaptLoad JSQ LARD 0.005 0.010 0.015 0.020 0.025 0.030 0 10000 20000 30000 40000 50000 60000 70000 80000 90000 Improved AdaptLoad JSQ LARD Average Slowdown
Figure 14: Average slowdown and response time for the improved ADAPTLOADpolicy, JSQ, and LARD (per-node cache size is 60% of the working set).
9
Conclusions
We studied ADAPTLOAD, a self-adjusting policy that balances the load in a homogeneous web server cluster using the empirical size distribution of the requested documents. The policy is examined under a workload that changes dramatically across time and uses knowledge of the history of request distribution to allocate incoming requests and to adjust its balancing parameters on-the-fly. ADAPTLOADtends to assign requests for the same file to the same server, thus it achieves a high cache hit ratio and low slowdowns. Unlike location-aware policies, though, it does not have to maintain the status of each server’s cache.
A detailed performance analysis of ADAPTLOADwas presented to explore locality awareness, fairness, the effect of different sampling rate, and the policy’s performance in the presence of a mixed static and dy-namic workload, from which we conclude that ADAPTLOADself-tunes its parameters according to changes in the cluster’s workload and provides good performance under conditions of transient overloads, behaves as locality-aware policies even without any knowledge of cache contents, treats files with different size fairly, is rather insensitive to the frequency of empirical data sampling, and retains its performance with a mixed static/dynamic workload.
References
[1] C. Amza, E. Cecchet, A. Chanda, A. Cox, S. Elnikety, R. Gil, J. Marguerite, K. Rajamani, and W. Zwaenepoel. Specification and implementation of dynamic content benchmarks. In 5th IEEE Workshop on Workload Charac-terization (WWC-5), Nov. 2002.
[2] M. Andreolini, M. Colajanni, and R. Morselli. Performance study of dispatching algorithms in multi-tier Web architectures. Performance Evaluation Review, 30(22):10–20, September 2002.
[3] G. Apostolopoulos, D. Aubespin, V. Peris, P. Pradhan, and D. Saha. Design, implementation and performance of a content-based switch. In Proceedings of the 2000 IEEE Computer and Communications Societies Conference on Computer Communications (INFOCOM-00), pages 1117–1126, Los Alamitos, Mar. 2000. IEEE.
[4] M. Arlitt and T. Jin. Workload characterization of the 1998 world cup Web site. Technical report, Hewlett-Packard Laboratories, Sept. 1999.
[5] M. Arlitt, D. Krishnamurthy, and J. Rolia. Characterizing the scalability of a large Web-based shopping system. ACM Transactions on Internet Technoogy, 1(1):44–69, Aug. 2001.
[6] M. Aron, D. Sanders, P. Druschel, and W. Zwaenepoel. Scalable content-aware request distribution in cluster-based network servers. In Proceedings of Annual USENIX Technical Conference, San Diego, CA, June 2000. [7] P. Barford, A. Bestavros, A. Bradley, and M. E. Crovella. Changes in Web client access patterns: Characteristics
and caching implications. World Wide Web, Special Issue on Characterization and Performance Evaluation, 2(0):15–28, 1999.
[8] A. Bouch, A.Kuchinsky, and N. Bhatti. Quality is in the eye of the beholder: Meeting users’ requirements for internet quality of service. In Proceedings of ACM SIG-CHI, pages 297–304, The Hague, Netherlands, Apr. 2000.
[9] B. E. Brewington and G. Cybenko. How dynamic is the web. In Proceedings of the 9thInternational World Wide Web Conference, May 2000.
[10] V. Cardellini, E. Casalicchio, M. Colajanni, and M. Mambelli. Web switch support for differentiated services. ACM Performance Evaluation Review, 29(2):14–19, Sept. 2001.
[11] V. Cardellini, E. Casalicchio, M. Colajanni, and P. S. Yu. The state of the art in locally distributed Web-server systems. ACM Computing Surveys, 34(2):1–49, June 2002.
[12] V. Cardellini, M. Colajanni, and P. Yu. DNS dispatching algorithms with state estimators for scalable Web-server clusters. World Wide Web Journal, Baltzer Science, 2(3):101–113, Aug. 1999.
[13] G. Ciardo, A. Riska, and E. Smirni. EQUILOAD: a load balancing policy for clustered Web servers. Performance Evaluation, 46:101–124, 2001.
[14] M. Colajanni, P. S. Yu, and D. M. Dias. Analysis of task assignment policies in scalable distributed web-servers systems. IEEE Transactions on Parallel and Distributed Systems, 9(6), June 1998.
[15] D. Garcia and J. Garcia. TPC-W e-commerce benchmark evaluation. IEEE Computer, pages 42–48, Feb. 2003. [16] M. Harchol-Balter, M. Crovella, and C. Murta. On choosing a task assignment policy for a distributed server
system. In Proceedings of Performance Tools ’98, Lecture Notes in Computer Science, Volume 1469, pages 231–242, Boston, MA, 1998. Springer Verlag.
[17] M. Harchol-Balter and A. Downey. Exploiting process lifetime distributions for dynamic load balancing. ACM Transactions on Computer Systems, 15(3):253–285, Aug. 1997.
[18] M. Harchol-Balter, B. Schroeder, N. Bansal, and M. Agrawal. Size-based scheduling to improve web perfor-mance. ACM Transactions on Computer Systems, 21(2):1–27, May 2003.
[19] V. Kanodia and E. W. Knightly. Ensuring latency targets in multiclass web servers. IEEE Transactions on Parallel and Distributed Systems, 14(1):84–93, Jan. 2003.
[20] D. McWherter, B. Schroeder, N. Ailamaki, and M. Harchol-Balter. Priority mechanisms for oltp and transactional web applications. In 20th International Conference on Data Engineering (ICDE 2004), Boston, MA, Apr. 2004. [21] D. A. Menasce and V. A. F. Almeida. Capacity planning for Web services: metrics models and methods. Prentice
Hall, Inc., NJ, 2001.
[22] V. S. Pai, M. Aron, G. Banga, M. Svendsen, P. Druschel, W. Zwaenepoel, and E. Nahum. Locality-aware request distribution in cluster-based network servers. In Proceedings of the Eighth International Conference on Architectural Support for Programming Languages and Operating Systems, (ASPLOS-VIII), San Jose, CA, Oct. 1998.
[23] A. Riska, W. Sun, E. Smirni, and G. Ciardo. ADAPTLOAD: effective balancing in clustered Web servers under transient load conditions. In Proceedings of the22th
International Conference on Distributed Computer Systems, (ICDCS’02), pages 103–111, Vienna, Austria, July 2002.
[24] W. Shi, E. Collins, and V. Karamcheti. Modeling object characteristics of dynamic Web content. In Proceedings of the IEEE Globecom 2002 conference, Taipei, China, Nov. 2002.
[25] W. Shi, R. Wright, E. Collins, and V. Karamcheti. Workload characterization of a personalized Web site and its implications for dynamic content caching. In Proceedings of the 7th International Conference on Web Content Caching and Distribution (WCW’02), Boulder, CO, Aug. 2002.
[26] Q. Zhang, A. Riska, E. Riedel, and E. Smirni. Bottlenecks and their performance implications in e-commerce systems. In 9th International Workshop on Web Caching and Content Distribution (WCW), Beijing, China, Oct. 2004.
![Figure 4: Setting the fuzzy boundaries [(s 1 , p 1 ), (s 2 , p 2 ), . . . , (s N −1 , p N −1 )] with A DAPT L OAD .](https://thumb-us.123doks.com/thumbv2/123dok_us/10034569.2495930/7.918.156.774.112.548/figure-setting-fuzzy-boundaries-n-n-dapt-oad.webp)