QUMS WORKING PAPER SERIES
http://www.qub.ac.uk/schools/QueensUniversityManagementSchool/Research/Rese archandResearchers/WorkingPapers/ByGroup/
Reducing the Generosity and Increasing the
Conditionality of Disability Benefits: Turning the
Supertanker or Squeezing the Balloon?
Duncan McVicarQueen’s Management School, Queens University Belfast
Barbara Broadway
Melbourne Institute of Applied Economic and Social Research, University of Melbourne
Working Paper MS WPS ECO 15 02
QUEENS UNIVERSITY MANAGEMENT SCHOOL
WORKING PAPER SERIES
Queens University Belfast
185 Stranmillis Road
Belfast BT9 5EE
May 2015
Reducing the Generosity and Increasing the
Conditionality of Disability Benefits: Turning
the Supertanker or Squeezing the Balloon?
Barbara Broadway*
Melbourne Institute of Applied Economic and Social Research University of Melbourne Vic 3010 Australia [email protected] & Duncan McVicar Queen’s Management School
Queen’s University Belfast Belfast BT9 5EE United Kingdom
This Version: 12 May 2015
JEL: I38, J14
Keywords: welfare reform, disability, hazard rate, propensity score matching, difference-in-differences
*corresponding author
Acknowledgements: This research is based in part on research commissioned by the Australian Government Department of Education, Employment and Workplace Relations (DEEWR) under the Social Policy Research Services Agreement (2010–12) with the
Melbourne Institute of Applied Economic and Social Research. The research also benefited from the support of the Visiting Research Scholar scheme of the Faculty of Business and Economics, University of Melbourne. The authors would like to thank Rezida Zakarova for excellent research assistance. The views expressed in this paper are those of the authors alone and do not represent the views of DEEWR, the Australian (Commonwealth) Government or the Melbourne Institute.
Highlights
We examine the impact of a major Australian disability reform on welfare receipt
Payments were reduced and conditionality increased for the partially disabled
In the short run welfare exits increased for this group as a result of the reform
But many of those exiting welfare quickly returned; others shifted between benefits
Overall, in the longer run, the reform had no impact on welfare rolls
Abstract
This paper examines the impact of a major Australian disability reform – the 2006 Welfare to Work reform – on welfare receipt. It uses a combination of difference-in-differences and propensity score matching to identify the treatment effect. The reform reduced the generosity and increased the conditionality of welfare payments by shifting partially disabled disability benefit claimants from disability benefits to unemployment benefits. This led to increases among partially disabled welfare recipients in the hazards for exiting welfare and for switching (back) from unemployment to disability benefits. It also led to an increase in the hazard for returning to welfare for those having previously exited welfare. Overall the reform had no impact on the probability of being on welfare 12 months or 24 months later. Disability reforms need to do more than simply reduce the generosity and tighten the conditionality of payments if they are to impact on welfare dependence among people with disability.
1. Introduction
Providing support for individuals with limited earnings capacity on grounds of disability is one of the most important objectives of a modern welfare state. Most industrialised countries provide some form of disability payment to at least partly replace earnings for those whose work capacity is limited due to disability or long-term health conditions. The dilemma facing policy makers, however, is how to provide adequate out-of-work support for people with disability while maintaining incentives for those who can do so to remain in or re-enter the labour market (see Bound and Burkhauser, 1999; Author and Duggan, 2006). Experience of continued program growth in many countries including the US, despite improvements in health, suggests that policy makers have not yet got this consistently right (e.g. see OECD, 2010).
Among the potential levers to contain program growth which continue to be put forward (e.g. OECD, 2009, 2010; Department of Social Services, 2015) are reductions in payments, more stringent medical screening or re-screening, and introducing activity requirements for continued eligibility. But while there are examples of such reforms impacting on program growth in the desired direction (e.g. Gruber, 2000; Adam et al., 2010; Staubli, 2011; de Jong et al., 2011), there are also examples where they seem to have had little impact (e.g.
Campolieti, 2004; Karlstrom et al., 2008). Amongst other things, the impacts of such reforms appear to depend on other characteristics of the disability program itself and on the wider welfare system and labour market context (e.g. Burkhauser et al., 2014). There is also a big difference between restricting program growth by displacing people with disability onto other benefits – squeezing the balloon – and restricting program growth by retaining people with disability in stable employment. This too is an issue on which existing evidence has been mixed (e.g. compare Staubli (2011) with de Jong et al. (2011)). In short, our understanding of what works, in what combination, where and when and for whom, is still far from complete.
In this paper we examine the impacts of a 2006 package of reforms introduced in Australia that combined tougher screening with a reduced level of payments and the introduction of activity requirements for those deemed partly disabled. We examine the impact of these reforms on exits from disability benefits, but also on re-entry to welfare benefits and on switching between welfare payments. The nature of the reform allows us to rely on a
particularly strong identification strategy. In the spirit of Bound (1989) we compare accepted and rejected applicants for disability benefits; both groups, however, differ not in terms of their assessed health, but rather in their date of application (before or after the reform), which implied two different sets of eligibility criteria. In addition, a control group is available, because the changes in benefit generosity and eligibility criteria applied only on one side of a ‘work-capacity boundary’ and not the other.
We show that the reforms led to increases among partially disabled welfare recipients in the hazards for exiting welfare and for switching (back) from payments conditioned on
participation in work-related activity to unconditional, passive payments. The reforms also led to an increase in the hazard for returning to welfare for those having previously exited welfare. Overall the reform had no impact on the probability of being on welfare 12 months or 24 months later.
The paper makes a number of contributions. It contributes new evidence to the international literature on the impact of disability reforms in different contexts, and in particular on how such reforms can impact on transitions between alternative welfare payments and on churn off and back on welfare. In doing so, it applies a particularly strong identification strategy. Moreover, it is the first evaluation of this major package of Australian disability reforms to estimate impacts against a defined counterfactual, complementing an earlier ‘before and after’ evaluation carried out in-house by the relevant government department (DEEWR,
2008) and a more recent descriptive study of reform impacts on the time path of the disability benefit roll in Australia (McVicar and Wilkins, 2013).
The rest of the paper is set out as follows. Section 2 describes the pre and post-reform benefit system for people with disability in Australia. Section 3 sets out our approach to estimation, combining matching of accepted disability benefit recipients with those rejected for disability benefits but receiving unemployment benefits with difference-in-differences. Section 4 describes our administrative data covering the relevant population of benefit recipients pre and post-reform. Section 5 presents and discusses our results and Section 6 concludes.
2. Institutional Background and the 2006 Welfare to Work Reform
Over the period of interest here, both pre and post-reform, the Australian welfare system offered support for those with insufficient income due to disability primarily via one of two means-tested payments: the ‘Disability Support Pension’ (DSP) (the nearest Australian equivalent to US Disability Insurance) and ‘New Start Allowance’ (NSA) (unemployment benefit). The key differences between the two payments were first that DSP was paid at a higher rate than NSA, and second that eligibility for NSA typically required ongoing engagement in job search / job preparation activity, although NSA claimants with limited work capacity on the grounds of disability could be granted temporary exemptions from some of these activity requirements.
In practice an individual who experienced physical or mental impairments that might make him or her eligible for DSP would send an application, with supporting evidence from their doctor, to Centrelink, the government agency that is responsible for processing all income support applications. Most individuals making a new claim for DSP were initially placed on NSA (assuming they met the eligibility requirements for NSA), perhaps with temporary
exemption from activity requirements, pending an assessment of their work capacity known as a Job Capacity Assessment (JCA).1 JCAs were conducted by trained and government-employed health professionals, usually face-to-face, on average a few months after the initial claim. The JCA then determined whether the claim for DSP was successful or not, with DSP payments backdated for successful applicants. Those deemed ineligible for DSP as a result of a JCA could remain on NSA, with the outcome of the JCA informing exemption status for activity requirements. There have been further reforms since 2006, outside the period we study here, but the characteristics of these payments and the DSP application process remain largely unchanged today.
2.1. Eligibility for DSP Pre-reform
JCAs assessed both the level of impairment and the work capacity based on those
impairments. For DSP purposes only permanent conditions were taken into account.2 The health assessor first determined the lack of functional capacity in various body functions, resulting from diagnosed conditions, and assigned a point-rating for each body function’s impairment according to the corresponding ‘Impairment Table’ defining a number of ‘impairment points’ for given levels of impairments per body function. A total of twenty or more ‘impairment points’ across all Impairment Tables was a necessary, but not sufficient, condition for eligibility for DSP. The assessor then determined the maximum number of weekly working hours the individual could be expected to perform, given the level of impairment and any available support. To that end, any barriers to finding or maintaining employment, as well as any interventions that might assist in improving the individual’s future work capacity, were taken into account. In addition to the minimum of twenty
1 Immediate access to DSP was granted to those deemed by Centrelink assessors to have a manifest
disability at the time of application, e.g. cases of terminal illness or blindness, subject to meeting the other eligibility requirements. A JCA was not conducted in such cases.
2
A permanent condition in the sense of the law is ‘fully diagnosed, treated and stabilised’. Essentially this is a requirement that the condition leading to the impairment is expected to last for more than two years, and any significant functional improvement is unlikely within that timescale, with or without medical treatment.
impairment points, eligibility for DSP required the individual’s working capacity after interventions and assistance to be less than 30 hours per week for at least the next two years. If both criteria were met the individual was considered to have a ‘continuing inability to work’ and was therefore eligible for DSP.
If one or other criteria was not met the individual was not deemed eligible for DSP but may have qualified for NSA. In this case JCAs were also used to inform activity requirements, which could be reduced so that they did not exceed the recipient’s assessed weekly work capacity. But for NSA recipients the assessment of a ‘partial capacity to work’ followed more lenient criteria than the assessment of a ‘continuing ability to work’. Specifically, all health conditions of an individual were taken into account, regardless of whether they were ‘permanent’ conditions or not, and only current work capacity was relevant: if future work capacity was expected to improve, this did not affect a person’s current eligibility for exemptions from activity requirements.
2.2. Eligibility for DSP Post-reform
Post-reform – i.e. for DSP claims made on or after 1 July 2006 – eligibility for DSP still required a total of twenty or more impairment points across all Impairment Tables. However, in order for an individual to be eligible for DSP , their weekly working capacity was no longer allowed to exceed 15 hours per week (instead of previously 30 hours). In other words those DSP applicants with 20+ impairment points and a working capacity of between 15 and 29 hours per week were no longer eligible for DSP, but instead may have qualified for NSA with reduced activity requirements.
Note that claims made before or on 10 May 2005 were fully grandfathered, i.e. assessed under the old 30-hours-rule, and not affected by future reforms. Claims made between 11 May 2005 and 30 June 2006 were first assessed under the old rules but payments were
granted only temporarily until a re-assessment – a new JCA – under the new hours rule, which was expected to take place about two years after their initial JCA (but in many cases took place considerably later). Claims made after 1 July 2006 were assessed under the new rules from the day of application.
2.3. Disability-related welfare payments
Once a person’s qualification for either DSP or NSA with reduced activity requirements had been assessed, their income (and, if applicable, also spousal income) determined the level of payment. In 2006, the maximum rate of DSP paid to a single person was A$256.34 per week, and the maximum rate paid to a member of a married couple was A$211.85. This payment was equivalent to 48% or 40% of the minimum wage for a full-time employed adult at the time (5.2.2.10 of Guide to Social Security Law Chapter 5.2.2.10). NSA payment rates were (and still are) lower than DSP payment rates: twenty per cent lower for singles (A$205.30 per week) and twelve per cent lower for a member of a married couple (A$185.25). For both payment types, only low additional earnings were permissible, and earnings above the income threshold reduced the payment. NSA tapered off at a faster rate than DSP, in
particular in partner income.3 Relative payments rates for DSP and NSA, means-testing and taper rates remained essentially unchanged during the reform process. However, the change in the hours rule meant that applicants with a working capacity of 15 to 29 hours per week received substantially lower payments at higher activity requirements than would have been the case had they applied prior to the reform
3 For DSP, earnings beyond A$64 (A$114) per week for singles (couples) reduced the total pension by
50 cents (25 cents) per dollar. NSA was reduced by 50 cents per dollar for earnings in excess of A$62 and by 60 cents per dollar of earnings in excess of A$250; if the applicant’s partner has earnings in excess of the amount beyond which NSA would not be payable to the partner, payments to the NSA recipient were reduced by 60 cent per dollar of partner’s earnings beyond this threshold.
3. Approach to Estimation
The way the reform was introduced lends itself to a difference-in-differences estimation of its impacts. Claimants with 20+ impairment points and a work capacity of 15-29 hours per week – who received DSP if they claimed prior to 1 July 2006 but NSA if they claimed on or after 1 July 2006 – are the treatment group. Claimants with 20+ impairment points and a work capacity below 8-14 hours per week – who received DSP regardless of their date of claim – are the control group.4 We include only claims made between 1 July 2005 and 30 June 2007, where the relevant period for claims made before the reform ends on 30 June 2006 and claims made on 1 July 2006 or later are assessed according to the new regulations after the reform. Note that we exclude applications lodged between 11 May 2005 – when the policy was announced – and 30 June 2005 to avoid problems with seasonality not matching up between treatment and control group.
The outcome we analyse here is welfare exit. Specifically, we estimate the reform’s impact on the duration until an individual exits welfare receipt using a continuous-time Cox Proportional-Hazard model. The log-pseudo likelihood function is:
log 𝐿 = ∑ 𝑙𝑒𝑓𝑡𝑖
𝑁
𝑖=1
[𝑇𝑖𝛾1+ 𝐴𝑖𝛾2+ 𝑇𝑖𝐴𝑖𝛿𝑐 + 𝑇𝑖𝐴𝑖𝑡𝛿𝑡]
where 𝑖 = 1, … , 𝑁 is the set of all individuals in treatment and control group who are at risk of leaving welfare, that is anyone applied for DSP between 1 July 2005 and 30 June 2007 assessed to have a working capacity between 8 and 29 hours per week. The dummy
𝑇𝑖 indicates the treatment group and takes the value one for individuals with an assessed working capacity of 15 to 29 hours per week, and zero for all individuals with working capacity 8 to 14 hours per week. The dummy variable 𝐴𝑖 indicates whether an observation
4 Work capacity is assessed in bands – work capacity bandwidth (WCB) – rather than as a continuous
belongs to the period after the new regulations were introduced and takes the value one for claimants who aplied between 1 July 2006 and 30 June 2007, and the value zero for claimants who applied between 1 July 2005 and 30 June 2006. t is the time that has passed since the beginning of the spell; i.e., the effect of the reform is allowed to vary over time. 𝑙𝑒𝑓𝑡𝑖 is a
dummy variable that indicates whether individual i has left welfare during the observation period [𝑡0𝑖𝑡𝑖), where 𝑡𝑖 is the time of censoring (two years after the start of spell) or of leaving welfare for individual 𝑖. We define an individual as having left welfare if they were not eligible for any income-replacement payment for at least one day; mere suspension of payments is not defined as an exit from welfare.
Maximising this likelihood function yields an estimate of the hazard rate:
𝜆𝑖(𝑡) = 𝑒𝑥𝑝(𝑇𝑖𝛾1+ 𝐴𝑖𝛾2+ 𝑇𝑖𝐴𝑖𝛿𝑐+ 𝑇𝑖𝐴𝑖𝑡𝛿𝑡).
The estimated reform impact on the hazard rate for leaving welfare is given by exp (𝛿𝑐 +
𝑡𝛿𝑡).
They key issue here is of course the extent to which treatment status (being subject to the new hours rule) can be treated as exogenous. In this respect, our approach has two distinct advantages. First, in the spirit of Bound (1989), the analysis is based on comparing successful applicants for DSP with rejected applicants for DSP who instead receive NSA. As Bound (1989) (and after him, Chen & van der Klaauw, 2008; von Wachter, Song & Manchester, 2011; Giertz & Kubik, 2011) argues, rejected and successful applicants are likely to be much more similar to each other than they are to the general population, both in observed and unobserved factors, thus reducing any potential bias arising from selection. Second, the analysis makes use of variations in benefit eligibility rules over time, with DSP applications for a given level of health impairment that results in a given level of work capacity either accepted or rejected depending solely on an arbitrary cut-off date. Using such variation over
time (as in Gruber, 2000; Campolieti, 2004; Mitra, 2009; de Jong et al., 2011, Staubli, 2011),
in conjunction with a sample that consists of succesful or rejected DSP applicants only, means that many of the potential selection issues that could confound our estimated treatment effects are absent. Moreover, a credible control group for which no such changes in criteria occurred, is available. But some challenges for the estimator’s validity of course remain.
3.1. Validity of the estimator
We consider three potential problems that we cannot rule out ex ante and that could cause the estimation to be biased: i) the assumption of a common time trend for control group and treatment group could be violated; ii) the timing of the DSP application could be potentially endogneous, and iii) the assessment criteria of one’s weekly working capacity have changed during the reform (albeit only slightly), thus potentially altering the relative characteristics of the treatment and control groups after the reform compared to before the reform. In each case we explore the possible extent of any biases using robustness checks.
First, the common time trend assumption cannot be tested for any period prior to the time window of analysis around the reform itself because before 11 May 2005 an individual’s working capacity was only assessed to be lower or greater than 30 hours per week. Since we cannot distinguish between those below and above 15 hours of working capacity per week for earlier applicants, we cannot confirm whether both groups followed similar time trends in terms of welfare dependency rates. Even if that were possible the time trends of the past do not necessarily extend into the future. In particular, the latest applicants included in the analysis – those who applied in June 2007 – faced a labour market impacted by the global financial crisis (GFC) just over a year after their application. In contrast, the two year time window for the earliest applicants (May 2005) ends well before the GFC. If the GFC’s effect on an individual’s chances of exiting welfare recipiency varied with their working capacity,
the assumption of a common time trend would no longer be valid even if such a common trend had been observed in the data prior to the reform. It is theoretically ambiguous what sign such a bias, if it exists, would take. While those with a lower working capacity are likely to have a lower chance of exiting welfare, it is unclear whether that implies a more or less elastic response to general economic conditions. Note, however, that the labour market and welfare dependency effects of the GFC were comparatively modest in Australia, with little evidence of significant heterogeneity across a variety of socio-economic dimensions (Kuehnle and Scutella, 2011). Nevertheless, as a robustness check we repeat the estimation restricted to a twelve-month window of observation after application, which means the last month of observation is July 2008, largely preceeding any Australian labour market impact of the GFC.
Second, the timing of one’s DSP application might be endogeneous. While some health impairments feature a sudden onset (for example those caused by work accidents), others may result from a chronic, slow deterioration of an indivdiual’s health. In the latter case, or where a long-running health impairment has not previously led to a DSP claim, there is potential to influence the exact date of application. If so, those who apply just before 30 June 2006 might differ from those who apply just after this cut-off date in the type or longevity of their health impairments as well as in their unobserved characteristics. In particular, it seems reasonable to assume those who apply just after the cut-off date are a positive selection of all applicants in terms of their probability of becoming independent from welfare. If this is the case, any potential activating effect of reduced payments and increased activity requirements would be exaggerated, meaning that our estimated reform effect is an upper bound. We therefore test whether our results are robust to the exclusion of applicants who applied one or three months before or after the cut-off-date.
Third, the criteria that determine an indvidual’s weekly work capacity differ depending on whether the JCA is made in the context of a DSP claim or an NSA claim. When an indivdiual’s work capacity is assessed for a DSP application, only permanent conditions are taken into account. Post-reform, according to this assessment, an individual may be deemed not eligible for DSP if their permanent conditions do not reduce their working capacity to 14 hours per week or less. The indivdiual might then be re-assessed for an NSA claim, where all conditions are taken into account regardless of their expected duration. The result of this assessment can now differ from the first result. In particular, it is possible that an individual is assessed as having a work capacity of 15 to 29 hours per week for DSP purposes (and is thus excluded from the post-reform control group), but of 8 to 14 hours per week for NSA purposes (and is thus excluded from the post-reform treatment group). As a result, the composition of the treatment and control groups in terms of the relative types and longevity of health impairments may differ before and after the reform. It is unclear to what extent and in what direction this might bias the results. We therefore investigate sensitivity by re-estimating with a sub-group of individuals who do not have a non-permanent recorded health condition, and who would therefore be expected to be classified into the same work capacity bandwidth (WCB) for both DSP and NSA purposes.
4. Data
The primary data source for the proposed research is the Research and Evaluation Database
(RED), which contains detailed administrative records for the full population of welfare recipients in Australia. For each individual who has ever received any form of welfare over our period of study (and long before) the exact history of welfare spells with beginning and end of the spell as well as payment type and amount is recorded on a daily basis. The records
were extracted - and thus the maximum period of observation ends – as of 30 June 2012. Additional information recorded in the RED includes gender, age, number of children, the results of the JCA, the type of their primary health impairment in broad categories (such as psychological impairment or muscular/skeletal impairment), and the number of ‘impairment points’. Temporary suspensions of payments or exemptions from activity requirements are also recorded.
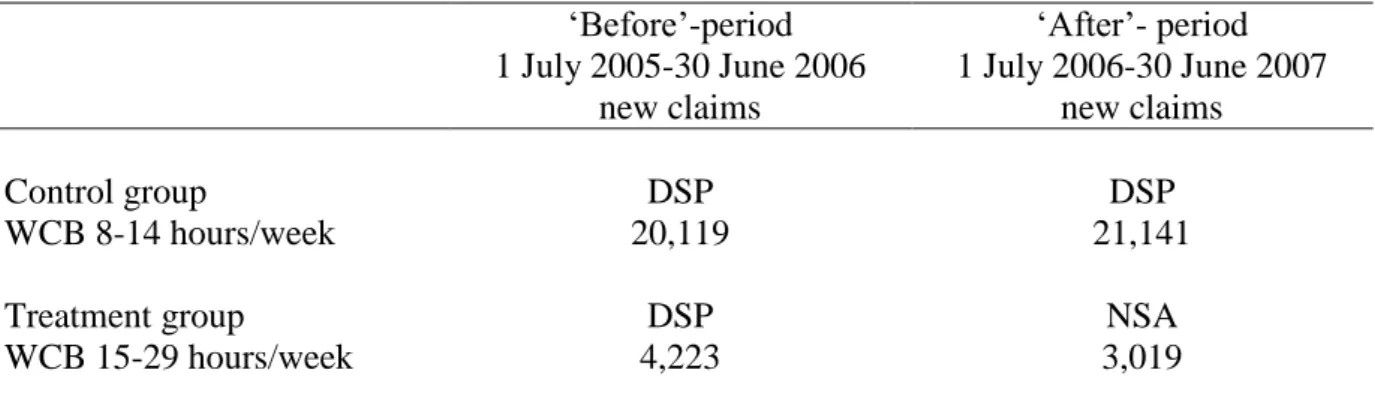
Because RED is not a random sample but contains the full population of interest, the number of available observations is very high, which allows us to restrict the analysis to DSP applicants either side of the 15 hours work capacity cut-off and in a relatively small time-window. There were a total of 51992 applications for DSP between 1 July 2005 and 30 June 2007 that resulted in a spell of DSP or NSA receipt after individuals had subsequently been assessed as having a weekly work capacity of 8-14 hours per week or 15-29 hours per week. Of those, we exclude 3,490 individuals where information regarding the date, result of their assessment, the type of payment they receive after their assessment, or the regulations under which they were assessed does not allow us to unambiguously identify whether they are members of the control- or treatment group or subject to the regulations of the before- or after-period.5 The remaining 48,502 individuals are distributed across the two groups and periods as shown in Table 1.
Table 1 around here
A disadvantage of the RED data, as with other similar administrative data sets, is a lack of universal information on socioeconomic characteristics. But we are able to augment the RED data with linked information from the Job Seeker Classification Instrument (JSCI). This is an
5 The data contain a flag indicating whether an individual was assessed under the transition rules or
under the rules in place after full implementation of the 2006 reform, the date of lodgement and assessment of their claim, the result of their assessments and the type of payment they receive. In some cases, those entries do not yield a consistent picture, and are therefore omitted.
interview that is typically conducted at the time when an individual claims a benefit, or registers with the administering office (Centrelink), and is used to classify individuals according to their distance to the labour market. The JSCI contains predominantly self-reported information on an individual’s education, language skills, and their recent work experience. The postcode of the individual’s residential address is used to provide some additional information such as the remoteness of the area of residence. The information from a JSCI interview is not updated unless any changes in an individual’s life circumstances warrant a change in their service arrangements. Some of the changes in time-varying characteristics will thus not be picked up. We treat information on highest education level and English language proficiency as permanent until there is an update by a new interview. Geographic location and recent work experience, on the other hand, are used only if the last JSCI interview was conducted no more than one year ago, and are treated as ‘missing’ otherwise.
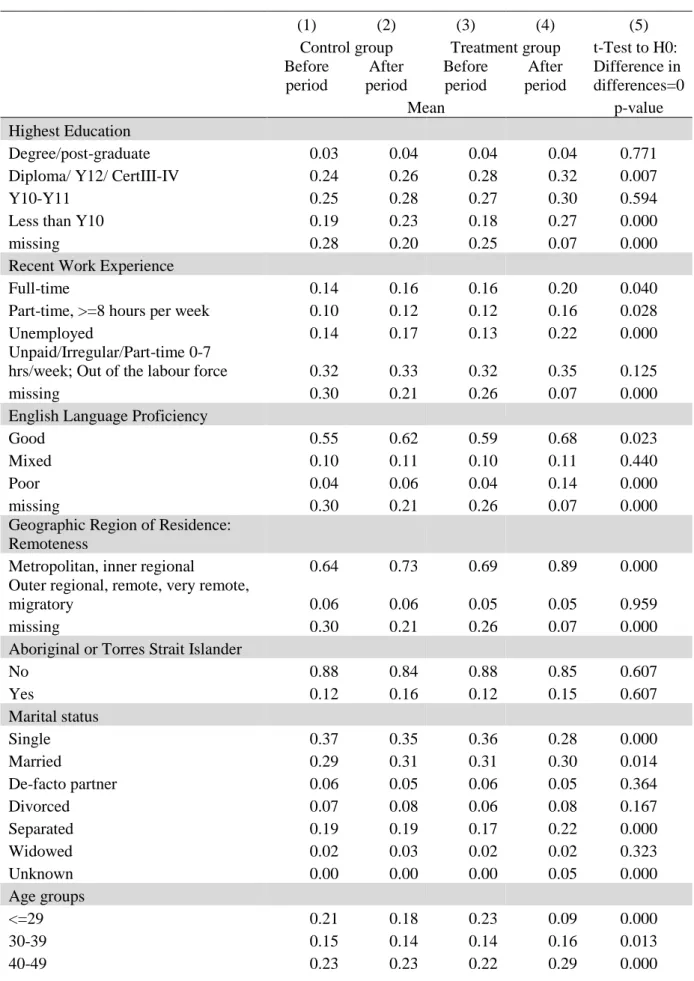
Table 2 shows characteristics of members of the treatment and control group who applied for DSP before and after the reform, at the time of their application. The last column shows the result of a t-test for whether the change in a mean characteristic in the control group over time is statistically significantly different from the change in the same characteristic in the treatment group over time. There are several differences that are statistically significant, some of which might plausibly be correlated with our outcomes of interest.
Table 2 around here
We therefore apply a three-nearest-neighbour matching procedure, which combines exact matching on age group with propensity score matching on all other characteristics in Table
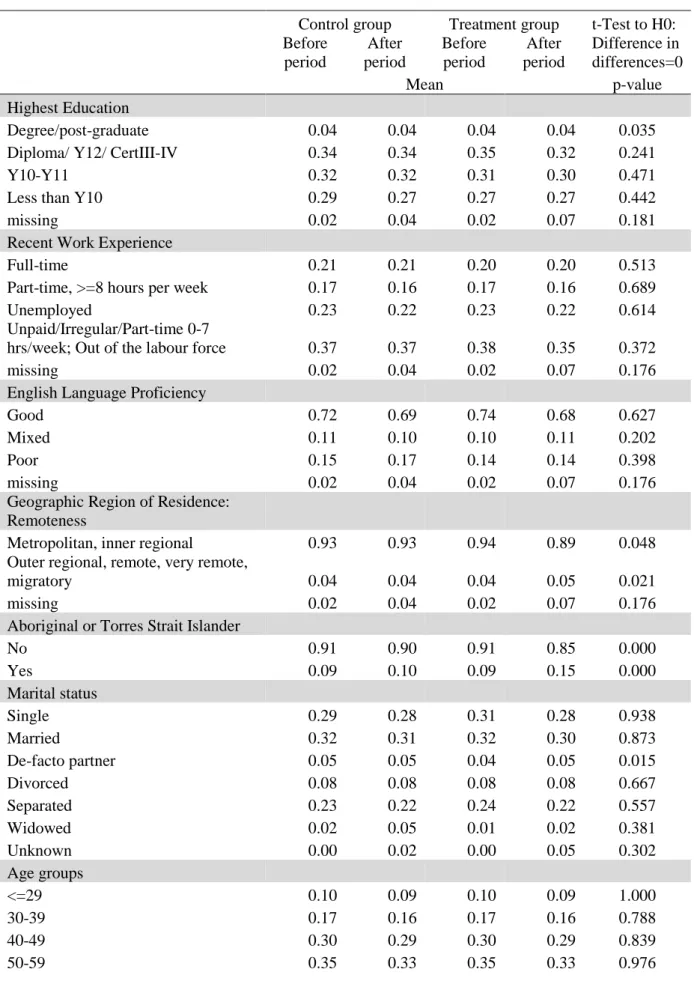
2.6 All observations are first separated by age category. Within each age category, each member in the after group is first matched to matching partners from the treatment-before group: we predict the propensity score of being in the treatment-after group based on all characteristics in Table 2. The three members in the treatment-before group whose propensity score is closest to the individual in question from the treatment-after group are selected. The same member of the treatment-before group can be selected multiple times (matching with replacement). An analogous procedure is applied to select three matching partners from the control-after group, and finally three from the control-before group. This results in a sample of 11,217 observations with a total weight of 11,804, who are well balanced in all characteristics and in the age distribution in particular, as shown in Table 3. All remaining analysis is conducted using this matched sample.
Table 3 around here
5. Results and Discussion
We first estimate the hazard rate for leaving welfare (whether directly from one‘s current payment or indirectly via another type of payment). The left hand columns of Table 4 show the coefficients and associated standard errors, and the right column the exponentiated coefficients of the model, i.e the factor by which an increase in a given characteristic increases the hazard rate for leaving welfare at any given point in time. Unsurprisingly, individuals with a WCB of 15-29 hours/week are significantly more likely to leave welfare compared to individuals with a WCB of 8-14 hours/week; the groups’ hazard rates for leaving welfare differ by a factor of 2.4. Applicants who lodged their claims after 1 July 2006
6 We have also applied radius-caliper matching, kernel matching and nearest-neighbour-matching with
fewer and more matching partners with reasonable results; however, nearest-neighbour matching with three neighbours provided the best matching quality in terms of balancing the sample and using as many different individuals as possible. The results of other matching procedures are available from the authors.
have a higher chance of leaving welfare afterwards; regardless of whether they are in the treatment or control group, their hazard rate is 26 per cent higher than that of applicants who lodged their claim earlier. The interaction effect of both is positive and significant at the 5 per cent level; the reform increases an IS recipients’ hazard rate for exiting welfare by 55 per cent on the first day of the spell. The longer the benefit spell lasts, the smaller the positive effect of the reform on the hazard becomes.
Table 4 around here
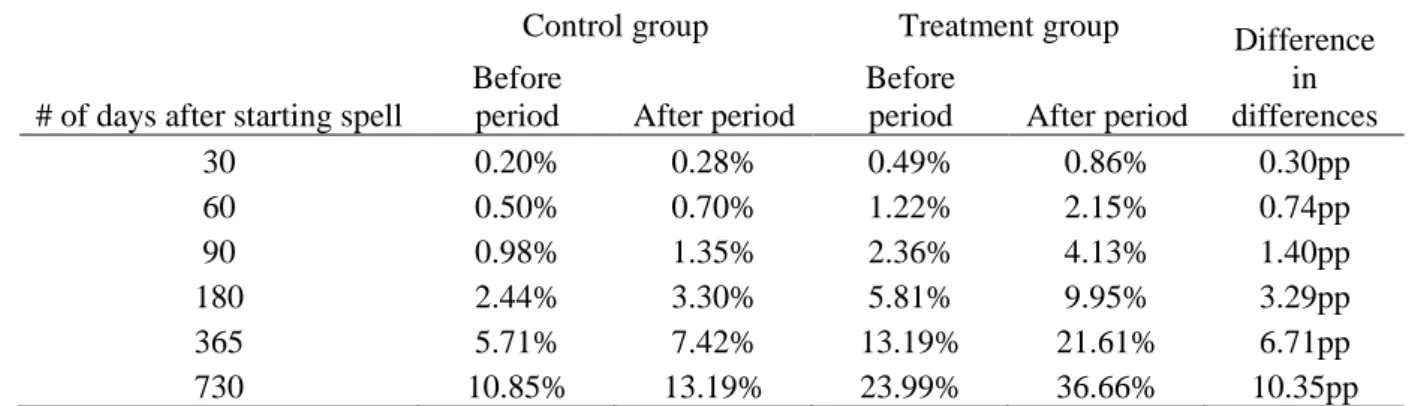
For ease of interpretation, Table 5 shows how the difference in the hazard rate for leaving welfare across groups accumulates over time (the cumulative hazard). The increase in the hazard rate for leaving welfare described above implies the reform has increased a recipient‘s chance of leaving welfare within six, 12, or 24 months after commencing a spell of disability-related payments by 3.3, 6.7 and 10.4 percentage points, respectively. That is, the probability of leaving welfare within one year (two years) is increased by nearly 50% (more than 40%) because of the reform for those with a weekly working capacity between 15 and 29 hours. This is a big effect.
Table 5 around here
5.1. Staying off welfare
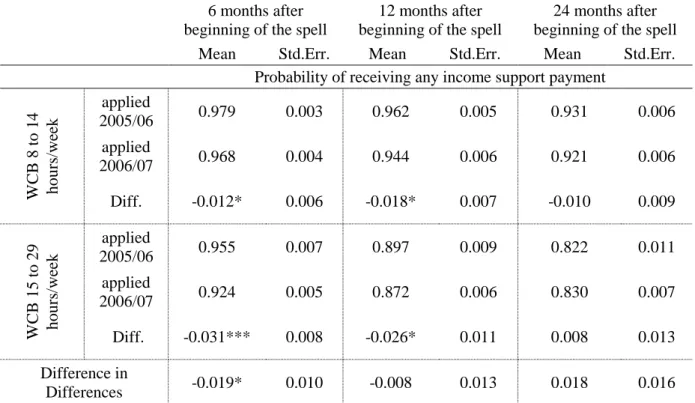
Table 6 shows the estimated probability that DSP applicants are still in receipt or welfare six months, 12 months and 24 months after claiming a disability-related payment. A claimant can still be on welfare either because they have not yet exited or because they have exited and subsequently returned to welfare. The probabilities shown are predicted probabilities, as well as predicted differences in probabilities, from logit-models of welfare receipt at the relevant points in time. All logit-models control for all characteristics included in Table 3.
Probabilities and differences in probabilities are predicted for each individual at their observed characteristics, and then averaged over all individuals. Individuals in the treatment group were slightly less likely to receive welfare six months and twelve months after the first day of their original spell if their original spell started after 1 July 2006 than if it had started earlier. The same, however, is true for individuals in the control group. Looking at the difference-in-differences, we see that the reform seems to have slightly reduced the probability of relying on welfare six months after the original spell began, but only by two percentage points. After that, the effect disappears completely. Although the 2006 reform appears to encourage exits from welfare (Tables 4 and 5), it seems to have hardly any effect on the overall probability of receiving welfare once re-entry to welfare is taken into account.
Table 6 around here
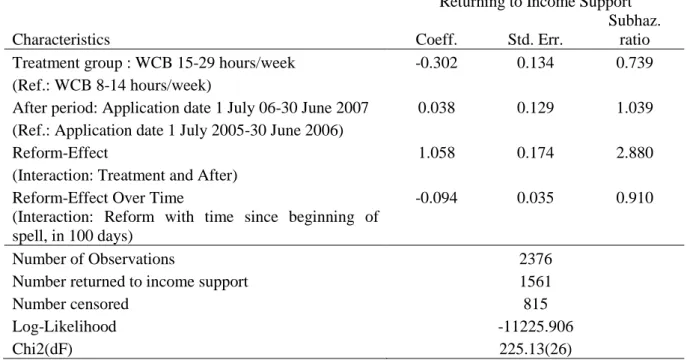
To explore this further we analyse the return behaviour of the sub-sample of 2,376 individuals who exit welfare for at least one day within two years of the commencement of their DSP or NSA spell. For this sub-sample, we model the duration until return to welfare, regardless of payment type, within one year of originally leaving welfare. Results are presented in Table 7.
Table 7 around here
The left hand columns of Table 7 show the resulting hazard rate for re-entry to welfare and how it is affected by the reform. The estimates suggest that the reform increases the risk of re-entry to nearly three times the original return rate on the first day after having left welfare, as indicated by the hazard ratio of 2.88 for membership of the treatment-after group. The longer the individual stays off welfare, the less the reform increases their risk of returning.
The cumulative effect of this increase in the hazard rate is large, as shown in Table 8. While prior to the reform only 36 per cent of those with the relevant WCB who left welfare returned within one year, this is true for 67 per cent of the same group after the reform. In other words: before the 2006 reform, 24 per cent of welfare recipients in the treatment group left welfare (see table 5), and 64 per cent of those welfare-exiters did not return within a year (see Table 8). This leaves about 15 per cent of the original treatment group who leave welfare and remain independent from welfare payments a year later. After the reform, 37 per cent left welfare, but only 34 per cent of these welfare-exiters do not return within a year. Post-reform, 13 per cent of the treatment group leaves welfare and actually remains independent from welfare one year later. In sum, the proprotion of DSP claimants who exit and then remain off welfare for any prolonged period of time is essentially unchanged by the reform.
Table 8 around here
A complementary explanation for the apparently limited effectiveness of the reform is that some individuals who might have left welfare because of the differences in conditionality and payment levels between DSP and NSA may instead re-apply for DSP or apply for other less conditional and/or more generous benefit types. In that case, an individual might never leave welfare, but might end their current benefit spell and begin a new spell on an alternative payment the very next day.
To explore this we estimate the duration until an individual experiences a change in benefit type without having left welfare previously as a competing risks type model, where if an individual leaves welfare they are no longer at risk of switching benefit types and are thus treated as censored in the estimation. Table 9 shows the impact of the 2006 reform on the hazard rate of ending receipt of one’s current type and switching to another. The results clearly show a significant reform impact: the corrsponding hazard rate increases by a factor
of more than 1.2 on the first day of receiving a disability-related welfare payment, and increases further with the duration of the benefit spell.
Table 9 around here
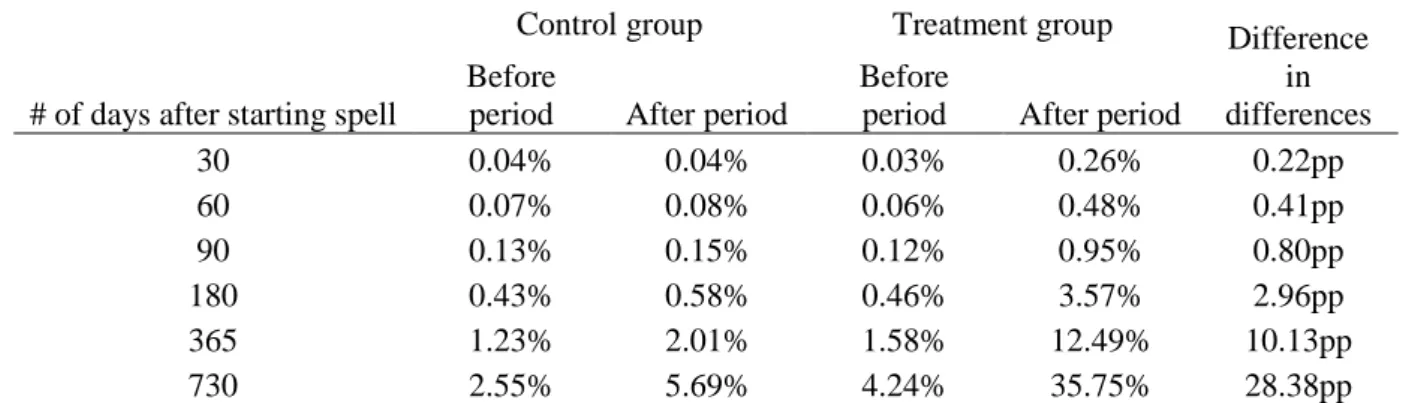
To illustrate how these generate large cumulative effects, Table 10 shows the probability of having switched benefit types after a certain amount of time has passed since commencement of the original disability-related welfare spell. After two years, one in three recipients in the treatment-after group have switched benefit types, which was the case for only four per cent of those in the same group before the reform.
Table 10 around here
Table 11 cross-tabulates the benefit type of the original spell with that of the subsequent welfare spell for the 1,239 individuals who switched benefit types within two years of commencing their original welfare spell. First, about three in four of all benefit switchers received NSA in their original spell, i.e. were part of the treatment-after group. And second, while nearly all DSP receipients who switch benefit types go on to subsequently receive and age pension or widow’s pension, the vast majority of NSA recipients goes on to receive DSP, which requires a re-assessment of their WCB with the result that their WCB is assessed to be below 15 hours/week. This suggests that, rather than increasing independence from welfare as orginally intended, a major impact of the reform was to trigger re-assessments that resulted in lower assessed WCB than previously.
Table 11 around here
5.2. Robustness checks
As discussed in section 3, there are some potential threats to our estimator’s validity that we cannot rule out ex ante. To restate, these concern possible endogeneity in the timing of the
original DSP claim, the possibility that the health conditions taken into account to determine one’s eligibility for DSP are generally more severe than those taken into account for NSA purposes (the former including only permanent, the latter also temporary conditions), and the possibility that the onset of the GFC differentially altered the labour market conditions facing post-reform claimants in the treatment and control groups. We test the impact of the first problem by excluding welfare recipients who lodged their application one or three months before and after 1 July 2006; the second by limiting the estimation sample to individuals who have only conditions that are considered permanent, i.e. whose assessment for DSP and NSA purposes would rely on the same set of conditions; and the third by censoring every welfare recipient in the estimation sample after 365 days, which means that the latest applicant in the sample on 30 June 2007 is censored on 30 June 2008 and thus before the GFC began to impact on the Australian labour market.
Table 12 shows, for different sample restrictions or specifications, the cumulated probability of having left welfare after six months, 12 months or 24 months. The corresponding baseline estimates were shown in Table 5. The results show that the total reform effect is qualitatively unchanged and is also reasonably stable in magnitude if we account for possible changes in the composition of the treatment group either due to differential GFC impacts, endogenous timing of initial claims, or because of the differences in JCA assessment rules for DSP and NSA purposes.
Table 12 around here
We also present estimates for an alternative competing risks model in Table 12. We have already shown reform impacts on exiting welfare and on switching welfare payments. These are not technically competing risks in the sense that the event ‘switching to a different payment type’ does not prevent the event ‘leaving welfare receipt’ from happening. However,
once an individual draws another benefit type, any subsequent full exit from welfare receipt will no longer be directly influenced by the reform, and is thus of less interest for our purposes. If, instead of estimating the hazard for leaving welfare regardless of whether it is a direct exit or an indirect exit via another payment as in Table 4, we estimate the hazard for existing welfare from your current payment in the framework of a competing risks hazard model, the reform’s estimated effect on the probability of leaving welfare remains essentially unchanged.
We perform similar robustness checks for the estimates presented in Table 6, shown in Table 13. Our baseline estimate is that an indivdiual is 1.9 percentage points less likely to be in receipt of welfare six months after their original spell began if they are subject to the reform. This result remains virtually unchanged if we exclude individuals who applied close to the cut-off date, or those with non-permanent conditions. In other words the result is not driven by changes in the relative composition of the treatment and control groups. Any such reform impact disappears in our baseline estimation within a year, whether we include or exclude applications close to the cut-off date and whether we include or exclude individuals with non-permenent conditions. There is an apparent statistically significant impact of the reform after two years, however, where we exclude individuals with non-permanent conditions. But this is positive, i.e. the suggestion is that the reform increases the probability of being on welfare two years after the start of the initial spell once we wash out possible compositional changes due to differences in DSP and NSA work capacity assessments. In other words, there is nothing here that leads us to question our conclusion that the 2006 reform did not lead to reduced welfare dependency among people with disability.
6. Concluding Remarks
This paper examines a major 2006 reform to Australian welfare benefits for people with disability. The reform both reduced the generosity and increased the conditionality of welfare payments by shifting partially disabled disability benefit claimants from disability benefits to unemployment benefits. This led to increases among partially disabled welfare recipients in the hazards for exiting welfare and for switching (back) from unemployment to disability benefits. It also led to an increase in the hazard for returning to welfare for those having previously exited welfare. Overall the reform had no impact on the probability of being on welfare 12 months or 24 months later. So there is no evidence of ‘turning the supertanker’ here, but there is evidence of displacement onto alternative benefits – ‘squeezing the balloon’ – broadly consistent with that found by Karlstrom et al. (2008) and Staubli (2011) for related reforms in Sweden and Austria respectively, although in the Australian case it is the switch
back from NSA (unemployment insurance) to DSP (disability insurance) that is of most interest.
The suggestion is that disability reforms need to do more than simply reduce the generosity and tighten the conditionality of payments – with the associated risk of exacerbating the already high levels of poverty experienced by people with disability in some countries (e.g. OECD, 2010) – if they are to substantially impact on welfare dependence among people with disability. People with disability face barriers to employment that these measures, in isolation, are unlikely to overcome. For example, one aspect missing from these reforms is any serious attempt to address the incentives of employers and potential employers of people with disability. This was a major element of recent reforms to disability programs in the Netherlands, which has seen a dramatic turnaround in disability program growth which seems unlikely to have been entirely coincidental (see Burkhauser et al., 2014).
Table 1: Payment Type and Number of Observations for Treatment and Control Groups ‘Before’-period 1 July 2005-30 June 2006 new claims ‘After’- period 1 July 2006-30 June 2007 new claims Control group WCB 8-14 hours/week DSP 20,119 DSP 21,141 Treatment group WCB 15-29 hours/week DSP 4,223 NSA 3,019
Notes: WCB = work capacity bandwidth, i.e. the weekly hours of work the claimant is assessed of being capable of. DSP = Disability Support Pension, i.e. the primary disability benefit in Australia, which is paid at a more generous rate than NSA and is not conditioned on job preparation activity requirements. NSA = New Start Allowance, i.e. unemployment benefit, which is paid at a less generous rate than DSP and is conditioned on job search and job preparation requirements, although with some exemptions for those assessed as having a WCB of 15-29 hours.
Table 2: Characteristics of Control and Treatment Groups Before and After Treatment, Pre-Matching
(1) (2) (3) (4) (5)
Control group Treatment group t-Test to H0:
Difference in differences=0 Before period After period Before period After period Mean p-value Highest Education Degree/post-graduate 0.03 0.04 0.04 0.04 0.771
Diploma/ Y12/ CertIII-IV 0.24 0.26 0.28 0.32 0.007
Y10-Y11 0.25 0.28 0.27 0.30 0.594
Less than Y10 0.19 0.23 0.18 0.27 0.000
missing 0.28 0.20 0.25 0.07 0.000
Recent Work Experience
Full-time 0.14 0.16 0.16 0.20 0.040
Part-time, >=8 hours per week 0.10 0.12 0.12 0.16 0.028
Unemployed 0.14 0.17 0.13 0.22 0.000
Unpaid/Irregular/Part-time 0-7
hrs/week; Out of the labour force 0.32 0.33 0.32 0.35 0.125
missing 0.30 0.21 0.26 0.07 0.000
English Language Proficiency
Good 0.55 0.62 0.59 0.68 0.023
Mixed 0.10 0.11 0.10 0.11 0.440
Poor 0.04 0.06 0.04 0.14 0.000
missing 0.30 0.21 0.26 0.07 0.000
Geographic Region of Residence: Remoteness
Metropolitan, inner regional 0.64 0.73 0.69 0.89 0.000
Outer regional, remote, very remote,
migratory 0.06 0.06 0.05 0.05 0.959
missing 0.30 0.21 0.26 0.07 0.000
Aboriginal or Torres Strait Islander
No 0.88 0.84 0.88 0.85 0.607 Yes 0.12 0.16 0.12 0.15 0.607 Marital status Single 0.37 0.35 0.36 0.28 0.000 Married 0.29 0.31 0.31 0.30 0.014 De-facto partner 0.06 0.05 0.06 0.05 0.364 Divorced 0.07 0.08 0.06 0.08 0.167 Separated 0.19 0.19 0.17 0.22 0.000 Widowed 0.02 0.03 0.02 0.02 0.323 Unknown 0.00 0.00 0.00 0.05 0.000 Age groups <=29 0.21 0.18 0.23 0.09 0.000 30-39 0.15 0.14 0.14 0.16 0.013 40-49 0.23 0.23 0.22 0.29 0.000
50-59 0.30 0.31 0.22 0.33 0.000 >=60 0.11 0.14 0.18 0.13 0.000 Gender Female 0.44 0.46 0.40 0.46 0.005 Male 0.56 0.54 0.60 0.54 0.005 # of observations 20119 21141 4223 3019
Table 3: Characteristics of Control and Treatment Groups Before and After Treatment, Post-Matching
Control group Treatment group t-Test to H0:
Difference in differences=0 Before period After period Before period After period Mean p-value Highest Education Degree/post-graduate 0.04 0.04 0.04 0.04 0.035
Diploma/ Y12/ CertIII-IV 0.34 0.34 0.35 0.32 0.241
Y10-Y11 0.32 0.32 0.31 0.30 0.471
Less than Y10 0.29 0.27 0.27 0.27 0.442
missing 0.02 0.04 0.02 0.07 0.181
Recent Work Experience
Full-time 0.21 0.21 0.20 0.20 0.513
Part-time, >=8 hours per week 0.17 0.16 0.17 0.16 0.689
Unemployed 0.23 0.22 0.23 0.22 0.614
Unpaid/Irregular/Part-time 0-7
hrs/week; Out of the labour force 0.37 0.37 0.38 0.35 0.372
missing 0.02 0.04 0.02 0.07 0.176
English Language Proficiency
Good 0.72 0.69 0.74 0.68 0.627
Mixed 0.11 0.10 0.10 0.11 0.202
Poor 0.15 0.17 0.14 0.14 0.398
missing 0.02 0.04 0.02 0.07 0.176
Geographic Region of Residence: Remoteness
Metropolitan, inner regional 0.93 0.93 0.94 0.89 0.048
Outer regional, remote, very remote,
migratory 0.04 0.04 0.04 0.05 0.021
missing 0.02 0.04 0.02 0.07 0.176
Aboriginal or Torres Strait Islander
No 0.91 0.90 0.91 0.85 0.000 Yes 0.09 0.10 0.09 0.15 0.000 Marital status Single 0.29 0.28 0.31 0.28 0.938 Married 0.32 0.31 0.32 0.30 0.873 De-facto partner 0.05 0.05 0.04 0.05 0.015 Divorced 0.08 0.08 0.08 0.08 0.667 Separated 0.23 0.22 0.24 0.22 0.557 Widowed 0.02 0.05 0.01 0.02 0.381 Unknown 0.00 0.02 0.00 0.05 0.302 Age groups <=29 0.10 0.09 0.10 0.09 1.000 30-39 0.17 0.16 0.17 0.16 0.788 40-49 0.30 0.29 0.30 0.29 0.839 50-59 0.35 0.33 0.35 0.33 0.976
>=60 0.09 0.13 0.09 0.13 0.981 Gender Female 0.42 0.42 0.44 0.46 0.615 Male 0.58 0.58 0.56 0.54 0.615 # individuals 3102 3232 1864 3019 Total weight 2885 3019 2881 3019
Notes: All ‘treatment-after’-observations are included; from all other groups, up to three matching partners are selected per member of the ‘treatment-after’-group. Column (5) reports the p-value for testing that [(2)-(1)]-[(4)-(3)] equals zero.
Table 4: Estimated Reform Impacts on the Hazard Rate for Exiting Welfare (Income Support), Single Risk
Leaving Income Support
Coeff. Std. Err. Haz. Ratio
Treatment group : WCB 15-29 hours/week 0.871*** 0.096 2.389
(Ref.: WCB 8-14 hours/week)
After period: Application date 1 July 06-30 June 2007 0.211* 0.103 1.234
(Ref.: Application date 1 July 2005-30 June 2006)
Reform-Effect 0.439** 0.155 1.552
(Interaction: Treatment and After)
Reform-Effect Over Time -0.040 0.025 0.961
(Interaction: Reform with time since beginning of spell, in 100 days) Number of Observations 11207 Number left IS 2440 Number censored 8767 Log-Likelihood -21506.587 Chi2(dF) 464.34(4)
Table 5 Cumulative Hazard of Having Exited Income Support (Single Risk)
# of days after starting spell
Control group Treatment group Difference
in differences Before
period After period
Before
period After period
30 0.20% 0.28% 0.49% 0.86% 0.30pp 60 0.50% 0.70% 1.22% 2.15% 0.74pp 90 0.98% 1.35% 2.36% 4.13% 1.40pp 180 2.44% 3.30% 5.81% 9.95% 3.29pp 365 5.71% 7.42% 13.19% 21.61% 6.71pp 730 10.85% 13.19% 23.99% 36.66% 10.35pp
Table 6: Overall Probability of Being in Receipt of Any Income Support Payment
6 months after beginning of the spell
12 months after beginning of the spell
24 months after beginning of the spell
Mean Std.Err. Mean Std.Err. Mean Std.Err.
Probability of receiving any income support payment
WCB 8 t o 1 4 hour s/ w ee k applied 2005/06 0.979 0.003 0.962 0.005 0.931 0.006 applied 2006/07 0.968 0.004 0.944 0.006 0.921 0.006 Diff. -0.012* 0.006 -0.018* 0.007 -0.010 0.009 WCB 15 t o 29 hour s/ w ee k applied 2005/06 0.955 0.007 0.897 0.009 0.822 0.011 applied 2006/07 0.924 0.005 0.872 0.006 0.830 0.007 Diff. -0.031*** 0.008 -0.026* 0.011 0.008 0.013 Difference in Differences -0.019* 0.010 -0.008 0.013 0.018 0.016
Notes: ***, ** and * indicate significance at the 0.1%, 1% and 5%-level for differences over time as well as for the difference in difference. To improve readability, stars indicating significance were dropped for total rates of income support receipt per group.
Table 7: Estimated Reform Impact on the Hazard Rate for Returning to Income Support, Single Risk
Returning to Income Support
Characteristics Coeff. Std. Err.
Subhaz. ratio
Treatment group : WCB 15-29 hours/week -0.302 0.134 0.739
(Ref.: WCB 8-14 hours/week)
After period: Application date 1 July 06-30 June 2007 0.038 0.129 1.039
(Ref.: Application date 1 July 2005-30 June 2006)
Reform-Effect 1.058 0.174 2.880
(Interaction: Treatment and After)
Reform-Effect Over Time -0.094 0.035 0.910
(Interaction: Reform with time since beginning of spell, in 100 days)
Number of Observations 2376
Number returned to income support 1561
Number censored 815
Log-Likelihood -11225.906
Chi2(dF) 225.13(26)
Table 8: Cumulative Hazard of Having Returned to Income Support
Control group Treatment group Difference
in differences # of days after leaving IS
Before
period After period
Before
period After period
30 10.31% 11.86% 8.70% 20.04% 9.80pp
60 18.07% 20.44% 15.20% 33.33% 15.76pp
90 22.76% 25.49% 19.11% 40.67% 18.83pp
180 33.09% 36.10% 27.57% 54.92% 24.33pp
Table 9: Estimated Reform Impacts on the Hazard Rate for Leaving Current Benefit Type
Switching benefit type
Characteristics Coeff. Std. Err. Haz. Ratio
Treatment group : WCB 15-29 hours/week 0.506 0.177 1.659
(Ref.: WCB 8-14 hours/week)
After period: Application date 1 July 06-30 June 2007 0.799 0.388 2.223
(Ref.: Application date 1 July 2005-30 June 2006)
Reform-Effect 0.186 0.306 1.204
(Interaction: Treatment and After)
Reform-Effect Over Time 0.314 0.055 1.368
(Interaction: Reform with time since beginning of spell, in 100 days)
Number of Observations 11207
Number left IS 1239
Number censored 7602
Number switched benefit type 2366
Log-Likelihood -10302.855
Chi2(dF) 592.27(4)
Table 10: Cumulative Hazard of Having Switched Benefit Type
# of days after starting spell
Control group Treatment group Difference
in differences Before
period After period
Before
period After period
30 0.04% 0.04% 0.03% 0.26% 0.22pp 60 0.07% 0.08% 0.06% 0.48% 0.41pp 90 0.13% 0.15% 0.12% 0.95% 0.80pp 180 0.43% 0.58% 0.46% 3.57% 2.96pp 365 1.23% 2.01% 1.58% 12.49% 10.13pp 730 2.55% 5.69% 4.24% 35.75% 28.38pp
Table 11: Benefit types received by those who switch
Benefit Types: Original Spell
Benefit Types: Subsequent Spell DSP NSA Total
Age pension/Widow's pension 316 47 363
DSP 0 713 713
NSA 6 0 6
other 15 142 157
Table 12: Reform Impact on Cumulative Hazard of Having Exited Income Support (Single Risk) – Different Specifications
Change in Cumulated Hazard Rate After: 180 days 365 days 730 days
Baseline Estimation 3.29% 6.71% 10.35%
Exclude one month before and after 30 June 2006 3.05% 6.20% 9.64%
Exclude three month before and after 30/06/2006 3.64% 7.18% 11.08%
Exclude individuals with non-permanent conditions 2.51% 5.12% 8.81%
Censor after one year 1.60% 3.74% 7.63%
Competing-Risks estimation 2.94% 6.82% 12.63%
Table 13: Reform Impact on Overall Probability of Being in Receipt of Any Income Support Payment – Different Specifications
6 months after beginning of the spell
12 months after beginning of the spell
24 months after beginning of the spell
Mean Std.Err. Mean Std.Err. Mean Std.Err.
Reform’s impact on probability of receiving an IS payment
Baseline Estimation -0.019 0.010 -0.008 0.013 0.018 0.016
Exclude one month before
and after 30 June 2006 -0.018 0.011 -0.005 0.014 0.026 0.017
Exclude three month before
and after 30 June 2006 -0.021 0.012 -0.006 0.016 0.028 0.019
Exclude individuals with
non-permanent conditions -0.017 0.021 -0.020 0.026 0.076* 0.029
References
Adam S, Bozio A, Emmerson C (2010). ‘Reforming Disability Insurance in the UK: Evaluation of the Pathways to Work programme.’ Institute for Fiscal Studies, London.
Autor DH, Duggan MG (2006). ‘The growth in the Social Security disability rolls: A fiscal crisis unfolding.’ Journal of Economic Perspectives 20, 71–96.
Bound, J. (1989). The Health and Earnings of Rejected Disability Insurance Applicants. American Economic Review 79(3), 482-503.
Bound, J. and Burkhauser, R.V. (1999), ‘Economic analysis of transfer programs targeted on people with disabilities’, in O. Ashenfelter and D. Card (eds) Handbook of Labor Economics Volume 3C, 3417-3528, Elsevier North Holland.
Burkhauser, RV., Daly, MC., McVicar, D. and Wilkins R. (2014). ‘Disability benefit growth and disability reform in the US: lessons from other OECD nations.’ IZA Journal of Labor Policy 3:4.
Campolieti, M. (2004). Disability Insurance Benefits and Labor Supply: Some Additional Evidence. Journal of Labor Economics 22(4), 863-887.
Chen, S. & van der Klaauw, W. (2008). The Work Disincentive Effects of the Disability Insurance Program in the 1990s. Journal of Econometrics 142(2), 757-784.
de Jong, P., Lindeboom, M. & van der Klaauw, B. (2011). Screening Disability Insurance Applications. Journal of the European Economic Association 9(1), 106-129.
DEEWR (2008). Welfare to Work Evaluation Report. Canberra, Australia: Department for Employment, Education and Workplace Relations.
Department of Social Services (2015), A New System for Better Employment and Social Outcomes: Final Report of the Reference Group on Welfare Reform to the Minister for Social Services.
Giertz, S.H. & Kubik, J.D. (2011). The Disability Screening Process and the Labor Market Behavior of Accepted and Rejected Applicants: Evidence from the Health and Retirement Study. Journal of Labor Research 32(3), 237-253.
Gruber, J. (2000). Disability Insurance Benefits and Labor Supply. Journal of Political Economy 108(6), 1162-1183.
Karlström, A., Palmeb,M. and Svensson, I. (2008). ‘The employment effect of stricter rules for eligibility for DI: Evidence from a natural experiment in Sweden.’ Journal of Public Economics 92, 2071-2082.
Kuehnle, D. & Scutella, R. (2011), Employment retention in the economic downturn, Melbourne Institute of Applied Economic and Social Research, Melbourne
McVicar D, Wilkins R (2013). ‘Explaining the growth in the number of recipients of the Disability Support Pension in Australia.’ Australian Economic Review 46(3):345–356.
Mitra, S. (2009). Disability Screening and Labor Supply: Evidence from South Africa. American Economic Review Papers and Proceedings 99(2), 512-516.
Organization for Economic Co-operation and Development (OECD) (2010). Pathways onto (and off) Disability Benefits: Assessing the Role of Policy and Individual Circumstances, in OECD Employment Outlook 2009, OECD, Paris.
Organization for Economic Co-operation and Development (OECD) (2010). Sickness, Disability and Work: Breaking the Barriers: A Synthesis of Findings across OECD Countries. OECD, Paris.
Staubli, S. (2011). The impact of stricter criteria for disability insurance on labor force participation. Journal of Public Economics 95(9-10), 1223-1235.
von Wachter, T., Song, J. & Manchester, J. (2011). Trends in Employment and Earnings of Allowed and Rejected Applicants to the Social Security Disability Insurance Program. American Economic Review 101(7) 3308-3329.