AAMJAF, Vol. 11, No. 1, 123–143, 2015 of ACCOUNTING
andFINANCE
RANKING OF MALAYSIAN COMMERCIAL BANKS:
SUPER-EFFICIENCY DATA ENVELOPMENT ANALYSIS
(DEA) APPROACH
Rossazana Ab Rahim
Faculty of Economics and Business, Universiti Malaysia Sarawak, 94300 Kota Samarahan, Sarawak, Malaysia
E-mail: rossazana@gmail.com ABSTRACT
Banking efficiency studies have tended to focus on quantifying the efficiency of financial institutions. Few attempts have been undertaken to compare the efficiency performance of domestic and foreign banks, and even fewer have compared the super-efficiency performance of both types of banks. Addressing this gap, the present study contributes to the existing literature by utilising Data Envelopment Analysis (DEA) to compute super-efficiency scores for individual banks. The objectives of this study are to estimate technical efficiency and to estimate the super-efficiency index of Malaysian commercial banks over the period from 2000 until 2010. The results indicate that, in general, domestic banks perform better than foreign banks. However, the super-efficiency results reveal that individual foreign banks are more efficient than individual domestic banks.
Keywords: super-efficiency, foreign banks, domestic banks, Malaysian banking
INTRODUCTION
The New Economic Model unveiled by the Malaysian Prime Minister on March 30, 2010 outlined strategic reform initiatives to transform Malaysia into a high value-added and high-income economy with per capita income of at least RM45,000 (the current per capita income is approximately RM21,000). In line with this target, a new trajectory for transformation and growth is envisioned for the Malaysian financial system. The 10th Malaysian Plan stated the urgency of creating a conducive environment to unleash economic growth by emphasising 12 sectors of National Key Economic Areas (NKEAS). The financial sector is one of the key NKEAs to be exploited. During the tenure of the first Financial Sector Masterplan (2000–2010), the financial sector expanded by an annual growth of 7.3% and it has contributed to the further diversification of the
Malaysian financial system and its competitiveness (Bank Negara Malaysia, 2012). Throughout this period, the financial landscape experienced better institutional capacity building, improved financial infrastructure development, regulatory reforms, greater usage of technology and efficient delivery channels. In the recent move, Bank Negara Malaysia has expressed that the next phase of transformation will involve a financial ecosystem that heightens the competitiveness and vigour of the financial sector. Under the Financial Sector Blueprint (2011–2020), Bank Negara Malaysia envisages the banking sector growing to three times the gross domestic product (GDP) by 2020, while the financial sector contribution to GDP is projected to be between 10% and 12% (Bank Negara Malaysia, 2012). Based on the above discussion, it seems pertinent to assess the efficiency performance of financial institutions.
The Malaysian banking system includes financial institutions, non-banking financial intermediaries and financial markets. The non-banking industry can be further classified into commercial banks, merchant banks, finance companies, discount houses, foreign bank representative offices and offshore banks. The largest group, commercial banks, are the main players in the Malaysian banking industry. These banks engage in a full range of banking services. According to Santos (2000), commercial banks play the role of provider of liquidity, insurance, and monitoring services and producer of information. Since October 1998, the Banking and Financial Institutions Act 1998 (BAFIA) has served as the framework for the supervision of the Malaysian banking system. Malaysian commercial banks raise funds by collecting checkable deposits, saving deposits and time deposits from two groups—businesses and individuals. These banks also provide loans to both groups (Bank Negara Malaysia, 1999).
In April 2009, the financial services sector experienced liberalisation; foreign banks were allowed to own up to 70% of the equity (previously 49%) in investment banks, Islamic banks, insurance companies and takaful operators. As part of the liberalisation package, the Malaysian government also announced that seven new licenses would be issued to foreign banks with the issuance of five new licensees to conventional foreign banks with a paid-up capital of RM300 million, while two new licenses would be given to mega Islamic banks with a paid-up capital of RM3.27 billion. In June 2010, five new licenses were given to BNP Paribas SA (France); Mizuho Corporate Bank (Japan); National Bank of Abu Dhabi (United Arab of Emirates); PT Bank Mandiri (Indonesia); and Sumitomo Mitsui Banking Corporation (Japan). In this vein, the banking sector received a greater inflow of foreign investment into the sector and the number of foreign banks surpasses the number of domestic banks in the Malaysian banking market. The presence of more foreign banks in the market will enhance banking competition, add to the diversity of the financial services industry, and facilitate the transformation of the Malaysian economy into a developed high-income
economy by 2020. Whether domestic banks are ready to compete with foreign banks is an open question. In this respect, the present study attempts to provide a comprehensive ranking of Malaysian domestic and foreign commercial banks. This ranking was possible through utilising two models of Data Envelopment Analysis (DEA): constant returns to scale (CRS) models and the Andersen and Petersen's super-efficiency model.
Firms have persistently adapted and adjusted according to changes in the social and economic environment with the ultimate goal of improving their productive efficiencies (Harker & Zenios, 1999). Information obtained from this study is very useful for (a) informing government policy with respect to the effects of deregulation, mergers or market structure on efficiency; (b) addressing research issues on the efficiency of an industry, the ranks, or the methods employed, and (c) improving managerial performance by identifying "best practices" and "worst practices" (Berger & Humphrey, 1997). On a conceptual level, studies on banking efficiency fall into three categories: event studies, operating performance studies and frontier analysis studies. Given the criticism of event studies and financial ratio approaches, the frontier approach has begun to appeal to researchers (Weill, 2004; Bos & Kool, 2006; Bader, Mohamad, Ariff, & Hassan, 2008). This approach has several advantages over the accounting ratios, such as the ability to: (a) accommodate both multiple inputs and outputs; (b) to distinguish the estimation of x-efficiency from scale and scope efficiencies, and; (c) to differentiate the improvements in efficiency and market power effects (Iqbal & Molyneux, 2005). Further advantages of the frontier approach include its ability to provide a single aggregate measure efficiency score for each bank and the ability to incorporate the effects of external factors on bank performance. Thus, this study employs the frontier approach to measure efficiency in the Malaysian banking sector.
Despite the fact that there are a number of studies quantifying the efficiency of financial institutions, there have been few attempts to compare the efficiency of foreign banks and domestic banks, particularly in the context of the Malaysian banking sector. There appear to be limited studies focusing on measuring and comparing the efficiency performance of foreign and domestic banks in Malaysia. Past efficiency studies have largely focused on quantifying the efficiency of financial institutions (Dogan & Fausten, 2003; Omar, Abdul-Rahman, Mohd. Yusof, Abd. Majid, & Mohd. Rasid, 2006; Sufian, 2006; 2007 Ahmad-Mokhtar, Abdullah, & M-Alhabshi, 2008; Ismail & Abdul-Rahim, 2009; Yeoh & Hooy, 2011; Ab-Rahim, Md-Nor, & Ramlee, 2012; amongst all), few attempts have been undertaken to compare the performance of domestic and foreign banks in the Malaysian banking system (Detragiache & Gupta, 2004; Matthews & Ismail, 2006; Sufian & Abdul-Majid, 2008; Mohd-Tahir, Abu-Bakar,
& Haron, 2010; and Ong, Lim, & Teh, 2011). There have been no studies undertaken that rank individual banks in Malaysia.
Thus, the present study offers insight into banking performance by constructing efficiency indexes of individual banks in Malaysia. Additionally, this study departs from preceding studies by establishing a comprehensive ranking of individual banks in Malaysia. This approach is accomplished by devising a super-efficiency index of banks in Malaysia. There is some concern that previous studies had neglected the importance of constructing a super-efficiency index of individual banks. Theoretically, banks that are located at the frontier of the production function are efficient. Methodologically, the computation of efficiency is made possible by taking the percentage of utilisation of inputs over outputs produced. Thus, this research contributes to the efficiency literature by devising a super-efficiency index of all efficient banks with respect to technical efficiency indexes of foreign and domestic banks by employing a non-parametric method over the period from 2000 until 2011. This paper is structured as follows: the next section presents the review of previous studies on banking efficiency in Malaysia, and the subsequent section provides data and methodology. Finally, the empirical results are presented in the results and discussion section, while the final section concludes the paper.
PREVIOUS STUDIES
There has been considerable research on banking efficiency. However, there is a scarcity of efficiency and productivity studies based on developing countries. A review of 130 studies across 21 countries by Berger and Humphrey (1997) covers only 5% of the banking sectors in the developing economies. Approximately 75% of the banking efficiency literature focuses on the banking markets in developed countries, particularly the United States of America (US) banking market. Berger, Hunter and Timme (1993) state that more research needs to be undertaken to measure and compare the efficiency levels of individual banks. Molyneux, Altunbaş and Gardener (1996, p. 273) offer support in stating that "a great deal more work is needed on x-efficiency research in banking." Fukuyama (1993; 1995) is one of the early researchers in Asia to investigate banking efficiency. Despite the pivotal role of the Malaysian banking industry in the economy, the study of banking efficiency is still in its infancy.
Katib and Matthews (2000) employ the DEA method to investigate the characteristics of the management structure and technical efficiency of 20 Malaysian commercial banks between 1989 and 1995. On average, the results show that the technical efficiency scores of Malaysian banks ranged from 68% to 80%. The authors contend that most commercial banks are inefficient, with the
main source of technical inefficiency due to scale inefficiency. The findings that scale inefficiency dominates pure technical inefficiency also occur in Malaysian non-commercial banks (Sufian, 2007). Sufian adds the merchant banks are more efficient than its finance companies counterpart. Okuda and Hashimoto (2004) employed an adjusted parametric approach to non-performing loans in estimating Malaysian bank cost efficiency for the period from 1991 until 1997. The authors confirm Katib and Matthews (2000) find that financial liberalisation is accompanied by an increase in banks' operational costs over time and negative technological progress. Both studies assert that small and medium-sized banks are more cost efficient than large banks. Thus, scale inefficiency attributed to large banks implies that the banks are too large to operate efficiently.
Employing Malmquist productivity indexes, Sufian (2004) states that small banks in Malaysia are too small to reap the benefits of economies of scale, while the large banks are too large to be scale efficient. The results further suggest that the Malaysian banking industry has exhibited a productivity regression of 6.3% and this is mainly attributed to technological (6.1%) rather than technical efficiency (0.2%) regression. Moreover, Sufian and Abdul-Majid (2006) state that large banking groups are on average more x-efficient, whereas smaller banking groups were found to be more price efficient. Consistent with the mixed findings reported in the aforementioned studies, Dogan and Fausten (2003) suggest that regulatory reform and liberalisation are not sufficient conditions for productivity improvement. Omar et al. (2006) investigate the productivity of 11 commercial banks over the period from 2000 to 2004. The findings show the productivity growth of domestic Malaysian banks is attributed to technological change rather than technical efficiency change. The results imply that Malaysian banks should adopt higher technology in banking as well as better technological knowledge. Also employing the Malmquist indexes, a study by Fadzlan Sufian and Suraya Ibrahim (Sufian, & Ibrahim, 2005) find that the inclusion of off-balance sheet items has resulted in an increase in the estimated productivity levels of all banks during the period from 2001 until 2003.
Existing studies that compare the efficiency performance of Malaysian domestic and foreign banks are Detragiache and Gupta (2004), Matthews and Ismail (2006), Mohd-Tahir et al. (2010), and Ong et al. (2011). In line with other Malaysian studies, these studies utilised the non-parametric frontier approach or DEA to measure the banking efficiency of Malaysian banks. Detragiache and Gupta (2004) test whether there are significant differences in performance across groups of foreign banks (foreign Asian-oriented banks and non-Asian-oriented foreign banks) and the performance of domestic banks in the Malaysia banking sector over the period from 1996 until 2001. The results show that there are significant differences between Asian and non-Asian-oriented banks; foreign banks not specialised in Asia perform better than Asian-oriented foreign banks.
The authors add that foreign banks appear to perform better than domestic banks during the financial crisis in terms of capitalisation, profitability, interest margin and worse in terms of overhead expenses.
Matthews and Ismail (2006) examine technical efficiency and productivity with respect to domestic and foreign commercial banks in Malaysia between 1994 and 2000. The results show that the main source of productivity growth is technical change and foreign banks are more efficient than domestic banks in this respect. The contention that foreign banks are more efficient than domestic banks is also supported in the Ong et al. (2011) study. The authors utilise DEA to measure the efficiency scores of banks in Malaysia over the period from 2002 until 2009. The findings of the study indicate that foreign banks are more efficient than domestic banks in respect to automated teller machine (ATM) utilisation and profit generation. The study adds that capital strength, loan quality, expenses and asset size are the significant determinants of pure technical efficiency of Malaysian banks. Mohd-Tahir et al. (2010) examine the efficiency performance of domestic and foreign banks in Malaysia for the period of from 2000 until 2006 by employing two methods: accounting-based ratio and stochastic frontier analysis. The results of the accounting ratio method demonstrate that the interest margin and profit ratios are higher in the case of foreign banks. The results also suggest that the domestic banks are less profit efficient compared to the foreign banks. Nevertheless, with respect to cost efficiency, the domestic banks perform better than the foreign banks.
Based on the discussion of previous studies, all aforementioned studies do not explicitly rank the performance of commercial banks in the national banking industry. The majority of the studies has either estimated the efficiency and productivity growth measures from a cost-minimising framework or has used a non-parametric technique designed to obtain results on the technical inefficiency of inputs. Therefore, this study offers insight into banking performance by constructing a comprehensive ranking for Malaysian commercial banks.
DATAANDMETHODOLOGY
The main non-parametric method, DEA, was introduced by Charnes, Cooper and Rhoades (1978) and is an analytical tool used to measure relative efficiency of firms throughout the process of transforming inputs into outputs. Since its initial inception in 1978, DEA has evolved into more complex applications. This methodology is a non-parametric method as it requires no assumption on the functional form of the efficient frontier, thereby making it a powerful tool in modelling complex and multi-faceted applications. The fundamental decision to
measure types of efficiency depends on the questions being addressed, which are based on economic optimisation in reaction to market prices and competition (Berger & Mester, 1997). Technical efficiency measures of how well a firm is able to minimise its inputs to produce a given set of outputs or to obtain maximal outputs from a given set of inputs.
The main advantage of DEA is that it does not require a priori assumptions about the analytical form of the production function and it places less emphasis on the frontier (Serrano-Cinca, Molinero, & Garcia, 2006). DEA aims to identify the firms that determine an envelopment surface against other firms that are not located on the frontier. An efficiency index of one or any firm that lie on the surface is considered to be efficient and is identified as the best practice unit relative to other units. Efficiency scores in DEA are relative, not absolute measures because the score depends heavily on the performance of other firms in the sample.
Input and Output Variables
This study includes nearly 80% of Malaysian commercial banks, both domestic and foreign banks and it covers the period from 2000 until 2011. The domestic banks consist of Affin Bank (AFF), Alliance Bank (ALL), AmBank (AM), CIMB Bank (CIMB), Eon Bank (EON), Hong Leong Bank (HL), Maybank (MAY), Public Bank (PUB) and RHB Bank (RHB). The foreign banks covered are Bangkok Bank (BANG), Bank of America Malaysia (AMER), Bank of China Malaysia (CHIN), Bank of Tokyo-Mitsubishi UFJ Malaysia (TOKYO), Citibank (CITI), Deustche Bank Malaysia (DEUS), HSBC Bank Malaysia (HSBC), JP Morgan Chase Bank (MORG), OCBC Bank Malaysia (OCBC), Standard Chartered Bank Malaysia (SC), The Bank of Nova Scotia (NOVA), The Royal Bank of Scotland (ROY) and United Overseas Bank (UOB). The foreign banks not covered are BNP Paribas Malaysia, India International Bank Malaysia, Industrial and Commercial Bank of China, Mizuho Corporate Bank Malaysia, National Bank of Abu Dhabi, Sumitomo Mitsui Banking Corporation Malaysia because most of the banks were established in 2010. The bank level data used are taken from BankScope (2000) spreadsheets published by Bureau Van Dijk (BVD), supplemented with the published balance sheet and income statement information in annual reports of individual banks. All financial variables reported are in nominal values (Ringgit Malaysia) to facilitate comparison over time; all of the variables are deflated by the consumer price index (CPI) to obtain real values in a 2000 price constant. To measure efficiency via the DEA method, the DEA Excel Solver software (Available at http://www.deafrontier.net/ software.html) by Zhu (2003) is used.
The definition and measurement of inputs and outputs in the banking function remains a contentious issue among researchers. In the banking theory literature, there are two main approaches: the production and intermediation approaches (Sealey & Lindley, 1977). Under the production approach, a financial institution is defined as a producer of services for account holders, that is, they perform transactions on deposit accounts and process documents such as loans. The intermediation approach assumes that financial firms act as an intermediary between savers and borrowers and posits total loans and securities as outputs, whereas deposits together with labour and physical capital are defined as inputs. This study employs the intermediation approach in choosing the variables. Based on the list of inputs and outputs in the preceding studies as well as data availability; the input variables used are personnel expenses, capital that is the book value of the premises and fixed assets, deposits and short term funding (hereafter denoted as deposits), whereas the output variables are represented by total loans, total securities and off-balance sheet items.
DEA Envelopment Model
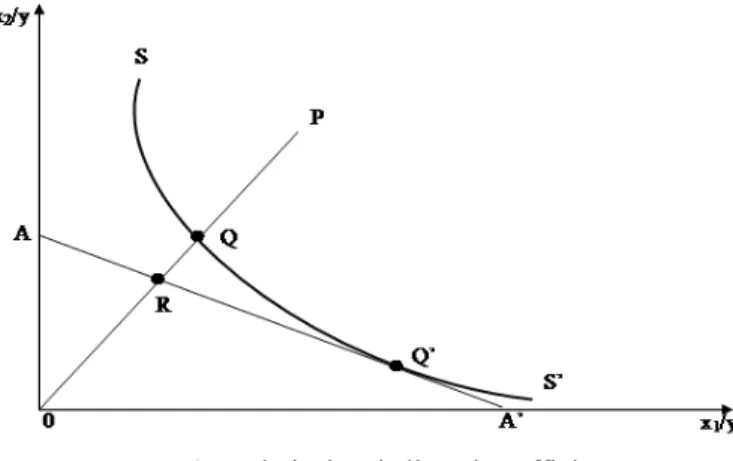
Farrell (1957) was the first to decompose efficiency into two components— technical efficiency and allocative efficiency. Technical efficiency refers to the ability of a firm to maximise output from a given set of inputs, while allocative efficiency reflects the ability of a firm to use the inputs in optimal proportions, given respective prices. Figure 1 illustrates Farrell's concept for the single output/two input case, where the unit isoquant (SS') shows the various combinations of the two inputs (x1 and x2), which can be used to produce one unit
of the single output (y).
Figure 1. Technical and allocative efficiency
Based on Figure 1, the firm at point Q is productively efficient in choosing the cost minimising production process, given relative input prices (represented by
the slope of AA’). The technical inefficiency of a firm at point P is represented by the distance QP, which indicates the amount of all inputs that can be reduced proportionally without reducing outputs. The ratio OQ/OP measures the technical efficiency of the production at point P, whereas, OQ/OR compares the minimum input required for production of one unit to the observed input usage in the firms. Thus, 1 – OQ/OR measures the proportion of inputs that could be reduced without reducing output. Hence, technical efficiency = OQ/OP. The ratio takes a value between zero and one, where the value of 1 indicates that the firm is fully technically efficient. In this scenario, point Q is technically efficient as it lies on the efficient frontier. This study employs DEA to measure efficiency of individual banks in the Malaysian banking industry. It is worth mentioning that the main advantage of DEA is that it does not require an a priori assumption about the analytical form of the production function; thus, the misspecification effect of the production technology is null. Having access to a panel of data incorporating both cross-sectional and time series data, two approaches are adopted to analyse efficiency over time, namely a CRS model and a super-efficiency model.
Both Debreu (1951) and Farrell (1957) introduce the basic framework for analysing and measuring technical inefficiency, which is defined as the deviations of actual from "optimum behaviour". The conventional Farrell-Debreu measure of production performance as described below is adopted from Simar and Wilson (2000). Considering a production technology of n firms, the term "decision-making unit" (DMU) is used instead of "firm". The DMUs produce q
outputs from p inputs. Let xi ∈ℜ+p and yi ∈ℜ+q denoting the input and output
vectors, respectively, for the ith DMU, where i = 1, 2,…, n, the production possibility set given by the closed set as follows:
{( ) + | can produce }
= ∈ℜp+q
T x,y x y (1)
The production possibility set T is referred to as the technology or production frontier of DMUs, which transforms inputs into outputs. With respect to the ith DMU, the input vector used is xi =(x x1i 2i, ,..., )xpi T∈ℜ+p to produce output vector
, ,
( ..., ) +
= T∈ℜq
i 1i 2i qi
y y y y , where p, q and T denote the number of inputs, the number of outputs and vector transpose, respectively. The production technology can be modelled by an input correspondence as follows:
( ) :{ ( , )∈ }, ∈ℜ+q
For any y∈ℜ+q, the input set V(y) denotes the input vectors x∈ℜ+p that yield at
least output y. The input-oriented distance function is defined by:
1 ( , ) sup{ := θ , ∈ ( )} (inf{ : ( , )= θ θ ∈ ( )})− θ i i i x i i i i i D x y y V y x y V y (3)
The input-oriented distance function is reciprocal to the Farrell general framework of technical efficiency; technical efficiency TE (xi, yi) defined as TE
(xi, yi) = 1 / D(xi, yi) is estimated separately for each DMU via the linear
programming problem as follows:
1 ( ( , ))− = ( , ) i i i i D x y TE x y (4) minθ,λ θ, s.t. –yi + Yλ≥ 0, θ xi – Xλ≥ 0, λ≥0,
where X is a K × I input matrix and Y is an N × I output matrix for all sample firms; xi is a K ×1 input vector and yi is an N × I output vector of firm i; whilst
λi is an I × 1 intensity vector and I is the number of DMUs in the observation set
(i = 1, 2, …, I). The value of θ is the efficiency score for the ith DMU and it should be solved n times. This framework is based on the assumption of constant returns to scale and yields the technical efficiency scores.
Super-efficiency DEA Model
It is important to note that the efficiency scores for all efficient DMUs are equal to 1 in the CRS and VRS models. Thus, the ranking of efficient DMUS is impossible. Andersen and Petersen (1993) introduced the super-efficiency DEA model. This model estimates efficiency scores by eliminating the data on the efficient DMU from the reference set, which results in super-efficient scores of the fully efficient DMU. Therefore, the score for efficient DMU can, in principle, take any value greater than or equal to 1. Next, these scores are used to rank the efficient DMUs and thereby eliminate some (but not all) of the ties that occur for efficient DMUs. Nevertheless, the inefficient units that are not on the efficient frontier are unaffected. Andersen and Petersen's model for estimating super-efficiency score for the DMU under CRS model is outlined as follows:
minθ,λ θsuper, s.t.
∑
n = super j i λj ijx φx =∑
n j i λj rjy Yro λj≥ 0, (5)where θsuper is the super-efficiency score for the efficient DMU.
RESULTS AND DISCUSSION
In this section, the empirical results from the input-oriented CCR model and super-efficiency model are presented and discussed. This study employs an input-oriented model as it is believed that commercial banks should dwell well on the sources of input waste (Isik & Hasan, 2003). Notably, input-oriented efficiency measures address the question: "By how much can output quantities be proportionally expanded without altering the input quantities used?" (Coelli, Rao, & Battese, 2000). Table 1 presents the technical efficiency scores of 22 Malaysian commercial banks (9 domestic banks and 13 foreign banks) over the period from 2000 until 2011. The efficiency scores refer to the proportion of resources that a bank should utilise to achieve its desired level of outputs.
It is interesting to highlight that in 2000, the performance of foreign banks was more than double of domestic banks' production. This situation could be due to the immediate effect of the announcement of bank merger policy in July 1999 that affects all domestic banks, while foreign banks were left untouched. There was dissatisfaction with the merger program because of the selection of anchor banks, the timeframe for completion of the mergers, asset valuation as well as the fate of small and medium-sized banks (Shameen, 1999; Philip, 2000; Ariff & Yap, 2001). As Table 1 clearly shows on average domestic banks perform better than foreign banks; Figures 1 and 2 highlight the contention that if a comparison is made bank by bank, the results show contradictory findings.
Table 1 shows the technical efficiency scores of 22 Malaysian commercial. The results indicate that the Malaysian banking industry has been characterised by large asymmetry among banks with their average efficiency scores range between 23% and 140% (super-efficient) over the period from 2000 until 2011. The highest efficiency scores (140%) were recorded in 2000 while the, lowest scores (53%) were recorded in 2008. The results further show that domestic banks perform technically better than foreign banks by 9% to 38% from
2001 until 2011. The largest performance gap between both types of banks was recorded in 2002; whereby the technical efficiency performance of domestic banks was at 88%, while inefficiency scores for foreign banks were relatively high at 45%. In other words, on average, foreign banks waste approximately 45% of their inputs to produce desired outputs. These inefficiencies could also be due the constraints faced by foreign banks such as in opening new branches as well as offering diversification in products.
Table 1
Technical efficiency of Malaysian commercial banks
The results of this study, that foreign banks are less efficient than domestic banks, are in accordance to the findings of existing studies such as Kraft, Hofler and Payne (2006), and Havrylchyk (2006). For instance, Havrylchyk (2006) finds that foreign banks in the Polish banking industry have
not improved their efficiency during the period from 1997 until 2001. Nevertheless, the findings of this study contradict the results of the previous studies on Malaysian banks. Matthews and Ismail (2006) and Ong et al. (2011) support the contention that foreign banks are more efficient than domestic banks. The difference in the outcome could be due to differences in the selection of the sample. While the latter and the former cover the period from 1994 until 2000 and from 2002 until 2009, this study covers the period from 2000 until 2011. Nevertheless, when a comparison between bank and bank is made, this study tends to offer support to the contention that foreign banks are more efficient than domestic banks.
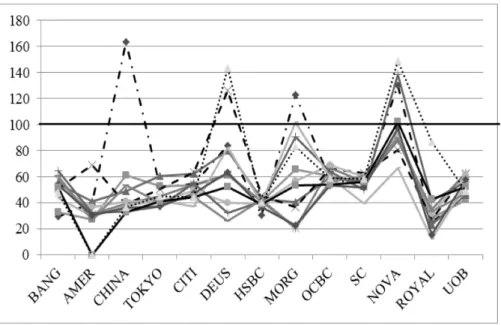
Figures 2 and 3 are intended to show that, the number of foreign banks located on the efficient frontier is more than its counterpart. Based on the results in Table 1, it shows that there are only two fully efficient domestic banks, namely Alliance bank performed super-efficiently in 2011, while super-efficiency performance for AMBank was recorded from 2000 until 2003. With respect to foreign banks, the results show that the super-efficiency performance of banks was recorded for the case of China bank (year 2000); Deustche bank (2003 and 2011); The JP Morgan Chase bank (2000 and 2007); and Nova Scotia bank (2000, 2006, 2010 and 2011).
Figure 3. Technical efficiency of Malaysian foreign banks
With this respect, the super-efficiency performance has enabled for the construction of rankings for commercial banks in Malaysia as presented in Table 2. The results as presented in Table 2 show the inconsistent trend of bank ranking. For instance, China bank is ranked as the top performer in 2000. However, after a decade, the same bank is ranked number 21 in 2011. Deustche bank is ranked number 1 in 2003, drops to rank 11, 19 and 22 in the subsequent years; however, in 2007 the bank climbs up to rank 2. Again, the bank falls to rank 21 in 2008 and jumps to rank 2 in year 2011. Next, Table 3 provides insight of the ranking of banks in comparison of bank performance between 2000 and 2011.
Table 3 presents the technical efficiency scores of Malaysian commercial banks for two selected years, 2000 and 2011. The table also shows the technical inefficiency scores as well as the ranking of 9 domestic banks and 13 foreign banks. The top two performers for 2011 consist of foreign banks, namely Nova Scotia bank and Deustche bank. These banks are followed by two domestic banks, Alliance bank and AMBank at the third and fourth rank. The results in Table 3 are further classified into separate categories to group the inefficient banks based on cut-off points in Table 4. In Table 4, Category I consists of banks that perform less than 50% of efficiency scores, while Category II, Category III and Category IV refer to banks that perform less than or equal to 65%, 75% and 85%, respectively. The only bank that shows consistent and super-efficient performance from 2000 until 2011 is Nova Scotia bank. On the contrary, the least
efficient performers that fall into Category I from 2000 until 2011 are Bangkok bank, Tokyo-Mitsubishi bank, Citibank, HSBC bank, OCBC bank, Standard Chartered bank and UOB bank. Ironically, foreign banks dominate both opposite categories, Category I and Category IV as well as the super-efficient category. Table 2
Table 3
Ranking of Malaysian commercial banks for year 2000 and 2011
Bank Standard Technical
Efficiency Super-technical efficiency Standard Technical Inefficiency Rank
2000 2011 2000 2011 2000 2011 2000 2011 NOV 100.00 100.00 0.00 149.17 130.25 0.00 3 1 DEUS 83.71 100.00 16.29 143.67 83.71 0.00 5 2 ALL 77.25 100.00 22.75 112.1 77.25 0.00 6 3 AM 100.00 93.58 0.00 93.58 176.7 6.42 1 4 ROY 24.82 86.52 75.18 86.52 24.82 13.48 22 5 EON 76.34 83.73 23.66 83.73 76.34 16.27 7 6 JP 100.00 82.67 0.00 82.67 122.7 17.33 4 7 PUB 52.42 76.96 47.58 76.96 52.42 23.04 16 8 HL 61.16 73.44 38.84 73.44 61.16 26.56 12 9 AFF 72.42 68.55 27.58 68.55 72.42 31.45 8 10 CIMB 70.97 64.37 29.03 64.37 70.97 35.63 10 11 RHB 72.02 64.15 27.98 64.15 72.02 35.85 9 12 OCBC 57.32 59.05 42.68 59.05 57.32 40.95 13 13 MAY 64.78 58.93 35.22 58.93 64.78 41.07 11 14 SC 55.38 58.25 44.62 58.25 55.38 41.75 14 15 UOB 45.25 49.06 54.75 49.06 45.25 50.94 18 16 BANG 29.67 47.83 70.33 47.83 29.67 52.17 21 17 TOKYO 52.36 44.92 47.64 44.92 52.36 55.08 17 18 CITI 54.23 44.58 45.77 44.58 54.23 55.42 15 19 HSBC 30.41 40.68 69.59 40.68 30.41 59.32 20 20 CHIN 100.00 36.55 0.00 36.55 163.58 63.45 2 21
AMER 39.97 n.a. 60.03 n.a. 39.97 n.a. 19 n.a.
Table 4
Classification of Malaysian commercial banks
Category I
(≤ 0.5) Category II (≤ 0.65) Category III (≤ 0.75) Category IV (≤ 0.85) Super-Efficient Banks
2000 2011 2000 2011 2000 2011 2000 2011 2000 2011
PUB MAY HL AFF AFF HL DEUS AM AM ALL
BANG BANG MAY RHB ALL PUB EON CHINA DEUS
AMER CHINA CIMB MORG NOVA NOVA
TOKYO TOKYO EON ROYAL MORG
CITI CITI RHB HSBC HSBC OCBC OCBC SC SC UOB UOB ROYAL
CONCLUSION
Generally, the results show a declining trend in mean technical efficiency, which implies greater heterogeneity in performance across all banks for the period from 2002 until 2004 and 2006 until 2008. Banks improved their efficiency levels over the period from 2008 until 2011. The same pattern applies to the case of domestic and foreign banks; the results indicate that domestic and foreign banks are operating in a similar banking environment. The study also reveals that on average, the foreign banks are less technically efficient than the domestic banks. However, this results should be interpreted with caution because if a comparison is made bank by bank; the results show otherwise. In other words, it can be concluded that if a simple average is used, domestic banks are more efficient than foreign banks. However, if the classification of the least and the most efficient banks is taken into consideration, the group of efficient banks consist of more foreign banks than domestic banks. The ranking of banks also shows that the top performers are dominated by foreign banks. Hence, with the recent announcement and enforcement of the liberalisation in the financial sectors, domestic banks should strive to compete not only on national market; they should also be prepared to enter the global banking markets.
The results of this study have considerable policy relevance. The move to liberalise the financial system whereby foreign banks are allowed a higher percentage of equity at 70% in financial institutions has resulted in more foreign banks entering the Malaysian banking market. The presence of more foreign banks in the market will likely enhance banking competition, add to the diversity of the financial services industry and facilitate the transformation of Malaysian economy. The results of this study suggest that on average, domestic banks perform better than foreign banks. Nevertheless, the results need to be interpreted with caution as the insight findings reveal that more foreign banks are located in the most efficient group relatively to the domestic banks that are located in the least efficient group. In this vein, the management of domestic banks and the authorities should continue efforts to optimise the utilisation of resources available.
It is noteworthy that this study covers the period of the Financial Sector Master Plan (2000–2010); thus, the results could add evidence of the successful of the master plan. During the first five years of the plan, the results seem to indicate that on average the efficiency performance of Malaysian banks is declining. The performance of banks improves in the second phase of the master plan (2005–2010). The recent master plan, namely the Financial Sector Blueprint (2011–2020) is envisioned to advance financial sector development to contribute to Malaysia’s transition to a high value added and a high income economy with financial stability. Thus, the performance of the Malaysian banking sector seems
pertinent towards achieving high economic growth. Policies should be addressed to enhance the banking sector to be more competitive and diversified with the ability to perform on an efficient global frontier. In other words, the domestic banks should strive to compete with foreign bank counterparts not only in the Malaysian banking sector, they should also be able to penetrate the foreign banking markets and compete with the foreign banks on the international frontier.
Due to its limitation, this study offers a fruitful avenue for future research to embark on the area of banking efficiency in the Malaysian banking sector. First, the scope of this study can be extended to assess the technical efficiency performance of domestic and foreign banks with respect to pure technical efficiency and scale efficiency. The decompositions of technical efficiency offer insight on what caused the relatively poor performance of Malaysian commercial banks. A high pure technical inefficiency score indicates the mismanagement of the bank managers and the inability of banks to adopt advance and modern technologies to improve their performance. Second, this study can also be extended to incorporate the determinants of banking and environmental variables on the efficiency performance of banks. The banking variables should consist of variables such as market risk, loan risk and size, while the environmental variables contain bank ownership, regulatory, macroeconomic growth, population density and others.Finally, the present study can be extended in investigating the changes of productivity of banks over time with the change in technology by employing advanced methods in DEA approaches, namely the Malmquist productivity index. The new technologies are expected to reduce costs and allow banks to diversify their products and services. These changes will contribute to the increased competition and productivity of commercial banks. ACKNOWLEDGEMENT
Financial support from Philippine Institute for Development Studies (PIDS) through East Asia Development Network (EADN) Individual Research Grant Project 2012 is gratefully acknowledged. All remaining flaws are the responsibilities of the authors.
REFERENCES
Ab-Rahim, R., Md-Nor, N. G., & Ramlee, S. (2012). The cost efficiency effects of involuntary bank mergers: Empirical evidence from Malaysia. Thammasat Economic Journal, 30(1),129–160.
Ahmad-Mokhtar, H. S., Abdullah, N., & M-Alhabshi, S. (2008). Efficiency and competition of Islamic banking in Malaysia. Humanomics, 24(1), 28–48.
Andersen, P., & Petersen, N. C. (1993). A procedure in ranking of efficient units in Data Envelopment Analysis. Management Science, 39(10), 1261–1264.
Ariff, M., & Yap, M. M. (2001). Financial crisis in Malaysia. In T. Yu, & D. Xu (Eds.),
From crisis to recovery: East Asia rising again? (pp. 305–346). Singapore: World Scientific.
Bader, M. K. I., Mohamad, S., Ariff, M., & Hassan, T. (2008). Cost, revenue and profit efficiency of Islamic versus conventional banks: International evidence using data envelopment analysis. Islamic Economic Studies, 15(2), 23–76.
Bank Negara Malaysia. (1999). The central bank and the financial system in Malaysia: A decade of change. Kuala Lumpur: Bank Negara Malaysia.
Bank Negara Malaysia. (2012). Financial sector blueprint 2011–2020. Kuala Lumpur: Bank Negara Malaysia.
BankScope. (2000). Banking database. New York: Bureau Van Dijk IBCA.
Batchelor, V., Kuppusamy, K., & Allen, D. E. (2005). The technological progress of Malaysian banks: An empirical investigation. School of Accounting, Finance and Economics and FIMARC Working Paper Series WP 0502, Edith Cowan University.
Berger, A. N., & Humphrey, D. B. (1997). Efficiency of financial institutions: International survey and directions for future research. European Journal of Operational Research, 98, 175–212.
Berger, A. N., & Mester, L. J. (1997). Inside the black box: What explains differences in the efficiencies of financial institutions. Journal of Banking and Finance, 21,
895–947.
Berger, A. N., Hunter, W. C., & Timme, S. G. (1993). The efficiency of financial institutions: A review and preview of research past, present and future. Journal of Banking and Finance, 17, 221–249.
Bos, J. W. B., & Kool, C. J. M. (2006). Bank efficiency: The role of bank strategy and local market conditions. Journal of Banking and Finance, 30, 1953–1974. Charnes, A. Cooper, W. W., & Rhoades, E. (1978). Measuring the efficiency of decision
making units. European Journal of Operational Research, 2, 429–444.
Coelli, T., Rao, D. S. P., & Battese, G. E. (2000). An introduction to efficiency and productivity analysis. Boston: Kluwer Academic Publishers.
Debreu, G. (1951). The coefficient of resource utilization. Econometrica, 19, 273–292. Detragiache, E., & Gupta, P. (2004). Foreign banks in emerging market crises: Evidence
from Malaysia. IMF Working Paper WP/04/129, International Monetary Fund. Dogan, E., & Fausten, D. K. (2003). Productivity and technical change in Malaysian
banking: 1989–1998. Asia Pacific Financial Markets, 10, 205–237.
Farrell, M. J. (1957). The measurement of productive efficiency. Journal of Royal Statistical Society, 120 (section A), 253–281.
Fukuyama, H. (1993). Technical and scale efficiency of Japanese commercial banks: A non-parametric approach. Applied Economics, 25, 110–112.
Fukuyama, H. (1995). Measuring efficiency and productivity growth in Japanese banking: A non-parametric approach. Applied Financial Economics, 5(2), 95–107. Harker, P. T., & Zenios, S. A. (1999). Performance of financial institutions. Management
Science, 45(9), 1–2.
Havrylchyk, O. (2006). Efficiency of the Polish banking industry: Foreign versus domestic banks. Journal of Banking and Finance, 30, 1975–1996.
Isik, I. & Hasan, M. K. (2003). Efficiency, ownership and market structure, corporate control and governance in the Turkish banking industry. Journal of Business Finance and Accounting, 30(9&10), 1363–1421.
Ismail, M., & Abdul-Rahim, H. (2009). Impact of merger on efficiency and productivity in Malaysian commercial banks. International Journal of Economics and Finance, 1(2), 225–231.
Iqbal, M., & Molyneux, P. (2005). Thirty years of Islamic banking: History, performance and prospects. New York: Palgrave Macmillan.
Katib, M. N. (1999). Technical efficiency of commercial banks in Malaysia. Banker's Journal Malaysia, September, 40–53.
Katib, M. N., & Matthews, K. (2000). A non-parametric approach to efficiency measurement in the Malaysian banking sector. The Singapore Economic Review, 44(2), 89–114.
Kraft, E., Hofler, R., & Payne, J. (2006). Privatization, foreign bank entry and bank efficiency in Croatia: A Fourier-flexible function stochastic cost frontier analysis. Applied Economics, 38, 2075–2088.
Krishnasamy, G., Ridzwan, A. H., & Perumal, V. (2003). Malaysian post-merger banks' productivity: Application of Malmquist productivity index. Managerial Finance, 30(4), 63–74.
Matthews, K., & Ismail, M. (2006). Efficiency and productivity growth of domestic and foreign commercial banks in Malaysia (Working Paper No. E2006), Cardiff Business School.
Mohd-Tahir, I., Abu-Bakar, N. M., & Haron, S. (2010). Cost and profit efficiency of the Malaysian commercial banks: A comparison between domestic and foreign banks. International Journal of Economics and Finance, 2(1), 186–197.
Molyneux, P., Altunbaş, Y., & Gardener, E. P. M. (1996). Efficiency in European banking. New York: Wiley Publisher.
Okuda, H., & Hashimoto, H. (2004). Estimation cost functions of Malaysian commercial banks: The differential effects of size, location and ownership. Asian Economic Journal, 18(3), 233–259.
Omar, M. A., Abdul-Rahman, A. R., Mohd. Yusof, R., Abd. Majid, M. S., & Mohd. Rasid, M. E. S. (2006). Efficiency of commercial banks in Malaysia. Asian Academy of Management Journal of Accounting and Finance, 2(2), 19–42. Ong, T. S., Lim, Y. T., & Teh, B. H. (2011). A comparison on efficiency of domestic and
foreign banks in Malaysia: A DEA approach. Business Management Dynamics, 1(4), 33–49.
Philip, C. J. (2000). Malaysia's bank mergers hit potholes. Asia-Pacific Editorial Consultants, 26 July.
Santos, J. A. C. (2000). Bank capital regulation in contemporary banking theory: A review of the literature. Working Papers 90, Bank of International Settlements. Sealey, C., & Lindley, J. T. (1977). Inputs, outputs and a theory of production and cost at
depository financial institution. Journal of Finance, 32, 1251–1266.
Serrano-Cinca, C., Molinero, C. M., & Garcia, F. C. (2006). Behind DEA efficiency in financial institutions (Discussion Papers in Accounting and Finance, AF02-7), University of Southampton.
Shameen, A. (1999). Then there were six: A mega-merger plan sets Malaysia buzzing.
Simar, L., & Wilson, P. W. (2000). A general methodology for bootstrapping in non-parametric frontier models. Journal of Applied Statistics, 27(6), 779–802. Sufian, F. (2004). The efficiency effects of bank mergers and acquisitions in a developing
economy: Evidence from Malaysia. International Journal of Applied Econometrics and Quantitative Studies, 1–4, 53–74.
Sufian, F. (2006). The efficiency of non-bank financial institutions: Empirical evidence from Malaysia. International Research Journal of Finance and Economics, 6,
49–65.
Sufian, F. (2007). What explains differences in the efficiency of non-commercial bank financial intermediaries? Empirical evidence from Malaysia. Asian Academy of Management Journal of Accounting and Finance, 3(1), 37–57.
Sufian, F., & Abdul-Majid, M. Z. (2006). Banks' efficiency and stock prices in emerging markets: Evidence from Malaysia. Journal of Asia Pacific Business, 7(4), 35–53. Sufian, F., & Abdul-Majid, M. Z. (2008). Bank ownership, characteristics and
performance: A comparative analysis of domestic and foreign Islamic banks in Malaysia. MPRA Paper No. 12131. Retreived 24 July 2012 from http://mpra.ub.uni-muenchen.de/12131/
Sufian, F., & Ibrahim, S. (2005). An analysis of the relevance of off-balance sheet items in explaining productivity change in post-merger bank performance: Evidence from Malaysia. Management Research News, 28(4), 74–92.
Weill, L. (2004). On the relationship between competition and efficiency in the EU banking sectors. Kredit und Kapital, 37(3), 329–352.
Yeoh, K. K., & Hooy, C. W. (2011). A DEA analysis on the efficiency of Malaysian commercial banks over 2003-2008. Banker's Journal Malaysia, 136, 3–11. Zhu, J. (2003). Quantitative models for performance evaluation and benchmarking: Data
Envelopment Analysis with spreadsheets and DEA Excel solver. Boston: