NBER WORKING PAPER SERIES
DEBT RELIEF Serkan Arslanalp Peter Blair Henry Working Paper 12187
http://www.nber.org/papers/w12187
NATIONAL BUREAU OF ECONOMIC RESEARCH 1050 Massachusetts Avenue
Cambridge, MA 02138 April 2006
Serkan Arslanalp is an economist from Stanford University, [email protected]. Peter Blair Henry is Associate Professor of Economics at the Stanford University Graduate School of Business, Faculty Research Fellow at the National Bureau of Economic Research, and Senior Non-Resident Fellow at the Brookings Institution, [email protected]. A slightly revised version of this paper will appear as a “Policy Watch” feature in the Winter 2006 issue of the Journal of Economic Perspectives. We thank Jim Hines, Andrei Shleifer, Tim Taylor, and Michael Waldman for detailed comments on an earlier draft. We also thank Jeremy Bulow, Aart Kraay, Paul Romer, John Taylor and seminar participants at the Brookings Institution for helpful comments. Henry gratefully acknowledges financial support from a National Science Foundation CAREER Award and the John A. and Cynthia Fry Gunn Faculty Fellowship at Stanford Business School. The paper reflects the views of the authors and not those of the National Science Foundation. The views expressed herein are those of the author(s) and do not necessarily reflect the views of the National Bureau of Economic Research.
©2006 by Serkan Arslanalp and Peter Blair Henry. All rights reserved. Short sections of text, not to exceed two paragraphs, may be quoted without explicit permission provided that full credit, including © notice, is given to the source.
Debt Relief
Serkan Arslanalp and Peter Blair Henry NBER Working Paper No. 12187 April 2006
JEL No. E, F, O
ABSTRACT
The G-8 Multilateral Debt Relief Initiative (MDRI) is the next step of the Highly Indebted Poor Countries Initiative (HIPC). There are two reasons why MDRI is unlikely to help poor countries. First, the amount of money at stake is trivial. The roughly $2 billion of annual debt payments to be relieved under MDRI amounts to roughly 0.01 percent of the GDP of the OECD countries—a mere one-seventieth (1/70) of the quantity of official development assistance agreed to by world leaders on at least three separate occasions (1970, 1992, 2002). Second, the existence of debt overhang is a necessary condition for debt relief to generate economic gains. Since the world's poorest countries do not suffer from debt overhang, debt relief is unlikely to stimulate their investment and growth. The principal obstacle to investment and growth in the world’s poorest countries is the fundamental inadequacy in these countries of the basic institutions that provide the foundation for profitable economic activity. In light of these facts, the MDRI may amount to a Pyrrhic victory: A symbolic win for advocates of debt relief that clears the conscience of the rich countries but leaves the real problems of the poor countries unaddressed.
Serkan Arslanalp Stanford University Department of Economics Landau Economics Building 579 Serra Mall
Stanford, CA 94305-6072 [email protected] Peter Blair Henry
Stanford University
Graduate School of Business Littlefield 277
Stanford, CA 94305-5015 and NBER
Introduction
At the Gleneagles summit in July 2005, the heads of state from the G-8 countries—the United States, Canada, France, Germany, Italy, Japan, Russia, and the United Kingdom—called on the International Monetary Fund (IMF), the World Bank, and the African Development Bank to cancel 100 percent of their debt claims on the world’s poorest countries. Since the G-8 countries provide the lion’s share of the funding for these multilateral lending institutions, the world’s richest countries have agreed in principle to forgive roughly $55 billion dollars owed by the world’s poorest nations. The details of the proposal, like what debt forgiveness would or should mean to the future of these lending institutions, remain to be worked out. The wisdom of the proposal for debt forgiveness is the subject of this article.
We begin by considering two earlier episodes of debt relief. In the 1980s, debt relief under the “Brady Plan” helped to restore investment and growth in a number of middle-income developing countries. However, the debt relief plan for the Heavily Indebted Poor Countries (HIPC) launched by the World Bank and the International Monetary Fund in 1996 has had little impact on either investment or growth in the recipient countries. We will explore the key differences between the countries targeted by these two debt relief schemes and argue that the Gleneagles proposal for debt relief is, at best, likely to have little effect at all.
Debt relief is unlikely to help the world’s poorest countries, because unlike the middle-income Brady countries, their main economic difficulty is not debt overhang but an absence of functional economic institutions that provide the foundation for profitable investment and growth. The Brady countries had functional (if underperforming) economies, viable private sectors, something for foreign capital to be interested in. The low-income HIPCs, have none of
the above. Counterintuitively, we show that debt relief may be more valuable for Brady-like middle-income countries than for low-income ones, because of how it leverages the private sector.
1. When Debt Relief Worked: The Case of Debt Overhang
Debt relief can promote investment and growth when debt overhang inhibits a country’s economic performance. A country suffers from debt overhang if it owes more money to its creditors than it is able to pay (Krugman, 1988). Debt overhang can arise either, because a country borrows excessively or because a previously manageable stock of debt becomes intractable due to a change in a country’s circumstances—like a fall in the price of its exports relative to imports or poor economic management. A country experiencing debt overhang will be unable to attract new creditors, since lending to such a country would, by the definition of debt overhang, result in a stream of expected repayments whose present value is less than that of the loan.
A country suffering from debt overhang will invest less than it would in the absence of such an overhang and consequently may forego projects with a positive net present value (Sachs, 1984). Underinvestment occurs because the stock of debt acts as an implicit tax on new
investment. A country’s government raises the resources it needs to service its debt by taxing firms and households. An increase in the government’s debt increases the private sector’s expected future tax burden. Because higher taxes divert the benefits of new investment from the private sector to the existing debt holders, they also reduce the private sector’s incentive to invest. In summary, a country suffering from debt overhang is unable to service its debt, obtain
new loans, and invest as much as it should.
Krugman (1989) and Sachs (1989) point to a way out of this inefficient equilibrium, by showing how both borrower and lenders can gain from debt relief. The logic runs as follows. When debt is at reasonable levels, the market value of the debt rises one-for-one with its face value. As the face value of the debt increases beyond a critical threshold, however, debt overhang ensues. With a rising risk of default and slow economic growth, the market value of the debt begins to fall—even as its face value continues to rise. In such a country, physical investment slumps along with the country’s expected future growth rate. The argument for debt relief runs this sequence of events in reverse. If increasing the face value of the debt of a country with debt overhang reduces the market value of its debt, then if creditors reduce the face value of the debt, its market value will rise. For the borrower, debt relief also reduces the implicit tax on investment and reinstates the incentive for the country to undertake efficient investments and for new lenders to extend credit.
But debt relief will not happen without coordination, because any individual creditor would prefer to maintain the full value of its claims while others write off some debt (Sachs, 1989). A third-party-coordinated debt relief program has the potential to solve this problem by forcing all creditors to accept some losses, and thereby paving the way for profitable new lending, investment, and growth (Cline, 1995).
The theory of debt overhang and efficient debt relief captures the experience of a number of middle-income developing countries hit by the debt crisis in the 1980s. During the
international commercial bank lending boom from 1970 to 1981, the inflows of financial capital to these countries exceeded the outflows. Starting in 1982, however, rising interest rates, a
global recession, and poor economic policy choices substantially reduced the expected value of the banks’ loan portfolios in the debtor countries. As their current and future economic prospects dimmed, debtors began defaulting, new lending to them ceased, and outflows of financial capital exceeded inflows for an extended period of time.
In March of 1989, U.S. Treasury Secretary, Nicholas Brady, initiated a plan under which 16 debtors reached debt-relief agreements with their private creditors. Eleven of the 16 were middle-income countries in Latin America: Argentina, Bolivia, Brazil, Costa Rica, Dominican Republic, Ecuador, Mexico, Panama, Peru, Uruguay, and Venezuela. The other five countries were Bulgaria, Jordan, Nigeria, Philippines, and Poland. The commercial banks wrote off a fraction of the debt owed to them, and the countries agreed to implement major economic reforms such as reducing inflation and liberalizing trade (details discussed in Cline, 1995). These plans were announced on a country-by-country basis, starting with Mexico in September 1989 and then continuing throughout the first half of the 1990s. In the twelve months preceding the signing of its debt-relief agreement, the average Brady country’s stock market appreciated by 60 percent—a $42 billion increase in shareholder value—while there was no significant increase in the stock market values of a control group of similar countries that did not sign Brady
agreements (Arslanalp and Henry, 2005a).
Debtor-country stock prices rose, in part, because the market anticipated that debt relief would restore net capital inflows. Before countries signed their Brady Plan agreement, most of them had experienced about ten consecutive years in which the outflow of financial resources exceeded the inflow. After signing their Brady agreement, each of the 16 countries saw an immediate turnaround in which the inflow of financial resources exceeded the outflow and
continued to do so for the next several years.
To appreciate the full significance of the change in flows of financial resources, it is important to distinguish between the direct and indirect effects of debt relief. The direct effect is that debt relief reduces a country’s debt servicing obligations. The indirect effect is that debt relief cleans the books and paves the way for new creditors to lend (Summers, 2000). The direct effect is quantitatively less important. The Brady Plan led to the forgiveness of approximately $60 billion of debt, but that number is modest in comparison to the $210 billion of cumulative net capital inflows that the Brady countries received in the five-year period following the official settlement with their creditors (Arslanalp and Henry, 2005b).
The resurgence of capital inflows reflects the pithy Dornbusch (1993, p.103) maxim: “Unresolved debt problems, not debt per se, are an obstacle to investment. It is hard for a man to establish a relationship with a lender if the estranged wife keeps barging in claiming alimony.” Indeed, the Brady countries experienced an investment boom in the aftermath of debt relief. The average annual growth rate of their capital stocks rose by 1.9-percentage-points—from 1.6 percent per year in the five years prior to debt relief, to 3.5 percent per year in the subsequent five years.1 The data on the growth rate of GDP per capita paint a consistent picture of economic recovery, rising from an average of 0 to 1.6 percent per year over the same time period. Again, a control group of countries do not exhibit such an increase in the growth rate of capital and GDP per capita (Arslanalp and Henry, 2005a). It is also important to note that the increase in GDP growth can not be accounted for solely by the rise in capital stock growth. Therefore, total factor productivity may also have increased due to the accompanying economic reforms (Henry, 2003).
2. The Heavily Indebted Poor Countries (HIPC) Initiative
A follow-up episode of debt relief for a very different set of countries began in 1996. At that time, the World Bank and the International Monetary Fund (IMF) launched the Heavily Indebted Poor Countries (HIPC) initiative in order to “provide a framework for all creditors, including multilateral creditors to” begin reducing the debt burden of “the world's poorest and most heavily indebted countries, and thereby reduce the constraint on economic growth and poverty reduction” (World Bank, 2004).
The original HIPC initiative specified that in order to qualify for debt relief a country must meet two conditions. First it must have a GNP per capita of $695 or less. Second, it must have a debt burden deemed to be "unsustainable,” which was defined as meaning a ratio of the net present value of debt to exports in excess of a country-specific threshold of 200 to 250 percent, or for very open economies, a net present value of debt exceeding 280 percent of
government revenue. The debt burden must be unsustainable even after the full use of traditional debt-relief mechanisms under the Paris Club, which is an informal group of 19 countries that seek coordinated solutions when a debtor nation finds itself unable to repay (Rieffel, 2003; <http://www.clubdeparis.org>). In 1996, 41 countries met these criteria; after recalculating debt sustainability, three countries were added and six subtracted, so that 38 countries are now involved in the HIPC initiative.2 Table 1 list these 38 countries and provides data that indicate the depth of their poverty.
After qualifying for debt relief, the eligible countries needed to produce a track record of
2 Specifically, Comoros, the Gambia, and Malawi were added and Angola, Equatorial Guinea, Kenya, Nigeria, Vietnam, and Yemen were taken out of the group.
reform for three years to reach a “decision point” at which time the creditors arranged a debt relief package. After no more than three additional years of proven policy implementation, countries reached their “completion point” and some measure of debt relief transpired.
Under the original framework, only six countries reached their completion points, a fraction of their debts were forgiven, and a consensus emerged that the process needed to move more quickly. Consequently, the G-7 introduced the enhanced HIPC initiative at its fall 1999 meeting in Cologne, Germany. The enhanced initiative reduced the ratios that qualified a country’s debt burden as unsustainable to 150 percent for net-exports and 250 percent for government revenue. The second initiative also made it easier for countries to reach a decision point, allowed them to begin receiving debt relief as soon as they reached the decision point, and provided greater relief. Under the enhanced HIPC initiative, 16 additional countries began receiving debt relief in 2000, and six more joined this group by October 2005.3
From 1996 to 2000, the per capita GDP of the 38 heavily indebted poor countries grew at 1.9 percent per year—a 2.5 percentage point increase over the period from 1980 to 1995. It is tempting to attribute the increase in growth to the onset of the HIPC initiative in 1996, but more careful consideration produces at least two reasons to be hesitant about embracing that
conclusion.
First, since the actual receipt of debt relief, as opposed to the qualifying process, did not begin until 2000 for most countries, it is not clear that debt relief drove the increase in growth. It is possible that the announcement of future debt relief in 1996 could have stimulated growth in advance of implementation, but the data do not support this alternative explanation. The 22
3 For a detailed chronology of the heavily indebted countries eligible for debt relief at each stage of the process, see http://www.worldbank.org/debt
countries that began receiving debt relief by the year 2000 experienced an almost identical change in growth as the 16 countries that had not. Turning attention to the post-implementation period does not change the story much. From 2001 to 2003, the 22 countries grew at 2.2 percent per year while the group as a whole grew at 2.0 percent per year.
Second, because the largest increase in growth occurred before the implementation of debt relief, the reforms required as a precondition may have been the principal cause (Fischer, Hernández-Catá, and Khan, 1998).
In spite of the limited evidence that the 1996 HIPC initiative has had an impact on growth, whether in its original or enhanced form, many argue that more generous debt relief delivered with greater dispatch would yield better results (Sachs, 2005).
3. The Gleneagles Proposal
The two previous HIPC debt relief initiatives focused on forgiving some of the debt and sometimes stretching out the repayment schedule on the remainder. In contrast, the Gleneagles declaration of June 2005 promises forgiveness of all the debt owed to the three multilaterals. For the debtor countries involved, the critical number is not the $55 billion stock of debt being forgiven but the reduction in debt service, which is only $1-$2 billion per year because of the highly concessional interest rates on the loans. To get a better sense of the economic
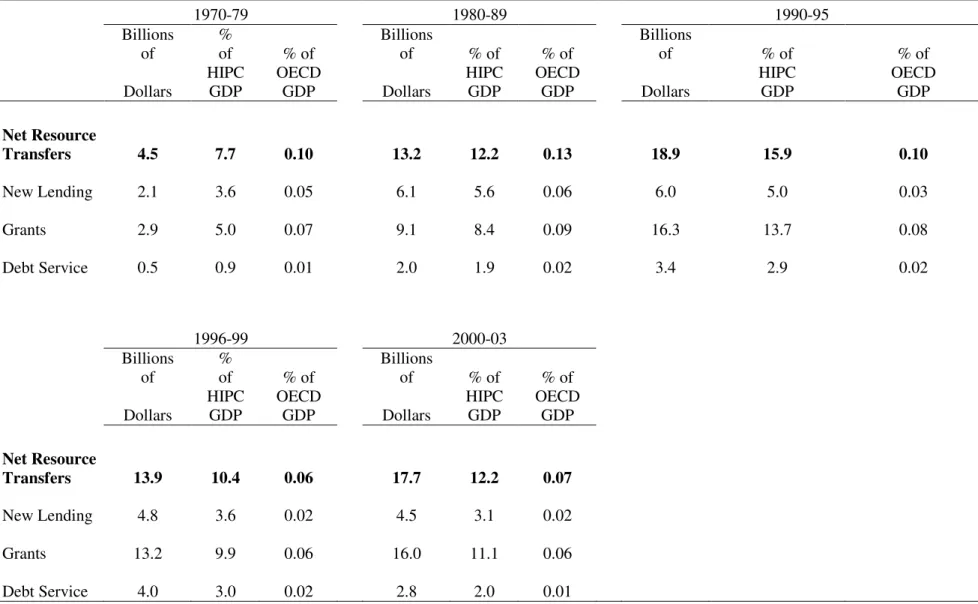
significance of the numbers at stake, it is helpful to introduce the concept of the annual net resource transfer. The net resource transfer to a country is simply its annual net inflow of capital—gross capital inflows minus gross capital outflows:
(1) Net Resource Transfer = New Lending + Grants + Portfolio Equity + Foreign Direct Investment - Debt Service .
On average, more than 90 percent of all capital inflows to the world’s poorest nations take the form of new lending, almost all of which goes to the public sector, or grants (also known as aid). Therefore, in the discussion that follows, we focus on new lending, grants, and debt service.
Table 2 highlights three central facts about the impact of the Gleneagles debt relief proposal on the net resource transfers to heavily indebted poor nations. First, the quantity of money at stake for the developed nations of the world is trivial. The $2 billion of annual debt payments is equal to roughly 0.01 percent of the GDP of the OECD countries. Replacing the funds that would have been received by the multilateral development banks would cost about 1 cent for every 100 dollars of OECD GDP—not exactly a budget-busting expense.
Second, contrary to popular belief, debt service does not cause a net drain of resources from the group of 38 heavily indebted poor countries. Although capital outflows in the form of debt service amount to a nontrivial fraction of the GDP of the heavily indebted poor countries— roughly 3 percent between 2000 and 2005—their gross inflow of capital over the same period of time was much larger—roughly 15 percent of GDP. In other words, despite their debt servicing obligations, the heavily indebted poor countries receive more capital than they pay out to their creditors.
Third, for the past 30 years rich country governments have made no significant increase in the net quantity of resources that they transfer to the heavily indebted poor countries. Given this third fact, it follows from equation (1) that debt relief cannot have a major impact on the overall magnitude of net resource flows. Debt relief reduces debt servicing, but instead of the net resource transfer rising when this occurs, grants or new loans tend to fall. In other words, debt relief in the past has been given instead of, not in addition to, foreign aid. The sum of new
lending and grants to the heavily indebted poor countries increased continually from 1970 to the mid-1990s. But starting with the onset of the HIPC initiative in 1996, aid flows (i.e., grants) as a fraction of GDP decreased. Prior to 1996, aid flows amounted to roughly 13.7 percent of GDP in the heavily indebted poor countries. Since 1996 that figure has dropped to between 9.9 and 11.1 percent. Together, the fall in aid flows and the postponed reduction in debt service has been associated with a decline in the HIPCs’ net resource transfers (although they are still positive).
Since its impact on the NRT is minimal, debt relief cannot propel the HIPCs toward sustained growth and poverty reduction.
4. Debt Overhang vs. Weak Institutions
Debt relief helped the Brady countries in the 1980s, because it removed an obstacle of debt overhang that was standing in the way of new lending, investment, and growth.4 However, the heavily indebted poor countries that were the focus of the 1996 HIPC initiative and now the Gleneagles declaration do not suffer from debt overhang.
If debt overhang hinders capital flows to the heavily indebted poor countries, then just as the Brady countries experienced negative net resource transfers during their bout with debt overhang, the heavily indebted poor countries should now be experiencing negative net resource transfers. But this is not the case. In contrast to the Brady countries, net resource transfers to the heavily indebted poor countries have been positive in recent decades, as shown in Table 2. Exactly how debt relief will help a set of countries in the midst of an uninterrupted stream of
4 This is not to say that debt relief solved all of the economic problems of the Brady countries. Starting with Mexico in 1994 and most recently in Argentina in 2001, a number of Brady countries have encountered severe economic crises since the Brady plan. Even when debt relief is helpful, it is not a vaccination against future economic troubles.
positive net resource transfers since the 1970s is not clear. Presumably, one could argue that debt relief will make the already positive net resource transfers to these countries even larger. However, this counterargument ignores the point made earlier that capital inflows such as grants and new loans do not remain constant when countries receive debt relief.
Indeed, the potential for efficient debt relief in the presence of debt overhang is
predicated on the incentives and rationale that drive lending by profit-maximizing entities such as commercial banks, who dominated the lending to the middle-income countries involved in the Brady plan of the late 1980s and early 1990s. In contrast, official lending, the primary source of debt for the heavily indebted poor countries, responds to a very different set of considerations. The principal creditors of the heavily indebted poor countries, multilateral lending institutions such as the International Development Assistance arm of the World Bank, have a broader mandate. Part of their mission is to channel funds, through a combination of concessional loans and grants, to development projects that may yield large social gains in the long run, but are not immediately profitable (Taylor, 2004). Under the present system, it is unlikely that these multilateral institutions will respond to debt relief by then making larger future loans, and it is quite unclear how debt relief from multilateral institutions will affect private lending to these countries.5
The underlying issue here is that the private sector investment channel, which plays a central role in models of debt overhang, is all but absent in the heavily indebted poor countries.
5 Some argue that the multilateral financial institutions should not lend to poor countries at all, but give grants instead (Bulow, 2002; Bulow and Rogoff, 1988, 2005; Taylor, 2004). The history of aid programs does not inspire confidence that they can be conditioned and monitored to achieve their intended goals (Easterly, 2003). But past failures and current research contain important clues for the design of more effective (and realistic) future aid endeavors (Besley and Burgess, 2003; Birdsall and Williamson, 2002; Brainard, Graham, Purvis, Radelet and Smith, 2003; Burnside and Dollar, 2000).
In models of debt overhang, remember, the government’s debt burden deters investment because it imposes an implicit tax on private sector investment. But for debt overhang to deter private investment, the country must have a private sector with viable investment projects to deter.
One indication that a country’s private sector has viable projects is that it attracts foreign capital to fund those projects. The Brady countries and the heavily indebted poor countries show stark differences on this score. As early as 1974, capital flows to the Brady Countries’ private sector (private debt + foreign direct investment + portfolio equity) comprised nearly half of their total net resource flow, but the private sector of the heavily indebted developing countries has never attracted a significant amount of capital. Capital inflows to the private sector in the heavily indebted poor countries have accounted for as little as 4 percent of inflows and have never exceeded 13 percent (Arslanalp and Henry, 2005b).
Furthermore, the difference between the composition of capital flows to the
predominantly middle-income Brady countries and the heavily indebted poor countries continues to widen. At the peak of the 1985-89 debt crisis, official grants plus public and publicly
guaranteed debt accounted for 73 percent of the net resource transfer to the Brady countries, but by 1994, the private sector was the destination for the majority of their net resource flows. No such shift has taken place in the heavily indebted poor countries that have received debt relief. In fact, the opposite has occurred—official flows and flows to the public sector have become more, not less, important. The role of official grants has increased to the point where they now constitute the majority of net resource flows to the heavily indebted poor countries (Arslanalp and Henry, 2005b).
post-debt-relief recovery in investment and growth, with foreign capital flows playing a significant financing role. Since the private sector in the heavily indebted poor countries has never attracted a quantity or composition of foreign resources comparable to that of the Brady Countries, it is hard to believe that even complete and immediate debt relief would generate capital inflows, investment, and growth of any consequential magnitude.
Recent research about the ways in which legal and financial institutions affect economic development help explain why private capital does not flow to the heavily indebted poor
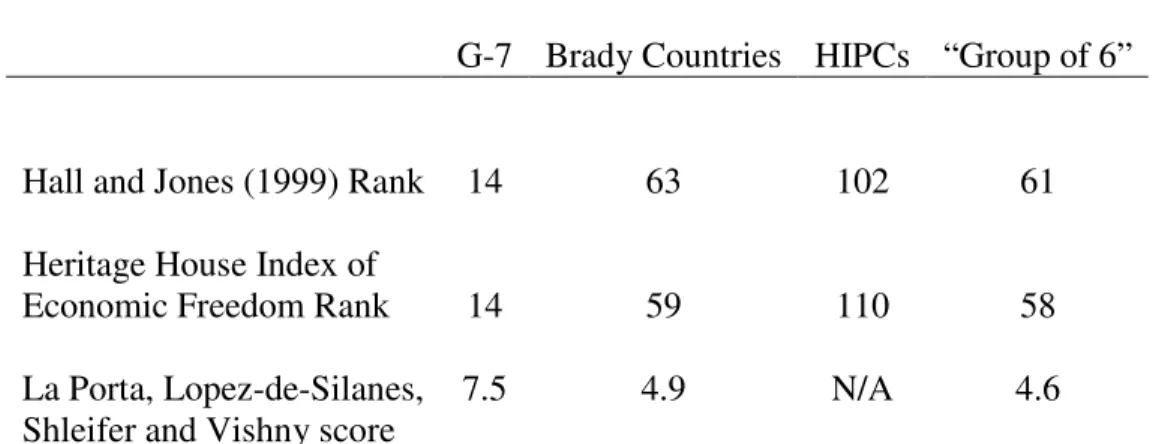
countries and, moreover, why it would be unlikely to do so even in the event of complete and immediate debt forgiveness. Table 3 illustrates a considerable body of research which makes the point that the quality of institutions that provide the foundation for development is vastly lower in the heavily indebted poor countries than it is in other nations. The first column of Table 3 refers to the G-7 countries: that is, the United States, Canada, France, Germany, Italy, Japan, and the United Kingdom. The second column is the 16 Brady countries, which again were mostly middle-income countries in Latin America. The third column is the 38 heavily indebted poor countries. The final column is a so-called Group of Six heavily indebted but not as poor
countries: Indonesia, Pakistan, Colombia, Jamaica, Malaysia, and Turkey. The rows of Table 3 provide various measures of institutional quality.
The first row of Table 3 compares the institutions of these groups of countries using the index of economic infrastructure constructed by Hall and Jones (1999). The index ranks 130 countries and attempts to capture the extent to which a country’s economic infrastructure provides “an environment that supports productive activities and encourages capital
countries. The median G7 country ranks 14th while the median Brady country 63rd; the median HIPC comes in a distant 102nd.
The second row of Table 3 compares economic infrastructure using the Heritage House Index of Economic Freedom and gives similar results. This index ranks 161 countries and is based on measures of 10 broad factors of economic freedom including property rights, regulation and trade policy (http://www.heritage.org/research/features/index/index.cfm).
La Porta, Lopez-de-Silanes, Shleifer and Vishny (1997, 1998, 2002) measure the degree to which a country’s laws protect the rights of investors by constructing a composite index of shareholder rights, creditor rights, efficiency of the judicial system, rule of law, and the accounting system. They find that a country’s measure on this index exerts a significant influence on its access to external finance. The third row of Table 3 shows that the median Brady country ranks lower than the median G7 country on the LaPorta et al. index of investor protection, which runs from 0 to 10. While the median Brady country ranks low, the heavily indebted poor countries lack sufficient financial development to even merit a ranking. It is debatable whether the LaPorta et al. index is the most relevant measure of economic
infrastructure for such destitute countries, but it rounds out the central point that the heavily indebted poor countries rank low on every conceivable metric of the quality of institutions that affect economic growth (World Bank, 2005).
Table 3, then, highlights a fact almost too obvious to state, but once stated, whose implications are unavoidable: Unlike the mostly middle-income Brady countries during the 1980s, the HIPCs principal problem is not debt overhang but an absence of economic infrastructure—both hard infrastructure like roads and schools, and soft infrastructure like
markets and property rights. Without the crucial foundations for profitable economic activity, it strains the imagination to believe that even full and immediate debt forgiveness will precipitate the burst of foreign capital flows, investment, and growth that it did in the Brady countries.
Ironically, the political and financial resources devoted to securing debt relief for the HIPCs might be more profitably employed towards a number of countries not being considered for such programs at all. These include the group of six heavily indebted but not as poor developing countries—Indonesia, Pakistan, Colombia, Jamaica, Malaysia, and Turkey—whose economic infrastructures closely resemble those of the Brady Countries.
The principle of policy targeting states that distortions arising from a market failure should be tackled with policy instruments that address the failure directly (Bhagwati, 1971; Dixit, 1994). Both debt overhang and inadequate economic infrastructure produce inefficient outcomes that result from market failure. However, the nature of the market failure, and
therefore the appropriate policy intervention, differs in each case. Debt relief can be an efficient policy response to debt overhang, because it forces each lender to internalize the negative impact—on the borrower and other lenders—of the lender’s refusal to reduce its claims.
But the HIPCs market failure stems not from lender intransigence, but a failure of institutions. Their governments fail to provide a rule of law that protects investors, property rights, and contracts. These same governments fail to provide roads and other physical infrastructure, in part because of an inability to name and pursue public needs, and in part because their countries are so poor that their tax base provides too little revenue for such work. In theory, greater inflows of foreign capital could help both in identifying projects with a large social payoff and in financing those projects. But as mentioned earlier, debt relief efforts since
1996 have actually accompanied declining net resource transfers. Unless the heavily indebted poor countries find ways to address their lagging institutional infrastructure, foreign investors will remain extremely hesitant about committing additional resources to them.
Conclusion
The main beneficiaries of the Gleneagles debt relief proposal would appear to be the rich countries who garner good political press at a trivial cost (Rogoff, 2005). Forgiving debt does not address the fundamental problem of inadequate economic institutions that impedes
investment and growth in the world’s poorest countries. And, to the extent that additional resources are part of the solution, the indirect approach of debt relief does little, if any, good. In the past debt relief has had a minimal impact on net resource flows, and there is nothing in the Gleneagles proposal to suggest that it will be much different. One of the central development issues of our day is whether the high-income countries of the world will stand ready to help with real money when the low-income countries demonstrate that they are ready to put the resources to good use. The danger is that the Gleneagles declaration may amount to a Pyrrhic victory: A symbolic win for advocates of debt relief that clears the conscience of the rich countries but leaves the real problems of the poor countries unaddressed.
References
Arslanalp, Serkan and Peter Blair Henry. 2005a. “Is Debt Relief Efficient?” Journal of Finance, Vol. 60, No. 2, pp. 1017-1051.
Arslanalp, Serkan and Peter Blair Henry. 2005b. “Helping the Poor to Help Themselves:
Debt Relief or Aid?” in Sovereign Debt at the Crossroads, edited byChris Jochnick and Fraser A. Preston. Oxford University Press, Forthcoming.
Besley, Timothy and Robin Burgess. 2003. “Halving Global Poverty.” Journal of Economic Perspectives, Vol. 17, No. 3, pp. 3-23.
Bhagwati, Jagdish N. 1971. “The Generalized Theory of Distortions and Welfare,” in J.N. Bhagwati et al. (ed.) Trade, Balance of Payments and Growth: Essays inhonor of Charles Kindleberger. Amsterdam: North Holland.
Birdsall, Nancy and John Williamson. 2002. Delivering on Debt Relief: From IMF Gold to a New Aid Architecture. Washington, DC: Institute for InternationalEconomics.
Brainard, Lael, Carol Graham, Nigel Purvis, Steven Radelet, and Gayle E. Smith. 2003. The Other War: Global Poverty and the Millenium Challenge Account. Brookings Institution Press: Washington, D.C.
Bosworth, Barry and Susan M. Collins. 2003. “The Empirics of Growth: An Update.” Brookings Papers on Economic Activity, No. 1, pp. 113-206.
Bulow, Jeremy. 2002. “First World Governments and Third World Debt.” Brookings Papers on Economic Activity, No.1, pp. 229-55.
Bulow, Jeremy and Kenneth Rogoff. 1988. “Cleaning up Third World Debt Without Getting Taken to the Cleaners.” Journal of Economic Perspectives, Vol. 4, No. 1, pp.31-42. Bulow, Jeremy and Kenneth Rogoff. 2005. “Grants Versus Loans For Development Banks.”
American Economic Review, Forthcoming.
Burnside, Craig and David Dollar. 2000. “Aid, Policies, and Growth.” American Economic Review, September, Vol. 90, No. 4, pp. 847-868.
Cline, William. 1995. International Debt Reexamined. Washington, D.C.: Institute for International Economics.
Dornbusch, Rudiger. 1993. “Investment in Developing Countries.” In Stabilization, Debt and Reform. Prentice-Hall.
Easterly, William. 2003. “Can Foreign Aid Buy Growth.” Journal of Economic Perspectives, Vol. 17, No. 3, pp. 23-48.
Fischer, Stanley, Ernesto Hernández-Catá, and Moshin Khan. 1998. “Africa: Is This the Turning Point?” IMF Paper on Policy Analysis and Assessment, 98(6).
Hall, Robert, and Chad Jones. 1999. “Why do some countries produce so much more output per worker than others?” Quarterly Journal of Economics, Vol. 114, No. 1, pp. 84-116. Henry, Peter Blair. 2003. “Capital Account Liberalization, The Cost of Capital, and Economic
Growth.” American Economic Review, Vol. 93, No. 2, pp. 91-96.
Krugman, Paul. 1988. “Financing Versus Forgiving a Debt Overhang.” Journal of Development Economics, Vol. 29, pp. 253-268.
Krugman, Paul. 1989. “Market-Based Debt Reduction Schemes.” In Analytical Issues in Debt, edited byJacob Frenkel, Michael Dooley, and P. Wickham. Washington: IMF.
LaPorta, Rafael, Florencio Lopez-de-Silanes, Andrei Shleifer, and Robert Vishny. 1997. “Legal Determinants of External Finance.” Journal of Finance, Vol. 52, pp. 1131-50. LaPorta, Rafael, Florencio Lopez-de-Silanes, Andrei Shleifer, and Robert Vishny. 1998.
“Law and Finance.” Journal of Political Economy, Vol. 106, pp. 1113-1155. LaPorta, Rafael, Florencio Lopez-de-Silanes, Andrei Shleifer, and Robert Vishny. 2002.
“Investor Protection and Corporate Valuation.” Journal of Finance, Vol. 57, pp. 1147- 1170.
Rieffel, Lex. 2003. Restructuring Sovereign Debt: The Case for Ad Hoc Machinery Brookings Institution Press, Washington, D.C.
Rogoff, Kenneth. 2005. "Debt relief an empty, backward gesture." Business Day (South Africa) June 21.
Sachs, Jeffrey. 2005. The End of Poverty. The Penguin Press: New York.
Sachs, Jeffrey. 1984. “Theoretical Issues in International Borrowing.” Princeton Studies in International Finance, Vol. 54.
Sachs, Jeffrey. 1989. “The Debt Overhang of Developing Countries.” In Debt
Pentti Kouri, and Jorge Braga de Macedo. Oxford: Basil Blackwell.
Summers, Lawrence. 2000. “Moving Forward with Millennial Debt Relief.” Remarks at Reception to Celebrate HIPC, House Banking Committee Room, United States Congress, Washington, DC. February 1, 2000.
http://www.treas.gov/press/releases/ls363.htm.
Taylor, John. 2004. “Millenium Challenge Corporation and the U.S. Role in the
Multilateral Development Banks,” in Policies in International Finance 2001-2005: A Real Time Record in Speeches and Testimony
http://www.stanford.edu/~johntayl/PoliciesInternationalFinance.htm The World Bank. 2004. Heavily Indebted Poor Countries Initiative Fact Sheet
http://siteresources.worldbank.org/INTDEBTDEPT/DataAndStatistics/20263218/HIPC-Fact-Sheet-web.pdf
The World Bank. 2005. Doing Business in 2005: Removing Obstacles to Growth. Oxford University Press: Washington, DC.
Table 1. The Heavily Indebted Poor Countries (HIPCs).
Receiving Debt Relief* Still Under Consideration
Benin (2000) Madagascar (2000) Central African Republic Liberia Bolivia (1997) Malawi (2000) Comoros Myanmar Burkina Faso (1997) Mali (1998) Republic of Congo Somalia Burundi (2005) Mauritania (2000) Cote d'Ivoire Sudan Cameroon (2000) Mozambique (1998) Lao PDR Togo Chad (2001) Nicaragua (2000)
Democratic Republic
of Congo (2003) Niger (2000) Ethiopia (2001) Rwanda (2000) Gambia (2000) Sao Tome and Principe (2000) Ghana (2002) Senegal (2000)
Guinea (2000) Sierra Leone (2002) Guinea-Bissau (2000) Tanzania (2000) Guyana (1997) Uganda (1997) Honduras (2000) Zambia (2000)
Infant Mortality
(per 1000 births) Life Expectancy (years) GDP per capita (current US$) Growth of GDP per capita (1980-2000)
United States 7 77 34,370 2.0
HIPC Average 100 51 310 -0.2
Source: World Bank: http://www.worldbank.org/debt.
* As of October 2005. The numbers in parenthesis indicate the years in which countries reached their decision points under either the original or enhanced HIPC initiative.
Table 2. New Lending, Grants, and Debt Service for the Heavily Indebted Poor Countries.
1970-79 1980-89 1990-95
Billions
of % of % of Billions of % of % of Billions of % of % of
Dollars HIPC GDP OECD GDP Dollars HIPC GDP OECD GDP Dollars HIPC GDP OECD GDP
Net Resource Transfers 4.5 7.7 0.10 13.2 12.2 0.13 18.9 15.9 0.10 New Lending 2.1 3.6 0.05 6.1 5.6 0.06 6.0 5.0 0.03 Grants 2.9 5.0 0.07 9.1 8.4 0.09 16.3 13.7 0.08 Debt Service 0.5 0.9 0.01 2.0 1.9 0.02 3.4 2.9 0.02 1996-99 2000-03 Billions of % of % of Billions of % of % of
Dollars HIPC GDP OECD GDP Dollars HIPC GDP OECD GDP
Net Resource
Transfers 13.9 10.4 0.06 17.7 12.2 0.07
New Lending 4.8 3.6 0.02 4.5 3.1 0.02
Grants 13.2 9.9 0.06 16.0 11.1 0.06
Debt Service 4.0 3.0 0.02 2.8 2.0 0.01
Source: The data on net resource transfers, new lending, and debt service are obtained from World Bank’s Global Development Finance Data Base. The data on grants are obtained from the World Bank’s World Development Indicators Data Base.
Table 3. Comparisons of Economic Infrastructure
G-7 Brady Countries HIPCs “Group of 6”
Hall and Jones (1999) Rank 14 63 102 61
Heritage House Index of
Economic Freedom Rank 14 59 110 58
La Porta, Lopez-de-Silanes,
Shleifer and Vishny score 7.5 4.9 N/A 4.6
The first row lists the median Hall and Jones (1999) rank for each country group. The second row lists the median Heritage House Index of Economic Freedom rank. The third row lists the median La Porta, Lopez-de-Silanes, Shleifer and Vishny score of social infrastructure. The countries in the group of six are Indonesia, Pakistan, Colombia, Jamaica, Malaysia, and Turkey.