MNB WORKING PAPER
2004/8
Csilla Horváth – Judit Krekó – Anna Naszódi
INTEREST RATE PASS-THROUGH: THE CASE OF
HUNGARY
Online ISSN: 1585 5600 ISSN 1419 5178
ISBN 9 639 383 59 7
Csilla Horváth: Economics Department
E-mail:
Judit Krekó: Economics Department
E-mail:
Anna Naszódi: Economics Department
E-mail:
The purpose of publishing the Working Paper series is to stimulate comments
and suggestions to the work prepared within the Magyar Nemzeti Bank.
Citations should refer to a Magyar Nemzeti Bank Working Paper.
The views expressed are those of the authors and do not necessarily reflect
the official view of the Bank.
Magyar Nemzeti Bank
H-1850 Budapest
Szabadság tér 8-9.
http://www.mnb.hu
Abstract
In this paper we analyze the interest rate pass-through in Hungary, with the help of ECM and TAR models, using both aggregated and bank level data. According to the linear ECM results, the corporate loan market, which is characterized by the strongest competition, adjusts its prices fully and quickly to the short-term money market rate. The adjustment of deposit rates and household loan rates is characterized by incompleteness and/or sluggishness. We analyze the potential non-linearities of banks’ pricing by TAR models. The results suggest that the speed of adjustment of bank rates depends on the size of the changes in the money market rate and the distance of bank rates from their long-term equilibrium level. The sign of yield shocks and the volatility of the market rate also turn out to be influential to the speed of adjustment.
JEL classifications: E43, E52, G21.
1 INTRODUCTION 5
2DETERMINANTS OF INTEREST RATE PASS-THROUGH 8
2. 1 Role of the financial system 8
2. 2 Theories of bank rate stickiness 9
2. 3 Implications of the theories for Hungary 10
3STYLIZED FACTS 15
3. 1 Aggregated deposit and loan rates 15
4LINEAR ECONOMETRIC MODELING 20
4. 1 Method of estimation 20
4. 2 ECM results 22
5ANALYSIS OF NON-LINEAR ADJUSTMENT 25
5. 1 Method 25
5. 2 Results of TAR estimations 26
6CONCLUSIONS 32
1
Introduction
The decisions of banks about the yields on their assets and liabilities have an impact on the expenditure and investment behavior of deposit holders and borrowers and hence, on the real economy. Interest rates can influence the real economy through three main mechanisms of the interest rate channel. The reaction of companies and households depends on the magnitude of the substitution effect, i.e. the change in the relative costs of alternative credit and deposit possibilities. Changes in the interest rates alter the costs and incomes of economic agents and, consequently, their net income (income effect). Finally, they affect the value of real and financial assets and, therefore, the wealth of companies and households (wealth effect).
The way changes in central bank interest rates are passed through to changes in banks’ yields determines the strength of these effects to a great extent. Thus, the effectiveness of monetary policy depends on the degree and speed of interest rate adjustment to changes in policy-controlled interest rates.
Both theoretically and empirically, the interest rate channel of monetary transmission has received great attention in the past. There are several papers on the stickiness of bank retail rates and the sluggishness of bank responses to changes in market conditions in the euro countries. The results of these studies show that interest rate transmission differs both across countries and instruments. Cottarelli and Kourelis (1995) studying several European countries find evidence of complete pass-through for most countries. In their study, the long-term adjustment parameter on average is 0.97 and falls within the range of 0.75–1.25 in most of the cases. In Borio and Fritz (1994) this value is between 0.8 and 1.1. Burgstaller (2003) finds similar results for Austria and so does Bredin (2001) for Ireland. De Bondt (2002), who studies adjustments for the euro countries, concludes the long-term pass-through for bank lending rates is close to 100%.
Differences in the speed of adjustment proved to be much more considerable: duration of adjustment varied between 2 months and 3 years. Mojon (2000) measures the degree of pass-through in five European countries: Belgium, Germany, France, The Netherlands and Spain. He assumes complete pass-through in the long-run and focuses on the short-run reactions. He finds (1) sluggish responses of retail rates, (2) the response of short-term rates to be faster than that of long-term rates, and (3) a higher (short-term) pass-through when money rates increase compared to when they decrease. De Bondt (2002) also finds considerable stickiness in short-term adjustment of bank rates and also shows that there is convergence in the pass-through of the euro countries after the establishment of the Monetary Union.
There are also a few articles that analyze the adjustment of bank rates to inter-bank rates in Hungary. Világi and Vincze (1995) use AutoRegressive Distributed Lag (ARDL) models to examine the pass-through in the period 1991-1995 and find sluggish adjustment of interest rates and emphasize that the adjustment is far from complete, even in the long run. Based on visual inspection of stabilizing and decreasing spreads, Árvai (1998) concludes that in the period 1992-1998 the reaction of commercial banks’ interest rates had the tendency for somewhat better adjustment, especially after 1996. Várhegyi (2003) mainly focuses on the
strength of competition, but also touches upon the speed of adjustment of bank rates to the two-week interbank rate. By regressing differenced bank rates on contemporaneous and lagged values of differenced money market rate (MMR) she concludes that corporate loan and deposit rates adjust at a faster pace than household rates, although the paper does not incorporate the long-run dynamics of bank rates. In a recent paper Crespo-Cuaresma et al. (2004) study three new EU countries with an ARDL model. They find complete pass-through for the short-term corporate loan rate and incomplete pass-pass-through for the household deposit rates in Hungary.
Our paper differs from the existing empirical literature on the Hungarian pass-through not only because of the difference in the sample periods, but also because of the different methodologies. In this study we apply panel data analysis in addition to analyzing aggregate data. We apply various error-correction (ECM) models to investigate the pass-through from local currency (Forint) MMR to local currency interest rates in the Hungarian banking system. Besides the standard linear ECM, we augment the model with Threshold AutoRegressive (TAR) features to study different kinds of non-linearities in the adjustment process. We study nonlinearities related to the size of disequilibrium and yield shocks, to the sign of disequilibrium and yield shocks, and to volatility. Our sample period covers January 1997–April 2004 for monthly aggregate data and January 2001–January 2004 for monthly bank-level data. In the later case we use data for 25 banks in a panel framework. The selection of the sample period is motivated by data availability and comparability and by the fact that changes in the banking system and in the monetary regime make data of previous years uninformative.
We focus on the pass-through from short-term MMRs and not from the policy rate because MMRs are much closer related to the cost of funding of the banks. However, since inter-bank rates adjust very quickly and efficiently to the central bank interest rate, we can extrapolate our findings to changes in the policy rate.
Comparing our results with those of Árvai (1998) and Világi and Vincze (1995) the interest rate transmission has improved since the mid 1990s due to the improvement of macroeconomic and financial environment. Our results are in line with those of Crespo-Cuaresma et al. (2004), despite the different estimation method used and the different time-span of the data, who find complete pass-through for the short-term corporate loan rate and incomplete pass-through for the household deposit rates in Hungary.
We would like to highlight that our paper focuses on the first stage in the transmission mechanism hence, no direct conclusions can be drawn about the strength of the interest rate channel. The functioning of the channel is considerably influenced by the interest rate sensitivity of consumption and investment expenditures, and by the importance of banking instruments in the balance sheets of economic agents. These two factors depend mainly on the structure and magnitude of households’ and companies’ net wealth and the significance of non-banking financial intermediation. In the case of Hungary, we have to mention an important additional factor, namely the access to foreign exchange loans that can substitute loans denominated in the national currency.
The rest of the paper is organized as follows. In Section 2 we discuss several theories that provide explanations for the sluggish and incomplete adjustment of bank rates and provide an overview of the literature that emphasizes the importance of the structure of the financial system. In this section we also highlight the main structural characteristics of the Hungarian banking system and compare them to those of the euro countries. In Section 3 we list several stylized facts that can be established before the econometric analysis. Section
4 introduces the linear econometric model and presents the results, and Section 5 covers the TAR estimation applied to investigate the potential non-linearities in the adjustment process. Section 6 concludes the paper.
2
Determinants of interest rate pass-through
Imperfections of the pass-through raise two different, although not independent questions. The first refers to the degree of pass-through, namely the extent at which changes in the MMR are passed through to banking rates in the long run. The second aspect is the speed of the pass-through, namely how long the adjustment takes. Below we review the determinants of the interest rate transmission, with primary focus on the characteristics of the financial system, and we touch upon theories of bank rate stickiness.
2. 1
Role of the financial system
The varying strength and speed of monetary interest rate transmission can be strongly connected with differences in the structural properties of financial systems1, with special
regard to disintermediation, intensity of competition in the banking sector, capitalization and liquidity position of banks, and monetary policy and interest rate volatility.
Disintermediation
The degree of disintermediation and the role of non-bank financing have an impact on the elasticity of both loan demand and deposit supply with respect to the money market rate. On the asset side, loan demand is expected to react more intensely to interest rate changes in an economy with developed capital and money markets, as companies may substitute bank loans with other forms of financing. Similarly, households’ access to alternative investment opportunities of deposits affects the market rate elasticity of deposit supply, and consequently the degree of pressure on bank deposit rates.
Competition among banks
Intensity of competition among banks also influences the interest rate elasticity of loan demand and deposit supply. A low degree of competition, both among banks and with non-bank financial markets, implies a higher spread and has an influence on banks’ pricing behavior. However, this effect might differ depending on the direction of change in the MMR. On the asset side, with limited competition interest rates on loans might react more intensely to increases and more sluggishly to decreases of the money market rate, and the opposite holds for the liability side, namely for deposits.
Empirical research on the relationship between competition and pass-through provides ambiguous results. Cottarelli and Kourelis (1995) find that differences in market concentration among countries do not explain the differences in pass-through significantly. In contrast, Mojon (2000) concludes that sharper competition among banks contributes to faster and more symmetric adjustment of bank rates.
Capitalization and l quidity position of banksi
Well-capitalized and liquid banks are less forced to adjust to changes in monetary policy and have the possibility of swallowing the shocks, at least temporarily. For example, a
better liquidity position and capitalization provide a better opportunity for banks to smooth their interest rates.
Monetary policy and interest rate volatility
Changing interest rates on bank instruments incur adjustment costs to banks. Due to these so-called menu costs, the adjustment of bank rates depends on banks’ assessment of whether a change in the policy rate is temporary or permanent. If a change is considered to be temporary, and to be (partially or fully) reversed soon, a bank might decide to smooth interest rates. Hence, the pricing behavior of commercial banks is influenced by their perception of the nature of changes in interest rates. Accordingly, higher volatility in interest rates is likely to lessen the degree/speed of adjustment, as each shift in the market rate is probably regarded as temporary. Mojon (2000) as well as Cottarelli and Kourelis (1995) find evidence in their multiple country empirical study for interest rate volatility influencing the pass-through.
2. 2
Theories of bank rate stickiness
Theories concerning the pricing behavior of banks constitute a special sub-area of the theories of pricing.2 Explanations about price and wage stickiness are also applicable for
bank rates.
According to the classical theory, with perfect competition and complete information the price is equal to the marginal cost and the derivative of price with respect to the marginal cost is equal to one. If the assumptions of perfect competition and complete information do not hold, then this derivative declines below one. This idea can be applied to bank rates. For instance, the more the market structure moves away from perfect competition towards monopolistic competition, the more loan rates exceed the marginal cost of funds. Some theories, which explain why bank rates do not move one for one with the market rates are based on, for example, ideas of adverse selection, switching cost, consumer irrationality and risk sharing. Lowe and Rohling (1992) present an excellent summary of these theories. One should note that under certain circumstances and assumptions the bank rates might even overreact or forego changes in the policy rate. According to one argument, bank rates can change prior to changes in marginal funding. Banks may, for instance, anticipate a rise in funding costs and increase loan rates in advance. This argument has higher relevance if banks finance longer-term loans with shorter-term deposits, which is usually the case. According to our other argument, changes in bank rates can exceed changes in the marginal cost of fund. If the required yield of a loan responds one for one with the marginal cost of fund, leaving the profit rate unaffected, then the loan rate should also change by the same magnitude in a risk-free world. If we assume that borrowers can default, the loan rate should cover not only the cost of fund, but also the expected loss caused by non-payers. The higher the loan rates, the more the expected loss caused by the
2 There are two different approaches to model pricing: (1) when price changes are time-dependent and (2)
when decisions on price changes depend on state-variables (state-dependent pricing). Since the cost of fund, i.e. the alternative cost, influences pricing decisions mainly at a credit institution, modeling the loan rates as a state-dependent variable seems more plausible.
group of non-payers. Consequently, loan rates should increase more than the cost of fund to cover extra loss.3
2. 3
Implications of the theories for Hungary
We begin our empirical analysis by reviewing the Hungarian financial system from the point of view of the interest rate pass-through. It is especially important to study the structural factors influencing the interest rate pass-through, because most of these factors are such institutional characteristics, which can only change gradually (see, for example, Mojon; 2001). Because these slowly-changing, country-specific factors will not disappear by the time Hungary introduces the euro, the Hungarian pass-through may converge slowly to the EMU country pass-through. Even in the EMU the pass-through is found to differ substantially across countries (see, for example, Mojon; 2001). Some of the above-discussed factors support the hypothesis of fast interest rate pass-through in the Hungarian financial system, while some factors imply a slow and gradual pass-through. Below we evaluate the effect of these factors and make inferences on the pass-through in the future based on the expected changes in these structural characteristics.
Disintermediation
As pointed out earlier, the phenomenon of disintermediation affects both the asset and the liability sides of banks. Below, we discuss both effects.
In order to evaluate households’ access to alternative investment opportunities, that is the interest rate sensitivity of the deposits, one should take a look at the financial portfolio of households. In 2002 bank deposits accounted for about 31% of households’ total financial assets.
Table 1 shows that this indicator has similar values in other European countries.
3 Expressing this in a simple formula: (1+rl)⋅(1−EN)=1+rrequired , where is the loan rate, is
the expected ratio of non-performing loans.
l r EN 1 1 1 > − = ∂ ∂ EN r r required
l , so the loan rate should increase
more than the required yield does. Thus, if we take into account that the ratio of non-performing loans is not constant but is increasing in the loan rate, then the derivative should be even higher.
Table 1
Households’ bank deposits relative to their total financial assets, 2002
Country % Austria 52.1 Belgium 26.1 Finland 32.5 France 28.3 Germany 33.3 Netherlands 19.7 Norway 32.4 Portugal 44.1 Spain 36.5 Sweden 13.6 Hungary 31
Sources: Eurostat and MNB
Moreover, the share of bank deposits in the total financial assets had declined in the previous years: in the last 5 years the share of bank deposits fell by about 10 percentage points, while the share of many profitable non-bank investments grew. This reallocation was not in favor of direct investments on the capital market, but mostly in favor of life insurance related investments, which were subsidized by tax deduction opportunities. This shows that investment opportunities other than bank deposits are not only available for households, but that households did substitute part of their deposits by alternative investments.
From the asset-side point of view, the consequences of the strength of competition between banks and non-bank financial institutions are ambiguous. Capital markets play a marginal role in corporate financing. In Hungary, the ratio of stock market capitalization to GDP is less than 30% of the EMU country average. However, the financial systems of these countries are also dominated by banks. In Hungary, the corporate bond market is especially underdeveloped and we do not expect substantial progress in the near future. In addition, financial intermediation is continuously deepening.
On the other hand, about 30% of the loans to this sector come from abroad; mostly from banks, and 56% of all loans to the household and corporate sector from domestic and foreign banks are denominated in foreign currency (see Table 2). Consequently, corporations, especially large corporations, can relatively easily substitute their domestic bank loans with foreign currency denominated loans, of which the interest rate is not affected by domestic monetary policy.
To sum up, while the dominance of bank financing indicates a high interest rate elasticity of the corporate loan demand, the availability of foreign currency loans might have opposite effect.
Table 2
Distribution of corporate and household loans and deposits by currency denomination (2003)
Non-financial corporations Households
Loans Deposits Loans Deposits
Domestic banks, HUF 44 54 97 87 Domestic Banks, foreign currency 29 12 3 13 Foreign banks, foreign currency 27 34 - - Total 100 100 100 100 Source: MNB Competition among banks
Both the Herfindhal index and the market share of the top 5 banks show that in international comparison concentration and competition in the Hungarian bank sector are of medium level. The value of the Herfindhal index is about 1000 (see Table 3), so the market can be viewed as being almost competitive. However, this aggregate indicator hides the differences across the sub-markets, namely, between the corporate and household business line. The low value of the Herfindhal index (700–800 in previous years) in the corporate business line indicates sharp competition and elastic corporate loan and deposit rates. At the same time, competition is rather limited in the household sector. The Herfindhal index for this sector is much higher, above 2000.4 However, concentration indices do not necessarily show the strength of competition, because other factors, such as entry rules and regulations, affect the competition as well. (Móré and Nagy; 2003 and Mojon; 2000). Várhegyi (2003) argues that taking into account the efficiency and profitability of the Hungarian bank sector modifies our view on competition: the relatively low efficiency coupled with high profitability indicates weaker competition. Based on the difference of the concentration between the household and corporate sector, we expect to have more complete and faster, and perhaps more symmetric pass-through in corporate rates than in household rates.
4 The largest Hungarian bank (OTP Bank) dominates the household market, and deposits of households are
Table 3
Concentration of the banking sector in the EMU countries (2002) Share of top 5 banks in
terms of total assets (%) Herfindhal index
Austria 46 548 Belgium 82 Denmark 68 Finland 79 2000 France 45 Greece 67 1125 Netherlands 83 1700 Ireland 46 486 Germany 20 150 Italy 31 Portugal 60 1000 Spain 53 870
Average in the EMU region 39 640
Hungary 55 950
Sources: MNB (2004), ECB (2002)
Capitalization and l quidity position of banks i
The Hungarian banking sector has structural excess liquidity, which is unequally distributed among banks. This excess liquidity ensures more freedom to banks in their pricing policy, for example a more liquid bank is less forced to adjust its deposit rate quickly and perfectly to the increased market rate. Obviously, competition for deposits influences this pricing decision as well.
Excess liquidity has been declining in recent years, which is advantageous for the planned shift from passive-side regulation to active-side regulation. The anticipated further shrinking of liquidity and the shift to active-side regulation will presumably improve the efficiency of the pass-through.
Monetary policy and interest rate volatility
The market rate in Hungary as well as the central bank base rate changed by relatively large steps in the recent years. This fact motivates the banks to adjust their rates more quickly than in other countries enjoying a more stable financial environment. Due to menu costs and banks’ intention to smooth interest rates for their customers, higher changes in the market rates enforce faster reaction compared to smaller ones (25–50 basis points), which are more absorbable by the interest rate margin. On the other hand, the variability in the sign of the changes in the market rate counts against a fast interest rate pass-through, since it is rational for banks to disregard temporary changes in the market rate in the presence of menu costs.
Hungary’s future entry into EMU causes a downward trend of the domestic interest rate because of the interest rate convergence. This trend is not very stable, since the exact time of the entry is uncertain. Furthermore, deviations from the trend are possible as is exemplified by the rate hikes at the end of 2003. The expected downward trend could result in upward rigidity of bank rates, but other factors might counterbalance this effect. In addition to the characteristics discussed in the theoretical part of this paper, we find it important to emphasize some further typical characteristics of the Hungarian banking system that probably influence and determine the pass-through.
Credit risk
Adverse selection might be more relevant in the Hungarian banking sector than in countries with a more advanced financial system because in Hungary potential borrowers usually have rather short credit history or no credit history at all. Credit history can help banks to make inferences about the risk of customers, but the not yet very deep financial intermediation and the lack of a positive inter-bank credit register system for the household sector further limits the available information about credit risk.
Term structure of loans and deposits
We study the pass-through by analyzing the interest rate movements of new loans/deposits, although from the point of view of the transmission mechanism it is not only these loans but the entire set of loans that matters. The speed of interest rate transmission is influenced not only by the adjustment of new loan/deposit rates, but also by the term structure of existing loans/deposits. The higher the weight of short-term instruments and instruments with variable interest rate in the portfolio, the faster the pass-through is. In comparison to the European average, loans and deposits have shorter average terms in Hungary (more than 90% of corporate loans and deposits and household deposits have shorter than one year repricing period). This is typical of countries with higher inflation and higher interest rate volatility. With the anticipated decline in inflation and the strengthening of economic stability, the duration of loans is expected to become longer, indicating a possible slowdown in the interest rate pass-through in the future.
3
Stylized facts
In order to analyze the pass-through with econometric models, we use data at different levels of aggregation, i.e. we have panels of interest rates of individual banks from among 23 banks for the period January 2001–January 2004 and also estimate dynamic models based on aggregated interest rate data calculated as a weighted average of individual bank rates. Based on these data we can already formulate some stylized facts about the pass-through.
3. 1
Aggregated deposit and loan rates
Monthly data on aggregate time series are available for corporate short-term loans and deposits (up to 1 year), household short-term deposits with a fixed maturity up to 1 year and consumer credit up to 5 years. Some important stylized facts emerge from the developments in average loan and deposit rates.
1. The spread between loan rates and the MMR (3-month inter-bank rate, the BUBOR) and between the inter-bank rate and deposit rates seems to be related to the movements of the MMR. Specifically, the spread between loan rates and the MMR is correlated negatively (the correlation coefficient is -0.23 for the corporate and -0.61 for the consumer loan rate), while the spread between deposit rates and the money market rate is correlated positively with the MMR itself (the correlation coefficient is 0.61 for household and 0.41 for corporate deposit rates) (see
Chart 1 and Chart 2). This indicates imperfect pass-through, although it is not entirely clear whether this can be ascribed to incomplete or only sluggish adjustment.
2. The relationship between the MMR and the different spreads seems to differ over the various segments of the market. On the liability side, there is a clear difference between the household and corporate business lines. The spread of short-term household deposit rates is characterized by higher volatility and stronger association with the MMR than that of corporate deposit rates, suggesting that household deposit rates adjust less or at a lower speed to changes in the MMR. Household deposit rates are on average lower than corporate deposit rates. This is due to the more intense competition in the market of corporate funds and to the price insensitive deposit supply of households. However, in some periods of significant falls in the MMR, for example in February 2002 and January– February of 2003, corporate deposit rates temporarily fell below household deposit rates, due to the sluggish adjustment of the latter. This leads to the conclusion that commercial banks smooth the reactions of deposit rates to the fluctuations of the MMR to a higher extent with respect to non-corporate customers.
Chart 1
Spread between short-term corporate loan rates and the 3-month BUBOR
4 5 6 7 8 9 10 11 12 13 14 15 16 01 .0 0 03 .0 0 05 .0 0 07 .0 0 09 .0 0 11 .0 0 01 .0 1 03 .0 1 05 .0 1 07 .0 1 09 .0 1 11 .0 1 01 .0 2 03 .0 2 05 .0 2 07 .0 2 09 .0 2 11 .0 2 01 .0 3 03 .0 3 05 .0 3 07 .0 3 09 .0 3 11 .0 3 01 .0 4 03 .0 4 Per ce nt 0.0 0.5 1.0 1.5 2.0 2.5 3.0 Per ce nt
short term corporate loan 3-month BUBOR
short term corporate loan - 3-month BUBOR (right scale)
Chart 2
Spread between deposit rates and the 3-month BUBOR
4 5 6 7 8 9 10 11 12 13 14 15 16 01. 00 04. 00 07. 00 10. 00 01. 01 04. 01 07. 01 10. 01 01. 02 04. 02 07. 02 10. 02 01. 03 04. 03 07. 03 10. 03 01. 04 04. 04 Per ce nt 0 0.5 1 1.5 2 2.5 3 3.5 4 4.5 5 Per ce nt 3-month BUBOR
3-month BUBOR -household deposit (right scale) 3-month BUBOR-corporate deposit (right scale)
On the other hand, the spread between household deposit rates and the MMR appears to be more volatile than the spread between corporate loan rates and the MMR. Consequently, the margin between corporate loan rates and household deposit rates, i.e. the spread between the revenue from the most important asset and the cost of the most important liability, also shows a positive and strong correlation (0.68) with the MMR (see Chart 4). This might indicate that commercial banks’ profit is also positively correlated to the MMR changes, that is, a higher MMR implies a higher margin for the banks. For example, in the case of an
interest rate hike gains arising from the widening household deposit spread exceed losses deriving from the narrowing corporate loan spread.
Chart 3
Spread between short-term corporate loan rates and the 3-month BUBOR
4 5 6 7 8 9 10 11 12 13 14 15 16 01.00 03.00 05.00 07.00 09.00 11.00 01.01 03.01 05.01 07.01 09.01 11.01 01.02 03.02 05.02 07.02 09.02 11.02 01.03 03.03 05.03 07.03 09.03 11.03 01.04 03.04 Per cent 0.0 0.5 1.0 1.5 2.0 2.5 3.0 3.5 4.0 4.5 5.0 Per cent
3-month BUBOR corporate loan-household deposit (right scale)
3. It is noticeable that in the second part of 2003 commercial banks reacted to increases in the MMR with a lag and, consequently, the spread of the corporate loan rate fell to an unusually low level. Banks’ perceptions of the changes in the outlook for central bank rates and their effect on expectations might explain this relatively slow adjustment to an increase. The downward path of interest rates and the process of convergence to EMU, which characterized the previous years, might have resulted in an upward rigidity of interest rates, as market participants perceived the rate hikes as transitory. Presumably this phenomenon played an important role in the sluggish adjustment to the 300 basis point interest rate hike of November 2003. Market information5 also supports the idea that the unusually large
change in the policy rate was partly regarded as transitory, as it was directly triggered by a speculative and significant depreciation of the Forint.
It is necessary to mention that January 2003 should be regarded as an exemption, due to the speculative attack. Incomplete adjustment of deposit and loan rates in that period coincided with the central bank’s intention. In January 2003, a speculative attack was mounted against the strong edge of the Forint’s band. The MNB purchased a considerable amount of euros during the two days of the attack, in order to prevent the market rate from appreciating further. The central bank responded to the influx of speculative capital by slashing interest rates: during the two days of the speculative attack it lowered the interest rate on the two-week deposit facility, its main policy instrument, by 200 basis points, to 6.5%. However, effective interest rate cuts by the Bank were much greater than that, as quantity restrictions were also imposed on the two-week facility. Thus, excess liquidity could only be channelled into O/N deposits that continued to be freely available. The widening of the overnight interest rate corridor from ±1% to ±3% also entailed a drop in yields on the O/N deposit facility with a temporary 500 basis point decline in
effective yields. However, the additional reduction in interest rates in response to the cut in the main policy rate was deliberately a temporary phenomenon. The MNB accomplished a substantial reduction in the effective interest rate by using alternative instruments, and not by changing the policy rate, in order to communicate the temporary nature of this decline. 4. We also investigate the developments in interest rates on consumer credit. Consumer credit rates – in contrast with short-term corporate loan rates – contain a very high, 15–20 percentage point spread to the market rates. The interest rate on consumer credit is apparently less correlated to the market rate, although a part of consumer credit has longer maturity, hence direct comparison with the MMR might be somewhat misleading. However, one can assume that the lower the weight of costs of fund relative to other factors, such as the risk premium content of the interest rate, the weaker the relationship between the commercial bank interest rate and the MMR.
Chart 4
Spread between consumer credit rates and the 3-month BUBOR
5 7 9 11 13 15 17 19 21 23 25 27 29 31 33 03. 01 05. 01 07. 01 09. 01 11. 01 01. 02 03. 02 05. 02 07. 02 09. 02 11. 02 01. 03 03. 03 05. 03 07. 03 09. 03 11. 03 01. 04 03. 04 Per cen t 15 17 19 21 23 25 27 29 31 33 35 37 39 41 43 Per cen t 3-month BUBOR consumer credit
5. Obviously, a lower than MMR interest rate on required reserves imposes a burden on banks' earnings. During the observed period the required reserve ratio and the interest rate paid on reserves changed toward a gradual elimination of the implicit tax on banks through reserve requirements, while possibly having a diminishing effect on spreads. The official indicator of this implicit tax shows the minimum spread between deposit and loan rates, which led to zero profit after complying with the minimum reserve requirement. The approximately 80 basis point decrease in this indicator could have led to a reduction in the spreads between loan rates and deposit rates, but only the spread between the corporate loan rates and MMR has a downward trend over the period January 2000–November 2003. Thus, the decline in the corporate loan spread might be attributed mainly to the negative correlation between the corporate loan spread and the MMR and the upward trend of the MMR in the sample period.
Chart 6
Implicit tax on reserves and the spreads
0.0 0.5 1.0 1.5 2.0 2.5 3.0 01.00 04.00 07.00 10.00 02.01 05.01 08.01 12.01 03.02 06.02 09.02 01.03 04.03 07.03 11.03 %
implicit tax on reserves
Spread between corporate loan rate and 3-month BUBOR Spread between 3-month BUBOR and deposit rates
Spread levels in international comparison
The magnitude of spread between the MMR and corporate loan rates is similar to, or even lower than that of other European countries. Based on Mojon (2000), in European countries corporate loan rates contain a 2–3 percentage point spread over the MMR. This spread was 1.5 percentage points on average in Hungary in the period 2000-2003, having decreased from its 1996–1999 peak of around 2 percentage points. This reduction might be regarded as somewhat surprising, since the share of riskier loans to SMEs (small and medium-sized enterprises) has increased continuously in the past few years, and for these loans banks charge higher non-interest costs than for those to SMEs. It is possible that a fall in the spreads of individual instruments offsets the effect of changing composition. On the liability side, however, spreads are somewhat higher than in the euro area. The average corporate deposit rate was 1.8 and the household deposit rate was 2.4 percentage points lower than the MMR on average in the period under review. These spreads prove to be high in comparison to the 1–2 percentage point spreads in the countries of the euro area.
4
Linear econometric modeling
4. 1
Method of estimation
Let us consider the simplest Error-Correction Model (ECM) as a starting point to measure the connection between the market interest rate and the interest rate on loans or deposits:
t n t n n t n t n n t n r i r i , =α +β0 ∆ −γ( , 1−µ −δ 1)+ε . ∆ − − , (1)
where denotes loan or deposit interest rates of the nth bank at period t, and is the MMR of month t. The main advantage of using the model in this form is that both the long-run and the short-run parameters can be obtained directly. In the expression for the long-term equilibrium relationship
t n
i , rt
)
(in,t−1 −µn −δnrt−1 , δn means the long-run equilibrium relationship and µn refers to the spread between the MMR and bank rates.6
The speed of adjustment parameter is γn, which has sensible economic interpretation if it is positive. The time required for the adjustment to the long-run equilibrium can be expressed, for example, by the duration of 80% adjustment, expressed in months.
Expanding equation (1) with further short-term dynamics we get: (2) t n t n n t n n K k L l t l k t kn n t n r i i r i , 1 1 . 0 1 ln , =α + β ∆ + ξ ∆ −γ ( −µ −δ )+ε ∆ − − = − = −
∑
∑
We estimate equations (1) and (2) using the two-step approach of Engle and Granger (1987), i.e. first we estimate the expression for the long-run equilibrium (in,t =µn+δn rt)
and then we substitute the error correction term into equation (1) or (2).
We estimate the above discussed equations both on aggregated and bank level data. The motivation for estimating the model on aggregated data is threefold. First, the sample period is longer; second, for the household instruments we have reliable data only on the aggregate level; finally, we exclude some of the banks from the panel analysis due to serious data failure or because they had an insignificant market share or focused mainly on non-market-based loans. Aggregate data comprises information about the interest rates of all banks that exist in a certain month. Finally, our panel results utilize data of each bank equally (we have unweighted estimates). Aggregate data combines data for each bank at a certain time, weighting the observations with the (relative) total assets of each bank. So, for the corporate business line we can contrast the results obtained from aggregate and panel analysis for robustness checks, while on the household business line we can only rely on results from aggregate data.
6 Subtracting from both sides of the long-run equilibrium expression we get
t
r in,t−rt =µn−(1−δn)rt.
Now, it is easy to see that the spread (in,t −rt) is constant in the case of complete pass-through (if δn =1), but in the case of incomplete adjustment (that is, if δn<1) the higher the MMR the lower the spread on the loan market. In the deposit market the opposite holds.
As it is not entirely clear which is the instrument that should be considered as the effective MMR, we perform the analyses using different measures (1 and 3-month BUBOR and the 1, 6, and 12-month treasury bills). The results differ somewhat, but the overall message is the same, so we only present the results obtained with the 3-month BUBOR in the article. Based on separate Augmented Dickey-Fuller tests for each variables, and the panel unit root tests of Levin, Lin and Chu (2002) and Im, Pesaran and Shin (2003) we find that all time series for corporate and household deposit and loan interest rates follow an I(1) process and so do the considered MMRs. Johansen cointegration tests between the separate interest rate series and the MMRs indicate one cointegrating vectors at least at the 10% level. According to the residual-based cointegration test in panel data of Kao (1999) we have to reject the null hypothesis of no cointegration already at the 1% level for both the corporate loan and deposit markets. Weak exogeneity tests support the use of single-equation ECMs for the aggregate as well as for the panel data. During model selection we proceed from the more general model (2), fixing the maximum lags at 3, and through excluding the insignificant variables we arrive at the final model.
In May 2001 the Hungarian monetary regime switched to inflation targeting. In order to check whether the introduction of the new regime resulted in significantly different pass-through we estimated the pass-pass-through on two separate samples of aggregate data and compared the results. Whereas in case of the shorter panel data starting in January 2001 no reliable estimation is possible for the pre-inflation targeting period, consequently, we compare the estimates on the full sample with the estimates on the sub-sample characterized by the IT regime. We find no significant difference in the pass-through of the two regimes on none of the data sets. Therefore, below we show the estimation results that utilize all available data.
Estimation techniques applied for the ECM based on aggregate data
In the aggregate level analysis, the long-term coefficients are estimated using the ARDL approach developed by Pesaran and Shin (1997), while the standard errors are calculated using the so-called Bewley’s regression (Bewley; 1979).
Estimation techniques applied for the panel ECM
In order to find the proper panel ECM specifications, we test the assumption of equal slope and intercept parameters over the cross-sectional units (banks).7 The F-tests suggest
the use of bank-specific constants (banks work with different interest rate spreads) and same slopes for the long-run equilibrium equation, both for corporate loans and for deposits. When estimating the second stage, in the case of the short-term dynamics, we can accept the null of common slope and common intercept and the estimated common constant turned out not to differ significantly from zero.
In light of the above results, we use three estimation methods.
7 We also estimate the ECM separately for each bank (we do not show these results here). This is important,
on the one hand, to gain some insight into the adjustment behavior of each bank separately, keeping in mind the fact that the estimates – especially the long-run equilibrium parameter – are based on a quite limited number of observations. On the other hand, it provides ideas on cross-sectional heterogeneity and on the final choice of the panel model. We find high and reasonably fast pass-through among the 25 banks and very similar parameters. So, average pass-through parameters can be interpreted properly in models with common slope coefficients.
1. First, we estimated the long-run equation with fixed effect, and the ECM with a common effect model (see as FE-OLS).
2. Second, we estimated both the long-run equation and the ECM with the same method under the fixed effect specification, substituting (in,t−1−µn −δ nrt−1) into the ECM (see as FE-FE).
3. The second method might be biased due to the lagged dependent variable in the ECM, but by increasing the sample in the time dimension the magnitude of bias di minishes. Although our panel seems to be sufficiently long to neglect the bias, we also estimated the ECM equation with GMM (Generalized Methods of Moments) using the approach of Arellano and Bond (1991) (we refer to this as FE-GMM).
4. 2
ECM results
4. 2. 1Results from aggregate-level analysis
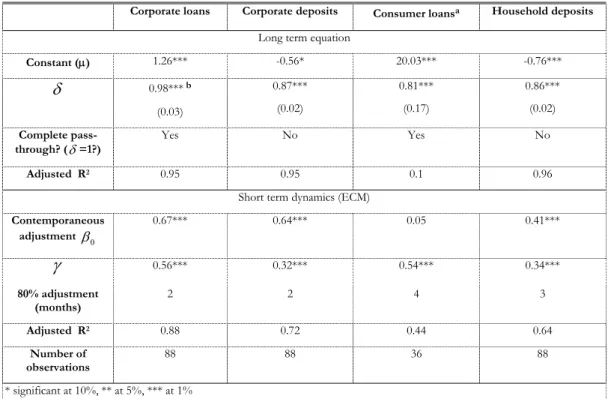
We use the same short-term loan and deposit data as the one discussed in Subsection 3.1. for the aggregate-level analysis. Aggregate data are available for the period January 1997– April 2004 except for consumer credit, which has a shorter time-span: data are only available from May 2001 to April 2004.8 As Table 4 shows, the results are consistent with
the conclusions derived from the stylized facts but, in addition to providing general insights into the adjustment behavior, now we can measure and interpret long-run and short-run adjustment separately. The results suggest a clear difference in the adjustment of corporate and household interest rates. Corporate loans and deposits have somewhat higher long-run pass-through, but the short-run adjustment parameters differ markedly, implying that the mean adjustment lag is significantly lower than in the household segment. The corporate loan market is the only market with a long-run pass-through parameter close to unity, that is, complete adjustment. In all other markets the long-run parameter is significantly lower than one, which suggests incomplete pass-through; although in the case of consumer loans the null of complete adjustment cannot be rejected because of the very high standard errors probably arising from the very short sample.9 In the corporate loan and deposit
markets the pass-through is reasonably quick; the greatest part of the adjustment takes place within two months. This fast and quite high degree of adjustment is probably due to high competition in the corporate segment.
We would like to point out that the difference between the pass-through of corporate and household deposits turns out to be mainly due to the difference in the short-term reactions, and not so much due to the difference in the long-run pass-through.
The incomplete and slow adjustment of consumer credit and the very high spread (around 20 percentage points) can be explained partly by the low interest rate elasticity of demand.
8 For January and February 2003 we introduce two time dummies, because in the period January 17–February
25 the interest rate corridor was kept wider. However, these dummies turn out not to be significant, so we exclude them from the final model.
9The fact that the point estimate of δ is lower for consumer credit than for any other instruments, but due
to the fact that its 95% confidence interval is about eight times wider than that of corporate or household deposits, for which we reject the null, we accept that it clearly illustrates this.
These results are in line with those of Crespo-Cuaresma et al. (2004), despite the different estimation method used and the different time-span of the data, who find complete pass-through for the short-term corporate loan rate and incomplete pass-pass-through for the household deposit rates in Hungary.
Table 4
Results for the ECM estimated on aggregated data (January 1997–April 2004)
Corporate loans Corporate deposits Consumer loansa Household deposits
Long term equation
Constant (µ) 1.26*** -0.56* 20.03*** -0.76*** δ 0.98*** b (0.03) 0.87*** (0.02) 0.81*** (0.17) 0.86*** (0.02) Complete pass-through? (δ=1?) Yes No Yes No Adjusted R2 0.95 0.95 0.1 0.96
Short term dynamics (ECM)
Contemporaneous adjustmentβ0 0.67*** 0.64*** 0.05 0.41*** γ 0.56*** 0.32*** 0.54*** 0.34*** 80% adjustment (months) 2 2 4 3 Adjusted R2 0.88 0.72 0.44 0.64 Number of observations 88 88 36 88 * significant at 10%, ** at 5%, *** at 1%
a For consumer loan interest rates, data are available from May 2001
b The long-term coefficients are estimated using the ARDL approach developed by Pesaran and Shin (1997), while the standard errors are calculated using the so-called Bewley’s regression (Bewley; 1979).
4. 2. 2Results of the panel data analysis
Panel data include short-term corporate deposit rates and short-term corporate loan rates for the sample period, January 2001–January 2004. The panel results are similar to those on aggregate data and the results are alike in the case of all the three estimation techniques. Table 5 clearly shows that short-term corporate loan rates appear to fully and quickly adjust to the MMR. Most of the adjustment to the long-run equilibrium (80 per cent) takes place within two months. The long-run adjustment parameter is close to one and we cannot reject the null-hypothesis of complete long-run adjustment at the 5% level. According to the panel results, the point estimate of the long-run pass-through of MMR changes to corporate deposit rates is very similar to that obtained from the aggregate analysis, however in this case we cannot reject the null hypothesis of complete pass-through. The immediate adjustment parameter is similar to that of corporate loan rates, and the speed of adjustment parameter is somewhat lower.
Table 5
Results for the panel regression for corporate loans and corporate deposits
Corporate loans Corporate deposits
FE-OLS FE-FE FE-GMM FE-OLS FE-FE FE-GMM
Long-run equation
δ 0.95 0.95 0.95 0.87 0.87 0.87
Complete pass-through?
(δ =1?)
Yes***a Yes*** Yes*** Yes*** Yes*** Yes***
2 R 0.85 0.85 0.85 0.71 0.71 0.71 ECM 0 β 0.67*** (0.04) 0.67*** (0.04) 0.69*** (0.04) 0.66*** (0.03) 0.54*** (0.03) 0.70*** (0.04) 1 β 0.10*** (0.04) 0.09*** (0.04) - 0.22*** (0.03) 0.22*** (0.03)) - γ 0.61*** (0.03) 0.61*** (0.03) 0.57*** (0.08) 0.29*** (0.03) 0.28*** (0.03) 0.30*** (0.12) 80% adjustment (months)) 2 2 2 2 2 2 N 748 748 748 820 820 820 2 R 0.47 0.45 0.41 0.53 0.52 0.48
* significant at 10%, **: significant at 5%, ***: significant at 1%. Monthly data, January 2001-January 2004.
a To investigate the whether there is complete pass-through on a market we apply the following procedure. We estimate the long-run relationship assuming complete pass-though and test the stationarity of the residuals using panel unit root tests. Rejection of the null hypothesis of unit root implies complete pass-through.
5
Analysis of non-linear adjustment
There are a number of theoretical reasons for the non-linear adjustment of bank rates. If conditions of perfect competition are violated, the pricing behavior of banks might depend on properties such as the size and/or the direction of interest rate shocks, and their effects on expectations. Below, we examine three cases which might result in non-linear pass-through.
1. First, we investigate adjustment of bank rates differ depending on the size of MMR change and/or deviation from the long-term equilibrium. Due to presence of menu costs and the intention of banks to smooth interest rates for their customers, banks may react more intensely to wider changes in the money market rate. In this case the adjustment might be significantly faster above a certain threshold. This effect was investigated, for example, by Sander and Kleimeier (2003).
We also investigate whether the adjustment process depends on the sign of the MMR change and/or the sign of the deviation from the long-term equilibrium. Asymmetric adjustment might be entailed by the low interest rate elasticity of loan demand and deposit supply, due to the profit maximizing behavior of banks under market imperfections and adjustment costs (see Section 2). A usual finding in the literature (e.g. Hannan and Berger; 1991, Sander and Kleimeier; 2002) is that loan rates are more rigid downward, while deposit rates tend to be sticky upward.
2. Adjustment of bank rates might also differ depending on the size of MMR change and/or deviation from the long-term equilibrium. Due to presence of menu costs and the intention of banks to smooth interest rates for their customers, banks may react more intensely to wider changes in the money market rate. In this case the adjustment might be significantly faster above a certain threshold. This effect was investigated, for example, by Sander and Kleimeier (2003).
3. Third, we analyze the effect of yield volatility on the pass-through. Higher volatility, and hence higher interest rate uncertainty, might attenuate the adjustment, as banks judge the changes in the money market rate as transitory. This effect was demonstrated by Mojon (2000) in an analysis of European countries. However, in our view, higher volatility is often accompanied by larger changes in yields, which hastens the adjustment process. The final outcome, emerging from these two opposite effects, is highly uncertain.
5. 1
Method
We apply TAR models (we also estimated STAR (Smooth Transition AutoRegressive) models, which provided us with rather odd results, so we choose to present here those obtained from TAR models), in which the adjustment parameters differ depending on the position of the so-called indicator variable. Non-linearities enter only in the ECM equation, where it is assumed that non-linearities influence only the speed of adjustment towards the long-run equilibrium. These threshold effects were investigated, for example, by Sander and Kleimerier (2003), where the authors constructed two regimes with different gamma parameters. We introduce two regimes not only for the speed of adjustment, but also for
the contemporaneous adjustment parameters. The general form of our model is the following: t n t t t n t t n t t t t n r rI i r i r G i, =α+β0∆ +β0∆ −γ( , 1−δ 1−µ)−γ ( , 1−δ 1−µ) +ε . ∆ ∗ − − ∗ − − , (3) where ≤ > = 2 2 , 0 , 1 c y if c y if I t t t , (4) and ≤ > = 1 1 , 0 , 1 c x if c x if G t t t . (5)
The indicator variables (x, y) in the different specifications:
1. Size asymmetry: yt = ∆rt and xt= in,t−1−δrt−1−µ (6)
2. Sign asymmetry: yt =∆rt and xt =−(in,t−1−δrt−1−µ) and c1=c2=0. (7)
3. Volatility asymmetry: xt= yt =stdev(r), and c1=c2=c (8) Volatility is measured by the 2-month standard deviation of the 3-month benchmark yield. In the case of the sign asymmetry, the thresholds are set to zero, (c1=c2 =0), that is the estimation is reduced to a simple OLS with dummy variables. When analyzing size and volatility asymmetry, the threshold values are also estimated by the so-called sequential conditional least squares. This means that we estimate a simple OLS under different thresholds, and then the model with the smallest standard error is chosen (see Franses and van Dijk (2000) p. 84, for further details). The set of possible threshold values were established in such a way that each regime contains at least 15 per cent of the total observations. We estimate the model on both aggregated and panel data and use the FE-OLS specification for panel data analysis.
In our specification in the immediate adjustment and the adjustment to the long-run equilibrium in one regime (where or It Gt is zero) is characterized by β0 and γ , respectively. However, in the other regime (where the indicator functions become one) the corresponding parameters are and (and not and like, for example in the case of Sander and Kleimerier; 2003). We opted for this specification because the possible difference between the different regimes can be simply captured and tested by the size, sign, and significance of the star parameters.
* 0 0 β β + γ+γ* * 0 β γ*
We do not present the results for the consumer loans due to the very limited number of available observations.
5. 2
Results of TAR estimations
5. 2. 1Size asymmetry
Both aggregated and panel data estimations confirm that the pricing of corporate loan and deposit rates is non-linear, but depends on the size of MMR change and the size of deviation from the long term equilibrium (see Table 6). In the case of corporate loan rates,
both the speed of adjustment and the contemporaneous adjustment parameters are significantly higher above a certain threshold, according to both the aggregate data and the panel data. According to the panel results, a change in the MMR which is higher than 60 basis points entails three times larger contemporaneous adjustment than in the case of lower MMR changes. Moreover, the speed of adjustment parameter is significant only when the error correction term exceeds 30 basis points. In the case of corporate deposit rates, the panel results suggest non-linearity only for the contemporaneous adjustment parameter, while aggregated results show asymmetry for both relationships. Aggregate data show non-linearity in the contemporaneous parameter for household deposit rates, but no non-linearity for the speed of adjustment towards the long-term equilibrium.
We note here that for the contemporaneous adjustment parameters, the thresholds for which standard error of regression is minimized turn out to be rather high values, around 60-80 basis points.
Table 6
Size asymmetry - TAR results
Panel data
(Jan. 2001–Jan. 2004)
Aggregate data (Jan. 1997–Apr. 2004) Corporate
loans Corporate deposits Corporate loans Corporate deposits Household deposits
0 β 0.28** 0.20** 0.56*** 0.22** 0.14** ∗ 0 β 0.46*** 0.56*** 0.14** 0.46*** 0.35*** 1 c (%point) 0.59 0.67 0.82 0.70 0.82 γ 0.16 0.30*** 0.46** 0.25*** 0.45*** ∗
γ
0.80*** - 0.25** 0.30*** - 2 c (%point) 0.28 - 0.52 0.24 - N 748 820 89 89 89 *** Significant at 1%; ** 5%; * 10%. 5. 2. 2Sign asymmetryOur results on asymmetric sign responses (presented in Table 7) are partly in line with other empirical studies which report downward stickiness in the loan market (see, for example, Mojon; 2000 and Sander and Kleimeier; 2002). Panel and aggregate results turn out to be similar for corporate deposits rates (both fail to detect evidence of sign asymmetry. Corporate loan rates prove to be sticky downwards, i.e. the immediate adjustment is significantly higher (at 5%) when the MMR increases than when it decreases. Panel results suggest slower adjustment to underpricing than to overpricing (hence, downwards stickiness), while the opposite is found in the aggregate analysis. However, these asymmetries are not significant at the 5% significance level, only at 10%.
One might expect downward stickiness in loan rates and upward rigidity in deposits rates due to the profit maximizing behavior of banks in case of weak competition, if loan demand and deposit supply are inelastic with respect to possible smoothing of changes in MMR (for example, if an increase in MMR does not or only partially passes through to bank deposit rates does not lead to substantial decrease in deposit supply). However, taking
into account the strong competition in the corporate segment and the fact that our linear model shows quick and complete pass-through for the corporate loan rates, our results might be regarded as somewhat surprising. In addition, the expected downward trend of domestic interest rates due to Hungary’s future entry into the EMU (discussed in Section 1.3) possibly refers to upward rigidity. Another remarkable result is that household deposit rates react more intensely to MMR increases than to decreases. These unpredicted results might be partly attributed to the fact that the average size of MMR rate increases is higher than that of MMR falls and size effect may dominate sign effect in our analysis.
Table 7
Sign asymmetry – TAR results
Panel data
(Jan. 2001–Jan. 2004)
Aggregated data (Jan. 1997–Apr. 2004) Corporate
loans Corporate deposits Corporate loans Corporate deposits Household deposits
0 β 0.59*** 0.62*** 0.53*** 0.61*** 0.26*** ∗ 0 β 0.19** 0.16 0.24*** 0.04 0.28*** γ 0.54*** 0.44*** 0.71*** 0.27* 0.38*** ∗
γ
0.16* -0.12 -0.34* 0.09 -0.09 N 748 820 89 89 89 *** Significant at 1%; ** 5%; * 10%. 5. 2. 3Volatility asymmetryAlthough our results vary somewhat over the different types of instrument, at least one of the adjustment parameters turns out to be significantly higher above a certain level of yield volatility for all types of bank rates (see Table 8). This indicates that the effect of higher interest rate changes on the pass-through exceeded the adverse effect of higher interest rate uncertainty. It is important to emphasize that we cannot distinguish between the effect of higher uncertainty on expectations and the effect of larger changes in yields, which is a consequence of higher interest rate volatility. This makes the interpretation of our results difficult. The year 2003 serves as a good illustration. In this period, money markets could be characterized by high uncertainty about the convergence process, which was reflected in the increased risk premiums and volatility of yields. Higher volatility was accompanied by wider movements in yields. Monetary policy reacted by unusually large policy rate changes to the risk premium shocks.
Table 8
Volatility asymmetry –TAR results
Panel data
(Jan. 2001–Jan. 2004)
Aggregated data (Jan. 1997–Apr. 2004) Corporate
loans Corporate deposits Corporate loans Corporate deposits Household deposits
0 β 0.43*** 0.22** 0.50*** 0.36*** 0.15* ∗ 0 β 0.34*** 0.52*** 0.23*** 0.37*** 0.32*** γ 0.54*** 0.37*** 0.55*** 0.24*** 0.25*** ∗
γ
0.21*** -0.01 0.14 0.41** 0.24*** c (%point) 0.09 0.06 0.14 0.08 0.12 N 748 820 86 86 86 *** Significant at 1%; ** 5%; * 10%.5. 2. 4Controlling for different asymmetric effects
Despite the above mentioned difficulties in distinguishing the different sources of asymmetric effects, we make an attempt to separate the different asymmetric effects from each other (i.e., to control for one effect when investigating the other). We estimate TAR models that include two types of asymmetries. As we suspect among the three interrelated effects that it is the size effect that dominates the others we run regressions where we always controlled for the size effect. Due to the highly increased number of regimes, we only focus on the panel data for this exercise. Because raises in the MMR were in general higher than the decreases, we now let the threshold values differ when distinguishing big and small increases and decreases in the 3-month BUBOR (e.g., in equation 6 is allowed to be different for increases and for decreases ). This means, for example, that when investigating sign and size asymmetries in one model, in the case of the immediate pass-through we construct two indicator functions:
and , where subscripts M and S refer to magnitude and sign, respectively. 2 c + otherwise or 1 + 2 c c2− IMt ∆ > ∆ < = if rt c rt c − , 0 , 1 1 ∆ > = otherwise r if I t St , 0 0 , 1
Size and sign asymmetry
According to the results in Table 9, for the corporate loan market, immediate adjustment to small negative changes in the MMR is slow (β0=0.14) and insignificant in the case of small
negative changes in the MMR. Increases induce faster immediate adjustment (the parameter belonging to the cross product with is 0.17 but is only significant at the 10% level) while we again find evidence for a strong size effect (the parameter expressing the size effects is 0.48 and is significant at the 1% level). In the case of speed of adjustment to the long-run equilibrium, we only find evidence of the size effect. Results for the corporate deposit market are very much in line with what we found when analyzing the sign and size asymmetries separately: we do not find any significant asymmetric effect for the speed of adjustment to the equilibrium, while the immediate adjustment turns out to be significantly
St I
and considerably higher for big changes in the MMR than to small ones (the parameter belonging to the cross product with is 0.83 and significant even at the 1% level). These results support the idea that size effects dominate sign effects.
Mt I
Table 9
Sign and size asymmetry, volatility and size asymmetry
Sign and size asymmetry Volatility and size asymmetry Corporate loans Corporate deposits Corporate loans Corporate deposits
0 β 0.14 0.05 0.33*** 0.18** ∗ S 0 β 0.17* -0.07 - - ∗ M 0 β 0.48*** 0.83*** 0.51*** 0.50*** ∗ V 0 β - - -0.15** 0.18** + M c1 (%point) 1 1 0.70 0.78 − M c1 (%point) -0.23 -0.24 -0.59 -0.60 V c1 0.19 γ -0.07 0.58*** -0.20 0.32*** ∗ S γ -0.16* 0.11 - - ∗ M γ 0.79*** -0.19 0.77*** -0.09 ∗ V γ - - 0.25** -0.10* M c1 (%point) 0.28 0.49 0.19 0.82 V c1 - - 0.28 0.19 748 820 748 820 Subscripts S, M, and V refer to magnitude (size), size, and volatility, respectively.
*** Significant at 1%; ** 5%; * 10%.
Size and volatility asymmetry
Results of a regression that includes factors for size and volatility asymmetry at the same time differ from those obtained from separate regressions with respect to the volatility asymmetry while the finding that bigger changes in the MMR induce faster adjustment appears to be robust (see Table 9). On the corporate loan market the parameters belonging to the size dummies are considerably higher than those of the volatility dummies, and are positive and significant even at the 1% level. The parameter that captures the difference of immediate adjustment between the more and less volatile periods is negative (-0.15) and significant at the 5% level, suggesting that when there is more uncertainty around the future evolvement of the MMR, banks are more reluctant to modify their interest rates. On the corporate deposit market we find significant and about 3.7 times faster immediate reaction of the interest rates for bigger changes in the MMR than for smaller ones while we could not find significant size asymmetry in the adjustment to the long-run equilibrium. At the same time, this adjustment appears to be significantly slower (only at the 10% level) in
more volatile periods, but immediate adjustment turn out to be faster when the MMR is more volatile.
6
Conclusions
In this paper we analyzed the interest rate pass-through in Hungary. First, we highlighted stylized facts of the markets for various loans and deposits. Second, we analyzed the adjustment of bank rates with econometric models. These models can capture important aspects of the adjustment, such as adjustment in the long-run, the speed of adjustment to the equilibrium and short-term responses.
Our results suggest a clear difference in the pricing of household and corporate instruments. In the case of corporate deposits and loans, both the degree and the speed of adjustment exhibit a stronger transmission than the corresponding household interest rates do. Corporate loans and deposits have higher long-term pass-through and faster short-term adjustment, which is also reflected in the significantly lower value of mean adjustment lag than in the case of the household loan and deposit markets. This result is probably due to the fact that in the corporate segment – in contrast with the household sector – competition is very intense. On the corporate market we found complete pass-through, while in the household segment the estimated long-run parameter turned out to be significantly lower than one. However, we were unable to reject the null of complete adjustment in case of the household loan rates, because of the very high standard errors arising form the short sample period. The adjustment of consumer credit interest rates proved to be exceptionally incomplete and slow, probably reflecting the low interest rate elasticity of loan demand and the high proportion of risk premium. Comparing our results with those of Árvai (1998) and Világi and Vincze (1995) the interest rate transmission has improved since the mid 1990s due to the improvement of macroeconomic and financial environment. Our results are in line with those of Crespo-Cuaresma et al. (2004), despite the different estimation method used and the different time-span of the data, who find complete pass-through for the short-term corporate loan rate and incomplete pass-through for the household deposit rates in Hungary.
European empirical studies conclude that short-term corporate loan rates adjust completely in the long run, although some studies have the opposite conclusion. Hence, corporate loan rates in Hungary behave similarly to other European countries’ loan rates, in terms of long term adjustment. Regarding the short-term adjustment of corporate loan rates, we find the Hungarian rates to adjust very fast; the recent ECB study (de Bondt, 2002) find the first period adjustment to be less than 50% for the EMU countries, whereas we estimated this adjustment parameter to be much higher, about 70%.
In contrast to the corporate loan rates, much less empirical studies analyze the adjustment of deposit rates and household loan rates. These few studies find that even the long term adjustment of these rates is very slow: ranges between 40-70%. Even so, consumer credit rates in Hungary are found to be more rigid in international comparison, at least with regard to the instant adjustment.
We analyzed the potential non-linearities of banks’ pricing with threshold ECM models. The results suggest that the speed of the pass-through of MMR changes to bank rates depends on the size of the changes in the MMR and, in particular for corporate loan rates, on the size of the distance of bank rates from their long-term equilibrium. We found the adjustment to be significantly faster for changes above a threshold level than for smaller ones and this finding appears to be robust to model specification. This phenomenon can be explained by the presence of menu costs. The sign of yield shocks also turned out to be
influential for the speed of adjustment. In line with international experience, we found that corporate loa