1 1
Learning from the Crowd:
Regression Discontinuity Estimates of the Effects
of an Online Review Database
*Accepted, The Economic Journal, 5 October 2011 Michael Anderson Jeremy Magruder
Abstract
Internet review forums increasingly supplement expert opinion and social networks in informing consumers about product quality. However, limited empirical evidence links digital word-of-mouth to purchasing decisions. We implement a regression discontinuity design to estimate the effect of positive Yelp.com ratings on restaurant reservation availability. An extra half-star rating causes restaurants to sell out 19 percentage points (49%) more frequently, with larger impacts when alternate information is more scarce. These returns suggest that restaurateurs face incentives to leave fake reviews, but a rich set of robustness checks confirm that restaurants do not manipulate ratings in a confounding, discontinuous manner.
Beliefs on product quality play an important role in shaping consumer demand. For many goods, consumers face ex ante uncertainty regarding the quality of the good and rely on imperfect signals to infer quality. Traditionally, expert opinion and social learning have helped consumers resolve these information asymmetries. For an expert’s take, consumers may consult Consumer Reports when buying an automobile or household appliance or they may read reviews by professional critics when selecting a movie or choosing among dining options. Alternatively, consumers may confer with peers who own the automobile or who have eaten at the restaurant. While friends and other social contacts may be less discriminating than professional critics, their tastes may be more similar to those of prospective consumers. Hoping to capitalise on this possibility, online sites that cheaply
* Corresponding author: Michael Anderson, [email protected], 207 Giannini Hall MC 3310, Berkeley, CA 94720-3310, USA. We gratefully acknowledge support from the Giannini Foundation of Agricultural Economics. We thank seminar participants at U.C. Berkeley and U.C. Davis for valuable comments. All errors in the paper are the authors’.
2 2
aggregate consumer reviews have recently expanded and have begun supplementing both of the traditional mechanisms.
Economists have recognised the potential of computers to enable large-scale distribution of consumer evaluations for some time (Avery et al., 1999). By reducing the cost of gathering and distributing information, the Internet facilitates social learning among a much broader peer group than has traditionally been possible. It enables lay reviewers to reach large audiences, a capability formerly restricted to professional reviewers. Consumer generated reviews now appear in a wide range of markets. For example, Yelp.com publishes customer reviews of local businesses, TripAdvisor.com publishes traveler reviews of hotels, Amazon.com publishes consumer reviews of products, and Netflix.com displays viewer ratings of movies. However, despite the theoretical potential of digital word-of-mouth to influence consumer choices, limited empirical evidence exists demonstrating its impact on purchasing decisions. In part this is due to the challenge of identifying causal effects of positive reviews on product demand (Angrist and Pischke, 2010). Products that receive positive reviews are ones that appeal to consumers, and these products would likely experience high sales even in the absence of positive reviews.
In this study we leverage a feature of the display system at Yelp.com to estimate the effect of positive Yelp ratings on restaurant customer flows. Yelp allows users to leave reviews of local businesses. As of July 2011, Yelp.com was the 34th most trafficked website in the United States and the 12th most trafficked website in the San Francisco area (the focus of our study), and its rank has been rising over time (Alexa Internet, 2011). When leaving a review on Yelp, a user must assign a rating from one to five stars in whole star increments. Yelp aggregates all reviews for a given business and displays the average rating prominently. However, when Yelp computes the average rating they round off to the nearest half star. Two restaurants that have similar average ratings can thus appear to be of very different quality. For example, a restaurant with an average rating of 3.24 displays a 3-star average rating while a restaurant with an average rating of 3.26 displays a 3.5-star average rating.
We recover the true underlying average rating for each restaurant and use this measure to implement a regression discontinuity (RD) design. We match the Yelp rating data to a database of restaurant reservation availability and estimate the impact of crossing each 0.5-star threshold on reservation availability. Our results indicate that Yelp ratings have
3 3
substantial effects on restaurant customer flows. These impacts appear largest for restaurants for which there is less information on quality available outside of Yelp.
Our estimates imply that restaurants face strong incentives to manipulate their Yelp ratings by leaving fake positive reviews. In principle this manipulation could invalidate the RD design if savvy restaurateurs heap directly above each Yelp rounding threshold; the assignment of restaurants to either side of the threshold would then no longer be quasi-random. However, we show that a restaurateur’s incentive to leave a fake review does not change discontinuously at the Yelp rounding threshold, and a rich set of robustness checks on the density of restaurants and on reviewer characteristics confirm that restaurants are not manipulating ratings in a manner that causes them to fall right above the Yelp rounding threshold.
We open this paper by summarizing the existing literature on consumer learning and discussing our data source, Yelp.com. We then introduce our empirical strategy and document the effect of an increase in Yelp’s displayed rating on the availability of tables at prime dining times. We discuss whether restaurants may attempt to manipulate their Yelp ratings and conduct a range of tests that share a common finding of no evidence of manipulation at thresholds. We then examine the mechanisms by which Yelp may be working and conclude by discussing the magnitude of our estimates.
1.
Background
A series of existing studies establish the importance of expert opinion and social learning in guiding consumer choices. Reinstein and Snyder (2005) find that positive reviews by professional movie critics increase box office revenue, and Hilger et al. (forthcoming) show that high scores on expert opinion labels increase demand for wines. Social learning, either through observation or word-of-mouth, also impacts consumer demand. Duflo and Saez (2002) and Sorensen (2006) show respectively that an employee’s retirement and health plan choices affect the retirement and health plan choices of other employees in the same academic department. Moretti (2011) finds that consumers appear to update their beliefs about a movie’s quality based on feedback from peers who have already seen the movie. Cai et al. (2009) show that customers that receive information about a restaurant’s most popular dishes tend to order those dishes.
4 4
Online review databases have recently supplemented expert opinion and social learning as a source of information regarding product quality. These databases allow volunteer reviewers to reach large audiences, but it has proven difficult to estimate their effects on consumer demand. A series of experimental and quasi-experimental studies establish the impact of eBay seller ratings on eBay bidder behavior. They find that sellers with better ratings attract more bids or experience higher auction prices (Melnik and Alm, 2002; Jin and Kato, 2006; Resnick et al., 2006; Lucking-Reiley et al., 2007; Cabral and Hortaçsu, 2010). These papers demonstrate that online reviews impact bidder behavior when every bidder observes a seller’s average rating and bidders have limited recourse in the event of fraud and no other information about sellers. However, they do not indicate whether reviews can affect consumer behavior in established markets in which consumers can draw information from expert opinion, word-of-mouth, or other signals. A single quasi-experimental study, Chevalier and Mayzlin (2006), examines the effect of customer reviews on sales rankings of books at Amazon.com and Barnesandnoble.com (bn.com). It finds that a book that has better reviews on Amazon.com than it does on bn.com tends to sell better on Amazon.com than it does on bn.com.1
This paper builds upon the existing literature on digital word-of-mouth in several respects. First, it examines an established market in which professional reviewers and social learning already play important roles. Second, it employs a regression discontinuity design to estimate the causal effects of positive reviews in a non-experimental setting. Finally, it presents a set of empirical tests for detecting gaming in crowd-sourced online review systems.2
1 In concurrent but independent work Luca (2011) examines the effect of Yelp.com ratings on restaurant revenues. Our studies differ in data, context, and methods. In comparison to our study, Luca has quarterly data on revenues while we have daily data on reservation availability. His sample focuses on Seattle, a city with low Yelp.com usage in comparison to San Francisco (the focus of our study), and covers 2006 to 2009, a period with low Yelp.com usage (in comparison to 2010). In contrast to our empirical models, the majority of his results rely on fixed effects estimates that are identified off of changes in average review quality over time. He also conducts statistical inference under the assumption that repeated observations of the same restaurants over time are statistically independent. Both of these choices may increase statistical precision, but they come at the cost of assuming no serial correlation in revenues over time and assuming that changes in review quality are uncorrelated with changes in restaurant quality. In contrast, our paper relies exclusively on RD estimates, and we cluster our standard errors by restaurant, as is customary in the modern panel data literature (Bertrand et al.,
2004).
2 These tests are most applicable to websites that display average ratings in discrete increments. Other examples of websites that display average ratings in half-unit increments are Amazon.com, Barnesandnoble.com, Target.com, and TripAdvisor.com.
5 5
2.
Data
To estimate the effect of Yelp ratings on restaurant reservation availability we merge two independent data sources. The first data set consists of the universe of Yelp reviews for restaurants in San Francisco, California as of February 2011. The second data set consists of reservation availability data taken from a large online restaurant reservation website from July 2010 through October 2010. We focus on San Francisco because it has much higher Yelp usage (measured in terms of numbers of reviews left) than any other city in the United States. As of March 1, 2010, the average restaurant in San Francisco had over three times as many Yelp reviews as the average restaurant in Boston, the city with the highest Yelp usage outside of the San Francisco Bay Area.3 The level of Yelp usage in San Francisco today, however, is likely representative of the level of Yelp usage that other cities may experience in several years. From 2005 to 2009, Yelp usage grew at an average rate of 70% per year across 10 major U.S. cities (Austin, Boston, Chicago, Los Angeles, Las Vegas, New York, San José, San Diego, Seattle, and Washington DC).
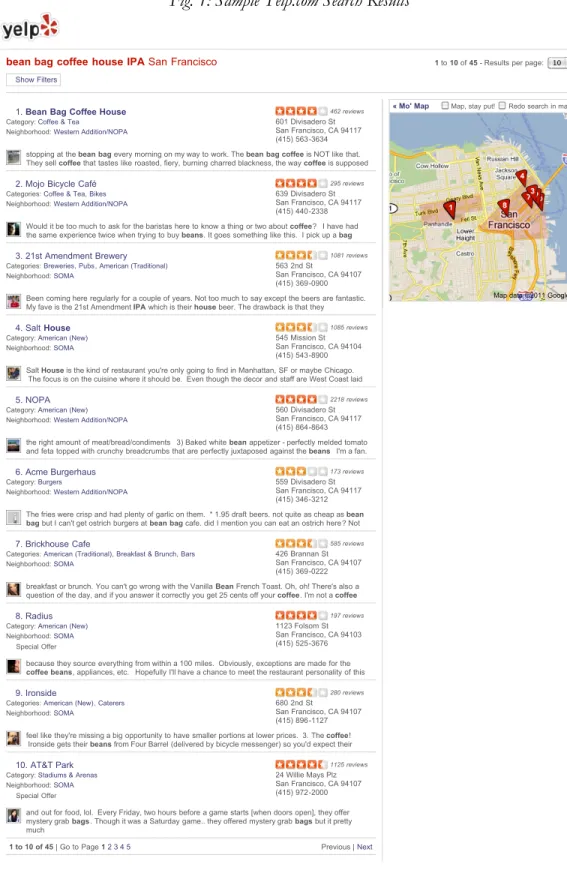
When a user browses or searches Yelp.com, Yelp presents her with a list of businesses that meet her search criteria or fall within the category of interest. Figure 1 reproduces a sample search on Yelp.com. Businesses are sorted according to relevance and rating, and for each business the average rating is prominently displayed, rounded to the nearest half star. The number of stars in the average rating is easily visible, particularly because the colour of the stars changes at whole star thresholds. Contact information for the business and a short excerpt from one review are also displayed.
When clicking on an individual business, Yelp.com displays the entire history of reviews for that business. We downloaded this history for each restaurant on Yelp.com and recorded the date of the review, the rating assigned (1–5), and the reviewer’s unique user identifier. We then reconstructed the average rating and total number of reviews for each restaurant at every point in time. We accounted for updated reviews when constructing the
3 The average reviewed restaurant in San Francisco had 137 reviews while the average reviewed restaurant in the city with the second highest Yelp usage, San Jose, had 57 reviews. Boston averaged 44 Yelp reviews per reviewed restaurant. Chicago, Los Angeles, San Diego, Seattle, and Washington, DC all averaged between 30 and 40 Yelp reviews per reviewed restaurant. Ideally we would observe Yelp page views for each city, but to our knowledge these data are not available. We thus use review activity as a proxy for general Yelp usage.
6 6
average rating but did not classify them as new reviews when calculating the total number of reviews.4
We augment the Yelp data with reservation availability data from a large online reservation website. This website lists real-time reservation availability for hundreds of restaurants in San Francisco. From July 21, 2010 to October 29, 2010 we recorded reservation availability for a party of four on Thursday, Friday, and Saturday evenings. We checked availability at 6 pm, 7 pm, and 8 pm. Availability was measured approximately 36 hours prior to the time of the desired reservation. We merged the reservation availability dataset to the Yelp dataset using restaurant phone numbers. When this method failed or generated duplicate merges, we manually checked for the correct merge.
Table 1 presents summary statistics for two samples. The first sample contains all San Francisco restaurants on Yelp as of January 2011. The second sample contains the subset of San Francisco restaurants that were also listed on the online reservations website during Fall 2010. The full sample contains 3,953 restaurants, while the subsample with reservation data contains 328 restaurants. The average reviewer’s rating is approximately 3.7 in both samples. The average restaurant’s rating is 3.50 in the full sample and 3.64 in the subsample with reservation data. Restaurants listed on the online reservations website have substantially more reviews than the average restaurant (452.1 versus 167.9) and received more reviews during the study period (9.2 per month versus 5.5 per month). Reservation availability averaged 74% at 6 pm, 59% at 7 pm, and 68% at 8 pm.
Both the full sample and the subsample represent selected samples. The full sample only contains restaurants with at least one Yelp review while the subsample only contains restaurants listed on the online reservations website. The latter selection criterion is the one most relevant to our estimates, particularly since virtually all restaurants on the reservations website have at least one Yelp review. If the choice to join the online reservations website is influenced by customer flows, then our RD estimates of the effect of Yelp ratings could be attenuated. The direction of the bias is unaffected by whether joining the online reservations website is positively or negatively related to customer flows.5 However, the bias will only
4 If a review is updated once, we observe the original assigned rating and the current rating. If a review is updated two or more times, we only observe the current rating and the rating prior to the current rating. Reviews that are updated two or more times constitute only 0.2% of all reviews.
5 First consider the case in which joining the reservations website is positively affected by customer flows. In that case restaurants on the margin of joining the reservations website will join when they lie above a Yelp
7 7
arise if Yelp ratings have a causal effect on customer flows. We thus interpret our estimates as lower bounds on the effect of Yelp ratings for restaurants that participate in the online reservation service.
Finally, while Yelp usage is high, not all restaurant patrons use Yelp. Only those who consult Yelp should be affected by Yelp’s ratings, so any effects of Yelp on availability can be attributed to this fraction of consumers. If Yelp usage continues to expand in the future, we may reasonably expect Yelp ratings to become more important to restaurant availability than our estimates indicate.
3.
Empirical Model and Results
We use a regression discontinuity estimator to estimate the effect of Yelp. Specifically, we estimate
!!" =!+!∗!"!"+!" !!" +!!" (1)
where !!" is an indicator for the availability of a reservation for a party of four at a particular
hour in restaurant!! on date !, !"!" is the rating that Yelp displays next to the restaurant’s name, and !!" is the actual average rating of reviews left for that restaurant. Identification in a regression discontinuity model is achieved through assuming that the underlying, potentially endogenous relationship between review quality and restaurant quality is fully captured by the flexible function !(∙), and that this relationship does not vary discontinuously at the RD threshold values. Our case is a sharp regression discontinuity, so that !"!" is a step function of the actual rating, !!". Restaurants with ratings of at least 2.75 but less than 3.25 have a display rating of 3 stars, restaurants with ratings of at least 3.25 but less than 3.75 have a display rating of 3.5 stars, and so on for each half-star.
rounding threshold and not join when they lie below a Yelp rounding threshold. This reduces the average customer flows of restaurants lying above a Yelp rounding threshold because marginal restaurants have lower customer flows than the average restaurant that joins. The RD estimate is thus attenuated. Now consider the case in which joining the reservations website is negatively affected by customer flows. In that case restaurants on the margin of joining the reservations website will join when they lie below a Yelp rounding threshold and not join when they lie above a Yelp rounding threshold. This increases the average customer flows of restaurants lying below a Yelp rounding threshold because marginal restaurants have higher customer flows than the average restaurant that joins. The RD estimate is again attenuated.
8 8
To estimate this model, we follow Imbens and Lemieux (2008). At each half-star threshold !, we restrict the sample to restaurants within some bandwidth of that threshold, normalise !!! by the threshold value so that !!" = !!"−!, and regress
!
!!" =!+!∗! !!" >! +!!∗!!" +!!∗!!"∗! !!" > ! +!!" (2) where ! ∙ represents the indicator function. Our baseline results use a pooled sample with a bandwidth of 0.25 points; in alternate results we vary the bandwidth and examine each threshold individually.
3.1 Baseline RD Results
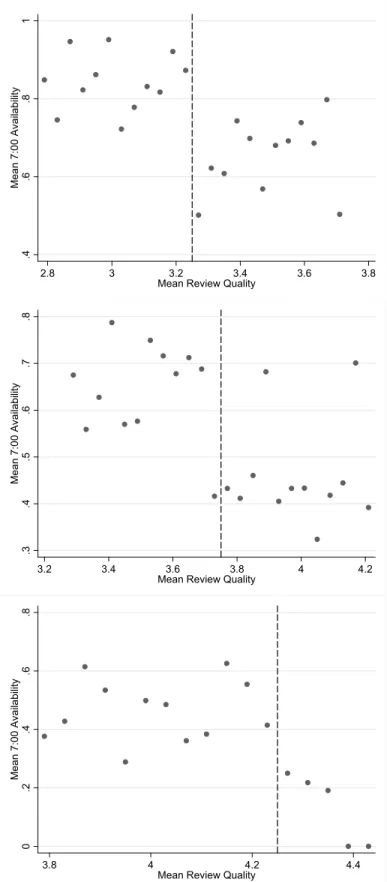
Figure 2 plots mean 7:00 pm reservation availability by Yelp rating. Panel A focuses on the window where restaurants have either 3 or 3.5 stars; Panel B focuses on the window where restaurants have either 3.5 or 4 stars, and Panel C focuses on the window where restaurants have 4 or 4.5 stars. There are clear jumps in the mean availability at 3.5 and 4 stars, and potentially one at 4.5 stars as well. Moving from 3 to 3.5 stars reduces the likelihood of availability from about 90% to 70%. A fourth star reduces the likelihood of availability further to 45%, and that possibility drops to 20% at 4.5 stars. Interestingly, for the most part it appears that a step function is a good approximation to the overall relationship between Yelp ratings and restaurant availability. That is, restaurant availability appears to respond primarily to the displayed rating, and not the latent average review score. Though we have too few restaurants with displayed ratings of 2.5 to be confident in results at the threshold for three stars, it is worth noting that we could make a 7:00 pm reservation at these seven restaurants 97.5% of the time over our study.
Close inspection of the center panel in Figure 2 reveals that the drop in reservation availability occurs several hundredths of a point before the 4-star threshold (at the bin centered at 3.73 instead of the bin centered at 3.77). This deviation is not surprising as restaurants’ average ratings drift over time. A restaurant currently just below the threshold is thus likely to have been above the threshold in the preceding months. If the restaurant is better than average, as restaurants near the 4-star threshold are, then time spent above the threshold in previous periods may increase current customer flows – diners attracted by the
9 9
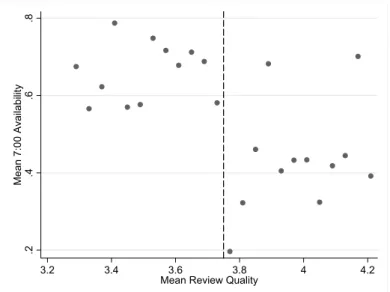
previous 4-star rating may become repeat customers.6 To test this hypothesis, Figure 3 plots reservation availability for a sample that drops restaurants that have spent the majority of the preceding year on the opposite side of the 4-star threshold. The figure becomes noisier due to the reduced sample size, but the drop in reservation availability now exactly aligns with the 4-star threshold.
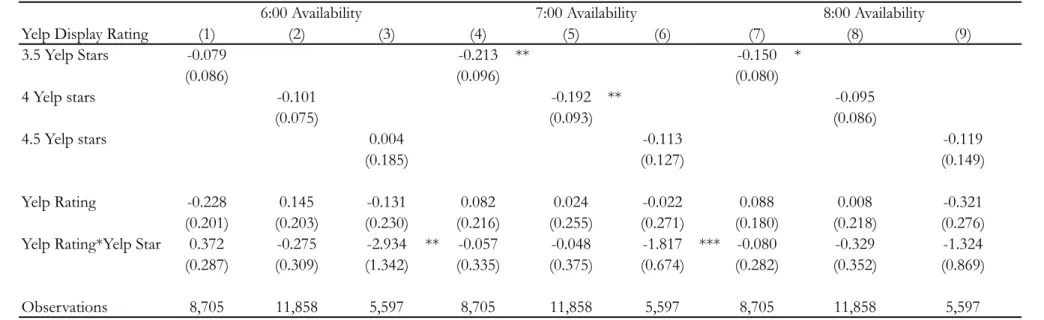
Table 2 presents the regression analog of Figure 2, estimating equation (2) above. At each threshold, we estimate the probability of being able to make an online reservation 36 hours in advance for table times at six, seven, and eight o’clock. Estimates of the effect of Yelp on 6:00 pm availability are not significant, though the point estimates suggest that there is about a 10% reduction in 6:00 pm availability at the three and a half and four star thresholds. The seven o’clock estimates are more significant. Here, moving from three to three and a half stars is associated with being 21 percentage points more likely to have sold out all 7:00 pm tables, and moving from three and a half to four stars makes restaurants an additional 19 percentage points more likely to have sold out all tables. Eight o’clock loses some significance, but the three and a half star threshold is still marginally significant (and estimates are similar in magnitude to the 6:00 pm threshold). A 19 or 21 percentage point change in availability is a large effect; in Section 5 we explore the likely profit implications of this average change. Moreover, this 20 percentage point effect can be ascribed to the subsample of restaurant patrons who use Yelp: if this sample continues to increase in the future we may anticipate that estimated effects will become even larger.
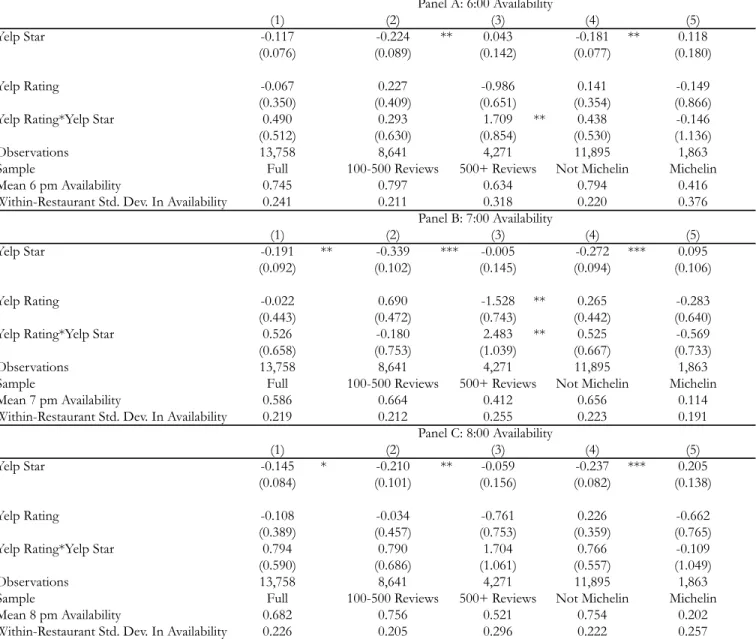
Given the similarity of estimates across the 3.5 and 4-star thresholds, we pool all thresholds for a more detailed analysis in our primary results, presented in Table 3. Column (1) repeats Table 2’s analysis on the pooled sample. Panel A examines the likelihood of being able to make a 6:00 pm reservation while Panels B and C examine 7:00 pm and 8:00 pm reservations respectively. Consistent with Table 2, column (1) indicates that an extra half-star on Yelp makes restaurants sell out their 6:00 pm tables 11 percentage points more frequently, their 7:00 pm tables 19 percentage points more frequently, and their 8:00 pm tables 15 percentage points more frequently, though only the 7:00 pm result is significant at
6 A similar pattern seems less likely at the 3.5-star threshold. Restaurants near the 3.5-star threshold are below-average restaurants, so diners attracted by the 3.5-star rating are unlikely to become repeat customers. We thus expect, and observe, no drop in reservation availability before the 3.5-star threshold.
1 0 10
the 5% level (the 8:00 pm effect is marginally significant, as well). These results are not sensitive to reasonable changes in bandwidth.7
3.2 RD Results by Restaurant Type
Columns (2) through (5) of Table 3 investigate heterogeneity between restaurants. If Yelp is providing information about new restaurants, that information should be most valuable among restaurants that are unfamiliar to patrons. We divide restaurants into familiar/unfamiliar groupings along two dimensions. First, restaurants with fewer than 500 reviews are likely to be less frequented and less well known than those with more than 500 reviews. Since the Yelp signal does not present a reliable average for firms with very few reviews (and manipulating average review quality may be more feasible for these restaurants), we investigate only the restaurants with at least 100 reviews (though the results are similar if we include restaurants with less than 100 reviews as well). Column (2) examines these less familiar restaurants and finds larger, statistically significant effects at all thresholds. For restaurants with fewer than 500 reviews, an extra half-star on Yelp reduces reservation availability by 20 to 30 percentage points at all three times. In contrast, for restaurants with more than 500 reviews, for whom there is likely less hidden information about quality, there is no discontinuous change at any threshold associated with additional Yelp stars. The difference in these two coefficients (at 7 pm) is statistically significant at the 10% level. Nevertheless, restaurants with more than 500 reviews differ from those with fewer than 500 reviews along several dimensions, including mean reservation availability. If restaurants with many reviews were always sold out or always had excess capacity, then it would be difficult for Yelp to affect reservation availability. However, the within-restaurant standard deviation in reservation availability is at least as large in the over 500 review subsample as it is in the under 500 review subsample, suggesting that more restaurants in the over 500 review subsample are on the margin of selling out (and thus could be affected by Yelp).
Of course, Yelp’s signal is also more precise for restaurants with more reviews. Under Bayesian updating, one might therefore expect that Yelp’s impact should be
7 We estimate the 7:00 pm availability RD coefficient for every bandwidth between 0.10 Yelp stars and 0.25 Yelp stars. The RD coefficient lies between 19 percentage points and 27 percentage points for all bandwidths from 0.13 Yelp stars to 0.25 Yelp stars. Only at bandwidths of 0.12 Yelp stars or less does the RD coefficient fall below 19 percentage points.
1 1 11
increasing in the number of reviews. In practice, however, the signal’s precision should not generate meaningful heterogeneity in our estimates. This is because almost all restaurants in our data (94%) have 100 or more reviews, and the signal’s precision is already very high when a restaurant reaches 100 reviews. For example, when comparing a 4-star restaurant with 100 reviews to a 3.5-star restaurant with 100 reviews, a consumer can be 98% confident that the 4-star restaurant’s true average rating (i.e., the probability limit of the sample average rating) dominates the 3.5-star restaurant’s true average rating. It is thus unsurprising that consumer response is not increasing in the number of Yelp reviews.
A second test for whether the Yelp effect is due to solving information problems groups restaurants according to whether there are external sources of quality information. Here, we note that quality information is easily available for restaurants which have a Michelin star8 or those which appear in the San Francisco Chronicle’s annual Top 100 Restaurants listing. In contrast, crowd-sourced information may be more important for restaurants excluded from these prestigious rankings. Columns (4) and (5) of Table 3 perform the RD analysis on these split samples, and again find that an extra half-star on Yelp reduces reservation availability by 20 to 30 percentage points at all three times for restaurants without external recognition but that the Yelp ranking does not similarly advantage restaurants which have been externally accredited. The difference between the two coefficients (at 7 pm) is statistically significant at the 1% level. The scope for reductions in reservation availability at externally accredited restaurants is limited at 7 pm (when mean reservation availability is 11.4%), but similar patterns emerge at 6 pm when mean reservation availability is much higher at these restaurants (41.6%). These heterogeneity results are consistent with the hypothesis that Yelp is most valuable when there is less external information about restaurants, though other differences between the two groups of restaurants may also play some role.
Taken together, the RD analysis suggests that restaurants are more likely to sell out at prime dinner times by a large margin: each extra half star is associated with selling out 20 percentage points more frequently. This effect is strongest where quality information would
8 Here, restaurants that received a Michelin star in either 2009 or 2010 are considered to be Michelin star restaurants. There are 42 restaurants in our sample that received a Michelin star or were listed in the Chronicle
Top 100 Restaurants (there is significant overlap between these two categories). The Chronicle Top 100 list applies to the entire San Francisco Bay Area metropolitan area rather than the city of San Francisco, which is why only a minority of restaurants on the list appear in our data.
1 2 12
be most useful, suggesting that Yelp is helping consumers learn about potential new restaurants.
3.3 Dynamic RD Results
Given that Yelp ratings appear to influence customer demand, it is possible that crossing a Yelp threshold may affect the future trajectory of a restaurant’s average Yelp rating itself. There are two reasons why crossing a Yelp threshold might affect the stream of incoming Yelp reviews. First, restaurants could adjust their prices, food, or service in response to increased customer demand, though results presented in Section 5 suggest that they do not. Second, the marginal customer attracted by a better Yelp rating is likely to be a new customer, and she may be more or less critical of a restaurant in expectation than the average existing customer. If there are enough new customers, and if their preferences are sufficiently different from existing customers, then crossing a Yelp threshold could change the trajectory of a restaurant’s average Yelp rating. For example, if new customers tend to be less critical than existing customers, then the average rating will demonstrate “stickiness” after crossing a Yelp threshold. If new customers tend to be more critical than existing customers, then the average rating will demonstrate “reversion” after crossing a Yelp threshold.
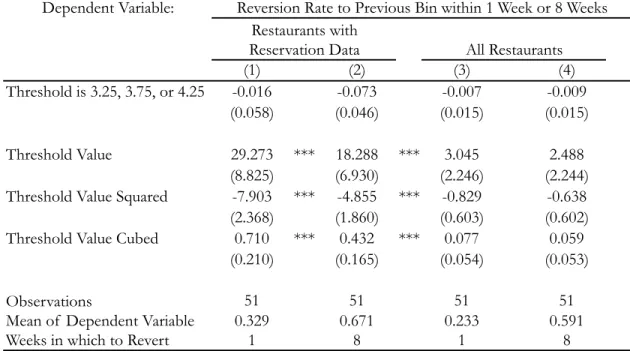
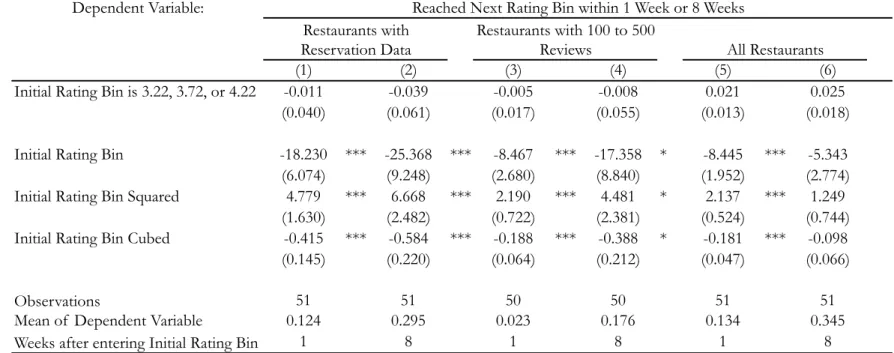
We empirically test whether crossing a Yelp threshold has an impact on future Yelp ratings by measuring whether a restaurant’s average Yelp rating is more or less “sticky” after the restaurant crosses a Yelp threshold. To implement this test, we construct a two year panel of average Yelp ratings running from January 2009 to January 2011. We define disjoint bins of width 0.03 stars, placed such that all three Yelp thresholds in our data (3.25, 3.75, and 4.25) lie at bin borders.9 This results in 51 bins from 3.01 stars to 4.49 stars. Three of these bins represent “true” Yelp thresholds (3.25, 3.75, and 4.25 – we refer to bins using their left boundaries), and 48 of them represent “placebo” Yelp thresholds. For each bin we calculate the “reversion rate” to the previous bin within a given number of weeks. For example, an 8 week reversion rate of 0.67 for the 3.22 bin implies that when a restaurant’s
9 For example, the 17 bins surrounding the 3.25 star Yelp threshold have the following borders: 3.01, 3.04, 3.07, 3.10, 3.13, 3.16, 3.19, 3.22, 3.25, 3.28, 3.31, 3.34, 3.37, 3.40, 3.43, 3.46, 3.49.
1 3 13
average rating crosses into the 3.22 bin from below, 67% of the time it crosses back into the 3.19 bin at some point within the next 8 weeks.
Table 4 presents results on the effects of crossing a Yelp threshold on future Yelp ratings. In each column, we regress the bin-level reversion rate on an indicator for whether a threshold represents a true Yelp threshold and a cubic in the value of the threshold.10 Column (1) indicates that the 1 week reversion rate is 1.6 percentage points lower for true Yelp thresholds than for placebo Yelp thresholds. This difference is statistically insignificant and represents 4.9% of the average 1 week reversion rate. Column (2) indicates that the 8 week reversion rate is also not statistically different at true Yelp thresholds than at placebo Yelp thresholds.11 To increase precision, Columns (3) and (4) estimate the same regressions on a larger sample containing all Yelp restaurants with 20 or more reviews (not just restaurants in the reservations database). Although the number of bins in the regression is unchanged, the standard errors drop substantially because the number of underlying restaurants increases from 328 to 2,591. In both columns, the reversion rate is not statistically different at true Yelp thresholds than at placebo Yelp thresholds. Overall there is no evidence that crossing a Yelp threshold has any significant impact on future Yelp ratings. This suggests that restaurants do not significantly alter their prices, food, or service in response to crossing a Yelp threshold and that new customers do not leave markedly different ratings than existing customers.
4.
Robustness
Identification in the RD model relies on the assumption that potential confounders do not change discontinuously at the RD threshold. In general this assumption is satisfied because units (restaurants) just above the threshold should not differ systematically from units just below the threshold. However, this assumption may fail if restaurants are able to precisely manipulate their location relative to the threshold. In that case, specific types of restaurants, manipulators, may locate directly above the threshold. This can generate bias if these types of restaurants also have higher or lower sell-out rates than other restaurants near
10 Controlling for the cubic of the threshold value does not affect the coefficient of interest but substantially improves the regression’s precision.
11 These estimates remain statistically insignificant if we vary the reversion window length (from 1 to 8 weeks) or double the bin width (from 0.03 to 0.06).
1 4 14
the threshold. Manipulation is feasible in this context because Yelp is crowd-sourced – any restaurateur can in principle leave himself a 5-star review. Furthermore, the significant increases in business at Yelp thresholds create a strong incentive for restaurants to attempt to manipulate their ratings to fall above a threshold.
Yelp attempts to prevent this behavior through several mechanisms. They require potential reviewers to create an account (preventing automated programs from entering many positive reviews), and they engage in filtering behavior that excludes reviews from less established reviewers. Yelp is intentionally vague on the operation of their filtering process in order to keep business-owners from finding loopholes. However, it is likely that some restaurateurs defeat the Yelp filtering process, and this is a challenge to identification that we take very seriously.12
Important to our efforts is considering how this manipulation behavior interacts with a regression discontinuity design. If all restaurateurs manipulate their reviews to the greatest extent possible, then the distribution of average ratings will simply shift rightward. Similarly, if restaurateurs near Yelp thresholds attempt to manipulate their average ratings, but they do so on both sides of the threshold, then the density of manipulators will remain continuous across Yelp thresholds. In either case this manipulation behavior will not bias our estimates because the types of restaurants on either side of the threshold will remain comparable to each other. However, if restaurants which are just under the threshold leave a number of self-promoting reviews to get over the threshold, while restaurants that are just over the threshold do not engage in manipulation, then that could create a selection problem at the threshold which would generate biased estimates.
In the appendix we show through a short theoretical model that the incentives to manipulate Yelp ratings are continuous across thresholds. The intuition is simple: given that a random stream of reviews will change each restaurant’s average rating over any time period, a restaurant which is just above a threshold has a very similar likelihood of just missing that threshold after new reviews come in as a restaurant which is just below the threshold. Both restaurants therefore face similar incentives to try and push their Yelp scores into safer territory. Thus, while restaurants have strong incentives to manipulate ratings,
12 Continually leaving fake reviews to combat new incoming reviews would quickly grow tedious. More realistically, a restaurateur might outsource the generation of large numbers of fake reviews to another individual or firm. Wang (2010) discusses the strategies that Yelp uses to limit low quality reviews (e.g., “ranting and raving”) and marginalise fake reviewers.
1 5 15
these incentives do not change sharply at Yelp thresholds. This implies that the density of restaurants should be smooth across Yelp thresholds; manipulators should not pile up directly above thresholds.
Of course, restaurateurs may behave in a manner inconsistent with profit maximization for a variety of behavioral reasons, and so we present a variety of empirical tests that consistently show no evidence of any discontinuous manipulation at the threshold. Note, however, that gaming behavior would not intuitively generate the observed reduction in reservation availability at Yelp thresholds. If gaming occurs discontinuously at thresholds, then a subset of restaurants above the thresholds have “true” Yelp ratings that are lower than their observed Yelp ratings. To generate a significant drop in reservation availability at the threshold, these restaurants must sell out virtually all the time, despite the fact that they receive relatively low ratings from true Yelp reviewers. It seems ex ante surprising that a restaurant that receives poor reviews would be extremely crowded, though it is theoretically possible.13
4.1 Empirical Tests for Evidence of Gaming
Our first set of tests checks for discontinuities at Yelp thresholds in the density of average ratings or in review and reviewer characteristics. If restaurateurs leave additional fake reviews when they are right below Yelp thresholds in order to cross the threshold, then more restaurants should fall just above Yelp thresholds than fall just below them. Figure 4 presents graphical evidence that there is no break in the density of restaurants at Yelp thresholds. The figure plots a histogram of observations (restaurant-days) against mean review quality (normalised so that zero corresponds to the nearest Yelp threshold). There is no visually perceptible break in the frequency of observations at zero.
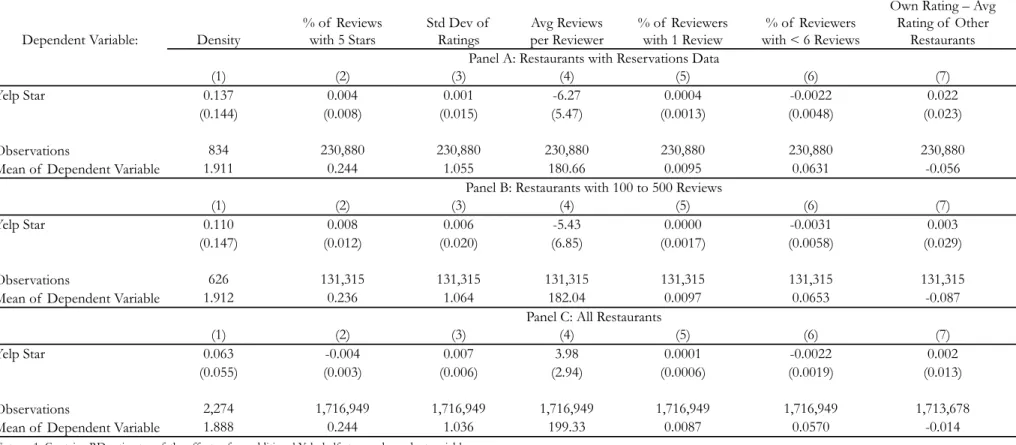
Discontinuous gaming behavior also implies that the characteristics of reviews and reviewers should change sharply at Yelp thresholds – there should be more 5-star reviews and fewer reviews per reviewer above Yelp thresholds. Table 5 presents regression discontinuity estimates of the effect of crossing a Yelp threshold on the density of average
13 For example, perhaps restaurateurs who manipulate Yelp ratings are excellent marketers in general. If so, they may be able to attract many customers to their restaurants despite offering relatively poor food and service.
1 6 16
ratings and review and reviewer characteristics. In this table (and Tables 6 and 7), we present specifications that expand the estimation sample along both the time and restaurant dimensions. These expansions greatly improve the precision of our falsification tests and are possible because we are no longer constrained to examining dates and restaurants for which we have reservation availability data. In this sense we stack the deck against ourselves – we employ much greater precision in our falsification tests than we could employ in our main regressions. If we employ the same tests in the subsample with reservation availability data, we reach similar conclusions for all tests.
Panel A of Table 5 uses a two year panel of average Yelp ratings running from January 2009 to January 2011; the level of observation is the restaurant-day. The two year panel increases the number of observations relative to our reservation availability regressions, but our results remain insignificant if we limit the sample to the dates for which we have reservations data.14 Panel B restricts the sample to restaurants with 100 to 500 reviews. These restaurants face stronger incentives to game – they benefit the most from crossing Yelp thresholds (see Table 3) and they have better control over their average ratings than restaurants with more than 500 reviews. For maximum precision, Panel C uses a sample containing all Yelp restaurants with 20 or more reviews from January 2009 to January 2011.
Column (1) implements the McCrary (2008) test for discontinuities in the density of the running variable (the regression version of Figure 4). We modify the test to accommodate panel data by using a cluster bootstrap to estimate the standard errors; each restaurant represents a single cluster (Cameron et al., 2008). The coefficient of 0.137 is statistically insignificant and represents 8.1% of the level of the density just above the Yelp threshold. The estimated change in the sample containing restaurants with 100 to 500 reviews, reported in Panel B, is 0.110 points (6.5% of the level of the density just above the Yelp threshold). The estimated change in the sample containing all Yelp restaurants, reported in Panel C, is 0.063 points (3.5% of the level of the density just above the Yelp threshold). All estimates are statistically insignificant.
14 The results in Table 5 remain statistically insignificant if we limit the sample to dates for which we have reservations data. However, the number of observations drops from 230,880 to 31,657, so the standard errors increase (see Appendix Table A1). There are also no statistically significant coefficients if we individually examine each Yelp threshold – 3.25, 3.75, and 4.25 – rather than pooling all three Yelp thresholds together (see Appendix Table A2).
1 7 17
The density estimates allow us to compute bounds on the potential bias from gaming. Consider the worst-case scenario regarding reservation availability: every restaurant that games its way over the threshold has zero reservation availability. The estimate in Panel A implies that there are 8.1% fewer restaurants below the threshold than above the threshold. Suppose that this imbalance represents a true effect of gaming despite being statistically insignificant. To achieve a smooth density across the threshold, we must reassign 4% of restaurants above the threshold to be below the threshold. In the worst-case scenario, all of these reassigned restaurants have zero availability. The reassignment under this scenario increases 7:00 pm availability above the threshold from 39% to 40.6% and reduces 7:00 pm availability below the threshold from 58% to 55.6%.15 The estimated difference in 7:00 pm availability thus drops from 19.1 percentage points to 15.0 percentage points. This result would be marginally significant using the standard error in column (1) of Table 3. The estimate in Panel B implies that there are 6.5% fewer restaurants below the threshold than above the threshold. To achieve a smooth density across the threshold, we must reassign 3.2% of restaurants above the threshold to be below the threshold. In the worst-case scenario, this reassignment increases 7:00 pm availability above the threshold from 45% to 46.5% and reduces 7:00 pm availability below the threshold from 79% to 76.4%.16 The estimated difference in 7:00 pm availability thus drops from 33.9 percentage points to 29.9 percentage points, which would still be statistically significant using the standard error in column (2) of Table 3. Even under worst-case assumptions, gaming behavior can only explain a small fraction of the observed changes in reservation availability at Yelp thresholds. Columns (2) through (7) of Table 5 report the effects of crossing a Yelp threshold on review and reviewer characteristics. The regressions in these columns correspond to
15 Normalise the number of restaurants near the threshold to 200. Initially, there are 104.2 restaurants above the threshold and 95.8 restaurants below the threshold (95.8/104.2 = 0.919, so there are 8.1% fewer restaurants below the threshold than above). We must reassign 4.2 restaurants (i.e., 4% of 104.2) from above to below to regain balance across the threshold. Observed reservation availability in our data is 39% = 40.6/104.2 above the threshold and 58% = 55.6/95.8 below the threshold. Reassigning 4.2 restaurants with no availability from above the threshold to below the threshold changes reservation availability to 40.6/(104.2 – 4.2) = 40.6/100 = 40.6% above the threshold and 55.6/(95.8 + 4.2) = 55.6/100 = 55.6% below the threshold.
16 Normalise the number of restaurants near the threshold to 200. Initially, there are 103.3 restaurants above the threshold and 96.7 restaurants below the threshold (96.7/103.3 = 0.936, so there are 6.4% fewer restaurants below the threshold than above). We must reassign 3.3 restaurants (i.e., 3.2% of 103.3) from above to below to regain balance across the threshold. Observed reservation availability in our data is 45% = 46.5/103.3 above the threshold and 79% = 76.4/96.7 below the threshold. Reassigning 3.3 restaurants with no availability from above the threshold to below the threshold changes reservation availability to 46.5/(103.3 – 3.3) = 46.5/100 = 46.5% above the threshold and 76.4/(96.7 + 3.3) = 76.4/100 = 76.4% below the threshold.
1 8 18
equation (2), but the dependent variable has been replaced with a review or reviewer characteristic.17 Column (2) examines the share of reviews that are 5-stars, as the benefit of a fake review will be minimal or negative if it is not 5-stars. The results indicate that there is a 0.4 percentage point increase in a restaurant’s share of reviews that are 5-stars at the Yelp threshold. This result is statistically insignificant and represents 1.6% of the average share of reviews that are 5-stars. The equivalent estimates for the 100 to 500 reviews sample and the full sample of Yelp restaurants are 0.8 and –0.4 percentage points respectively and are also statistically insignificant.
Column (3) examines the standard deviation of a restaurant’s ratings. Restaurants that receive negative reviews may choose to offset these negative reviews by leaving fake 5-star reviews. Alternatively, restaurants that leave many fake 5-5-star reviews should experience a substantial gap between their observed average ratings and the average ratings left by true reviewers. In either case, the dispersion of a restaurant’s ratings will be high if it chooses to game. The results, however, indicate that the standard deviation of a restaurant’s ratings increases by only 0.001 stars at the Yelp threshold. This change is statistically insignificant and represents 0.1% of the average standard deviation of a restaurant’s ratings. The equivalent estimates for the 100 to 500 reviews sample and the full sample of Yelp restaurants are also small and statistically insignificant.
Columns (4) through (6) examine the number of reviews per reviewer. Generating fake reviews takes time, so a restaurateur would prefer not to fill an account with fake reviews that do not impact his own restaurant’s rating. Column (4) indicates that the average reviewer has 6.3 fewer reviews associated with his account at restaurants just above a Yelp threshold. This difference is statistically insignificant and represents 3.5% of the average number of reviews per reviewer account. The equivalent estimates for the 100 to 500 reviews sample and the full sample are 5.4 fewer and 4.0 additional reviews respectively and are also statistically insignificant. Column (5) indicates that the share of reviewers who have only one review associated with their accounts is 0.04 percentage points higher at restaurants just above a Yelp threshold, while column (6) indicates that the share of reviewers who have five
17 In these regressions we include the raw level of a restaurant’s average Yelp rating – i.e., the version of the running variable that has not been normalised around the closest Yelp threshold – in addition to the normalised running variable that equals 0 at the closest Yelp threshold. Including the raw level of a restaurant’s average Yelp rating has little impact on the coefficients but dramatically increases the precision in cases in which the average Yelp rating is highly predictive of the dependent variable (the resulting regression thus has a high R2 and low MSE).
1 9 19
or less reviews associated with their account is 0.22 percentage points lower at restaurants just above a Yelp thresholds. These differences are statistically insignificant and represent 4.2% and 3.5% of the respective average shares. The estimates for the 100 to 500 reviews sample and the full sample of restaurants are also small and insignificant.
Column (7) examines the difference between a reviewer’s rating for a given restaurant and the average rating that the same reviewer leaves at other San Francisco restaurants. A restaurateur who wishes to maximise the return on each fake Yelp account should leave a positive review of his own restaurant and negative reviews of competing restaurants. Column (7) thus tests whether !!"−!! changes discontinuously as restaurant i’s average rating crosses a Yelp threshold, where !!" is the rating of restaurant i left by reviewer
j and !! is reviewer j’s average rating of other restaurants.18 The estimates indicate that the difference between a reviewer’s rating of restaurant i and the average rating that the same reviewer leaves at other restaurants increases by 0.02 Yelp stars when crossing a Yelp threshold. This difference is statistically insignificant and represents 0.6% of the average rating.19 The estimates for the 100 to 500 reviews sample and the full sample of restaurants are even smaller (0.003 and 0.002 Yelp stars respectively) and remain statistically insignificant.
The inspection of the density of average ratings and review and reviewer characteristics reveals no evidence of gaming occurring discontinuously at Yelp thresholds. An alternative test for gaming near Yelp thresholds examines the speed at which a restaurant’s average rating rises as it nears a Yelp threshold. If restaurateurs accelerate their gaming efforts when their restaurants lie just below a Yelp threshold, then a restaurant’s average rating should rise faster when it lies just below a Yelp threshold than it does at other points. To implement this test, we collapse the two year panel data set to disjoint bins of width 0.03 stars, placed such that all three Yelp thresholds in our data (3.25, 3.75, and 4.25) lie at bin borders. This is the same data set we used when examining the dynamic properties of average Yelp ratings in Table 4, and it contains 51 bins from 3.01 stars to 4.49 stars. Three
18 Since the purpose of the test is to detect reviewers who have written a non-trivial number of reviews focusing on restaurants competing within the same market, we compute !!"−!! for all reviewers j with at least
six reviews, the majority of which are left for San Francisco restaurants (the universe of potential competitors). However, the results in Table 5 are unchanged if we instead compute !!"−!! for all reviewers j.
19 The mean of the dependent variable, –0.056, is of limited interest because it must be close to zero by construction for the entire sample.
2 0 20
of these bins – 3.22, 3.72, and 4.22 – lie just below Yelp thresholds (we refer to bins using their left boundaries). The other 48 bins do not lie just below Yelp thresholds. For each bin we calculate the proportion of restaurants that reach the next bin within a given number of weeks after entering the initial bin. This proportion should be higher for the bins starting at 3.22, 3.72, and 4.22 if restaurateurs accelerate their gaming efforts when their restaurants lie just below a Yelp threshold.
Table 6 presents results on the effects of entering a rating bin just below a Yelp threshold. In each column, we regress the proportion of restaurants that enter the next bin within 1 or 8 weeks on an indicator for whether the bin lies at 3.22, 3.72, or 4.22 and on a cubic in the value of the bin.20 Column (1) indicates that the probability of crossing to the next bin within 1 week of entering the initial bin is 1.1 percentage points lower just below a Yelp threshold than at other points. This difference is statistically insignificant and represents 8.9% of the average 1 week crossing rate. Column (2) indicates that the probability of crossing to the next bin within 8 weeks of entering the initial bin is 3.9 percentage points lower just below a Yelp threshold than at other points. This difference is statistically insignificant and represents 13.2% of the average 8 week crossing rate. These estimates remain statistically insignificant if we vary the crossing window length (from 1 to 8 weeks) or double the bin width (from 0.03 to 0.06). Columns (3) and (4) present analogous results estimated on the sample of restaurants with 100 to 500 reviews, while columns (5) and (6) present analogous results estimated on the sample of all Yelp restaurants. In all columns the average crossing rates in bins just below Yelp thresholds are not statistically different than the average rates in other bins.
5.
Interpretation of RD Effects
Section 4 establishes that the observed changes in reservation availability at Yelp thresholds represent causal effects. However, several questions emerge when considering these effects. First, do the effects represent the transmission of information on restaurant quality or do they represent a marketing effect generated by Yelp’s ranking system? Second, do the effects on reservation availability translate into changes in customer visits? Third, do
20 Controlling for the cubic of the initial bin value does not affect the coefficient of interest but improves the regression’s precision.
2 1 21
restaurants react to crossing a Yelp threshold in a manner that affects the observed change in reservation availability? Finally, what changes in customer flows and profits are consistent with the observed changes in reservation availability? We present evidence on each of these questions in this section.
5.1 Information on Quality Versus Marketing
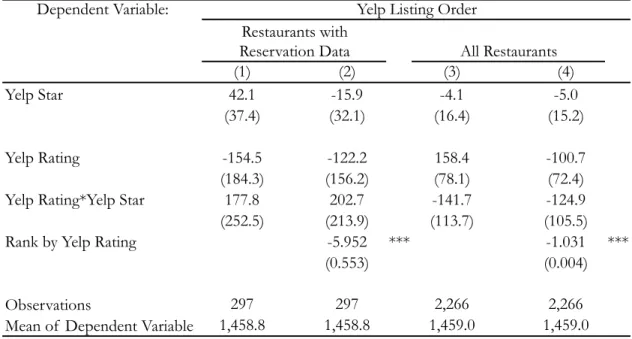
The RD estimates may not represent a pure effect of information regarding restaurant quality if the order in which Yelp lists restaurants on its website is a function of a restaurant’s displayed average rating rather than its true average rating.21 In that case, restaurants just above a Yelp threshold would be significantly more likely to be seen by consumers browsing Yelp than restaurants just below a Yelp threshold. To examine whether crossing a Yelp threshold affects the order in which a restaurant appears on Yelp, we implement a variant of our RD regression from equation (2) that specifies a restaurant’s Yelp listing order (i.e., the order in which it appears on Yelp.com) as the dependent variable.
Table 7 presents estimates of this regression for both restaurants with reservation data and all San Francisco Yelp restaurants.22 Column (1) indicates that crossing a Yelp threshold increases (i.e., makes worse) a restaurant’s Yelp listing order by 42 places on average. This estimate is statistically insignificant and represents 2.9% of the average listing order. Column (2) includes as a covariate a restaurant’s rank as determined by its Yelp rating (i.e., the top rated Yelp restaurant receives a rank of 1, the second highest rated Yelp restaurant receives a rank of 2, etc.). This increases precision because the relationship between a restaurant’s listing order and its Yelp rating is nonlinear; in particular, it changes according to the density of restaurants at different Yelp rating levels. In contrast, the ranking by Yelp rating is more uniformly predictive of the Yelp listing order. Crossing a Yelp threshold now decreases (i.e., improves) a restaurant’s Yelp listing order by 16 places on average. This estimate is statistically insignificant and represents 1.0% of the average listing order. Columns (3) and (4) estimate the same models as the first two columns on the sample
21 Such an algorithm would be surprising in that it would require more code to write than an algorithm that simply uses the true average rating. Using the displayed average rating would result in an enormous number of ties, so it would be necessary to sort both on displayed average rating and true average rating. Of course, after conditioning on the true average rating, there is no additional information contained in the displayed average rating.
2 2 22
that includes all restaurants. Crossing a Yelp threshold decreases a restaurant’s listing order by a statistically insignificant 0.3% in both cases. The R2 in all regressions ranges from 0.95 to 0.98, indicating that listing order is almost entirely determined by average rating (the other factors that appear to have some impact are number of reviews and geographic proximity). Since the Yelp thresholds have no effect on restaurant listing order, the placement of restaurants among Yelp search results is continuous across thresholds, and the RD effects must reflect the transmission of information regarding restaurant quality. We thus conclude that increased information about restaurant quality causes higher-rated restaurants to have lower availability, rather than any effect of increased visibility.
5.2 Substitution Between Walk-ins and Reservations
Though Yelp ratings affect reservation availability, it is possible these changes occur only because customers who would have otherwise walked in now make reservations. If consumers react to Yelp ratings by assuming that higher rated restaurants are more likely to have long waits, they may make extra effort to book a reservation. However, high Yelp ratings alone may not be sufficient to draw them to a restaurant that they otherwise would not visit. Under this behavior, crossing a Yelp threshold would reduce both reservation availability and peak customer flows. Reservation availability would fall as consumers react to the higher displayed Yelp rating. Peak customer flows would fall as consumers who would have made reservations at the lower displayed Yelp rating now find the restaurant to be fully booked and choose to dine at other locations or times.
To test whether Yelp ratings affect consumers’ propensity to book reservations without changing customer flows, we surveyed wait times for a random subset of restaurants lying near (within 0.2 stars) the 3.25 Yelp threshold over two weekends in February 2011. We chose the 3.25 threshold because it displayed the largest changes in reservation availability. Because there are more restaurants above 3.25 stars than below 3.25 stars, we surveyed every restaurant between 3.05 to 3.24 stars and a random 60% subsample of restaurants between 3.25 to 3.45 stars. The resulting sample contained 21 restaurants below 3.25 stars and 29 restaurants above 3.25 stars. On two Friday evenings and one Saturday evening a research assistant called restaurants in the sample between 6:30 and 7:30 pm. Each restaurant was called at least once, and the order of calls was randomised. At each restaurant
2 3 23
the research assistant asked how long a party of four would need to wait for a table if they arrived within 15 minutes. In some cases restaurants reported that the expected wait time exceeded one hour and gave an estimate of a time at which seating would definitely be available. In these cases we recorded both the number of minutes between the current time and the time at which seating would definitely be available and a version of the same variable that was top-coded at 60 minutes. The raw correlation between wait time and reservation availability was large and statistically significant. Restaurants with no reservation availability reported waits that were 34 minutes longer using the raw wait time variable (t = 2.4) and 20 minutes longer (t = 2.4) using the top-coded wait time variable.23 Both differences are more than 100% of the average wait time and top-coded wait time respectively.
Table 8 presents RD estimates of the effects of crossing the Yelp threshold on restaurant wait time. Each regression controls for a restaurant’s average Yelp rating, the average rating interacted with an indicator for being above the threshold, the time of day at which a restaurant was called, and indicators for each day in the sample.24 Column (1) indicates that crossing the Yelp threshold increases top-coded wait time by 27 minutes. This effect is statistically significant and represents 189% of the average top-coded wait time. Of course, many restaurants report no wait. Column (2) presents estimates from a Tobit version of the regression in column (1); under certain assumptions, the coefficient in column (2) may be interpreted as the effect of crossing the Yelp threshold on wait time conditional on a restaurant having any wait.25 The coefficient in the Tobit model is 131 minutes and is marginally significant; the coefficient is substantially larger than in column (1) because the dependent variable is both top-coded and bounded below at zero. Columns (3) and (4) estimate the same models using raw wait time as the dependent variable. The least squares estimate in column (3) is marginally significant and implies that crossing the Yelp threshold increases wait time by 49 minutes. The Tobit estimate in column (4) is statistically significant and implies that crossing the Yelp threshold increases wait time by 120 minutes conditional
23 Wait time is bounded below at zero (and bounded above at 60 for the top-coded version of the variable). Tobit versions of the same regressions generate estimates of 73 minutes (t = 2.8) and 83 minutes (t = 2.0) respectively.
24 Controlling for time of day called and the day indictors increases precision but has little impact on the coefficient estimates. This is not surprising since time of day and day called were randomised.
25 Most importantly, crossing the threshold must have no effect on the probability of any wait. If crossing the threshold affects the probability of any wait, then the “causal effect” of crossing the threshold on wait time conditional on any wait becomes difficult to define. This assumption is unlikely to literally be true, so we are more interested in the sign and significance of the Tobit estimates than in the magnitude of the Tobit coefficients.
2 4 24
on the restaurant having any wait. Column (5) estimates the effect of crossing the Yelp threshold on the probability of experiencing any wait. Crossing the Yelp threshold increases the probability of any wait by 44 percentage points, but the difference is not statistically significant.
The results from the wait time regressions reveal no evidence that wait times decrease when crossing a Yelp threshold. To the contrary, the coefficient of interest in every regression is positive, and two are statistically significant at the 5% level. We thus conclude that Yelp ratings affect both customer flows and the probability of booking a reservation.
5.3 Effects on Restaurant Behavior
It is possible that restaurants respond to higher Yelp ratings by changing the quality of food or service provided, perhaps most plausibly as a response to increased consumer demand. In that case, our RD estimates remain valid, but the exact channel for the increase in restaurant demand becomes more complicated.
To test this hypothesis, we examine whether external ratings change when restaurants cross Yelp thresholds. We have two sources of external ratings: the Zagat guide rating for each restaurant, and the displayed rating from the online reservations database. Unlike Yelp, the online reservations database displays a relatively continuous average rating, with the listed ratings complete up to tenths of a point. Table 9 presents regressions with quality measures as outcomes, considering alternatively the rating in Zagat categories of Food, Décor, Service, and Cost, and the restaurant rating from users of the online reservations database. None of the RD estimates presented in the first row are statistically significant. All are small in magnitude, and there is no pattern to the point estimates. Thus, we conclude that any quality adjustments that restaurants make in response to crossing a Yelp threshold are modest.
5.4 Potential Effects on Restaurant Profits
We estimate that an extra half-star on Yelp reduces reservation availability by approximately 19 percentage points. To gauge what changes in customer flows could be consistent with a 19 percentage point change in reservation availability, we performed a
2 5 25
series of simple statistical calibrations. First, we recorded the capacity of each restaurant in a sample of 73 restaurants.26 Next, we assumed that a restaurant has no reservation availability if the number of seats reserved for a given evening reaches its capacity. Finally, we examined the average customer flows that would be consistent with reservation availability rates of 58% (the average rate above the Yelp thresholds) and 39% (the average below the Yelp thresholds) under different assumptions about the distribution of arriving customers.
If customer reservation arrivals for each restaurant follow a Poisson process, then the equality between mean arrivals and the variance of arrivals makes it easy to calculate mean customer flows for any given sell out frequency and capacity. For example, a restaurant at the 10th percentile of capacity (40 seats) sells out 58% of the time when mean customer arrivals are 39.4 per evening and 39% of the time when mean customer arrivals are 42.8 per evening. The implied change in customer flows that corresponds to the observed change in reservation availability is thus 8.6% (42.8/39.4 = 1.086). Analogous figures for the median restaurant (85 seats) and a restaurant at the 90th percentile of capacity (207 seats) are 6.0% and 3.8%.
Of course, the Poisson process understates the true variance of customer arrivals because customer arrivals are not independent of each other. Customers generally arrive in groups of two to six, and some Thursday or Friday nights may be more popular for dining than other Thursday or Friday nights. If we assume that the true variance of arrivals per evening is twice the Poisson variance, then for the 10th percentile restaurant the implied change in customer flows that corresponds to the observed change in reservation availability is 12.8%. Analogous figures for the median restaurant and the 90th percentile restaurant are 8.6% and 5.4% respectively.27
These back-of-the-envelope calibrations suggest that the median restaurant might experience a 6% to 9% increase in customer flows if its reservation availability drops from 58% to 39%28. A modest change in customer flows, however, can have a significant impact on profits in an industry with high fixed costs and high margins. For a typical
26 We drew a random sample of 100 restaurants from our data and telephoned each restaurant to inquire about its capacity. Of the 100 restaurants, we were able to reach 73 of them.
27 If the true variance is twice the Poisson variance, then a 95% confidence interval for the number of arrivals on a prime dining night at a restaurant that averages 75 arrivals per night is (50, 100). If the true variance were even higher, then the implied change in customer flows would increase further.
28 While in percentage terms these numbers are modest, we note that not all restaurant patrons are Yelp users. Thus, the increased flow as a percentage of patrons that are Yelp users may be much more substantial