i
A Predictive Model for Scaffolding Manhours in Heavy Industrial
Construction Projects: An application of machine learning
Kavana Siddappa A Thesis In The Department
Of
Building, Civil and Environmental Engineering Presented in Partial Fulfilment of the Requirements
For the Degree of
Master of Applied Science in Building Engineering at Concordia University
Montreal, Quebec, Canada Winter 2019
ii
CONCORDIA UNIVERSITY School of Graduate Studies
This is to certify that the thesis prepared by
By: Kavana Siddappa
Entitled:
A Predictive Model for Scaffolding Man-hours
in Heavy Industrial Construction Projects: An application of machine learning
and submitted in partial fulfillment of the requirements for the degree of Master of Applied Science (Building Engineering)
Complies with the regulations of the University and meets the accepted standards with respect to originality and quality.
Signed by the final Examining Committee: Prof. Joonhee Lee, Chair
Prof. Fuzhan Nasiri (Examiner) Prof. Mazdak Nik-Bakht (Examiner) Prof. Sang Hyeok Han, Supervisor
Approved by Dr. F. Haghighat
Chair of Department or Graduate Program Director March 2019 Dr Amir Asif
iii
Abstract
In cold countries like Canada, modular construction is widely adopted in heavy industrial construction projects due to weather uncertainties. To facilitate the construction processes, the temporary structures, especially scaffolding, are essential since it provides easy access for workers to carry out construction activities at different levels of the height and also ensures the safety of labourers. As indirect costs of projects, the scaffolding is estimated by 15-40% of project costs. Furthermore, according to increase the size of the projects, the scaffolding uses larger amount of resources than estimated ones, which may cause budget overrun and schedule delay. However, due to the lack of systematic and scientific models to estimate the scaffolding productivity, heavy industrial company has difficulty to plan and allocate the resources for scaffold activities before construction. To overcome these challenges, this paper proposes a predictive model to estimate scaffolding productivity based on the historical scaffolding data of a heavy industrial project. The proposed model is developed based on the following steps: (i) identifying the key parameters (e.g. specific trades, work type, different scaffold methods, task times spent using scaffolds, and weights of the scaffolds) that influence the scaffolding manhours and project productivity; and (ii) developing the predictive models for scaffold manhours using machine learning algorithms including multiple linear regression, decision tree regression, random forest regression and artificial neural networks(ANN) . The accuracy of models have been measured with evaluation metrics which are mean absolute error (MAE) and root mean squared error (RMSE) and the R squared value. The findings reveal upto 90% accuracy for ANN models.
iv
Acknowledgment
I would like to thank my supervisor Dr Han, for giving me immense support all through this research process. I would be grateful for the PCL Company and its employees for helping me with providing case studies for my research. The timely guidance from both professor and the PCL Company helped me to complete the research on time. Further, my family and friends are of great support in this process. Their constant support have made me more dedicated towards my work. I would also want to thank Concordia University for giving me this chance to follow my dream and providing accommodation to pursue my graduation degree.
v
Table of Contents
CHAPTER 1: INTRODUCTION ... 1 1.1. Back Ground ... 1 1.2. Research Motivation ... 2 1.3. Objectives ... 4 1.4. Thesis Organisation ... 6CHAPTER 2 LITERATURE REVIEW ... 7
2.1. Introduction to Scaffolding ... 7
2.1.1. Tubular Frame Scaffolds ... 8
2.1.2. Tube and clamp scaffolds ... 9
2.1.3. Systems scaffolds ... 10
2.1.4. Tower Scaffolds ... 10
2.1.5. Dance floors ... 11
2.1.6. Cantilever Scaffolding ... 12
2.1.7. Hanger Scaffolding ... 12
2.2. Need of Scaffold Planning in Industrial Sector ... 13
2.3. Current Scaffolding Practices ... 14
2.4. Machine Learning (ML) Algorithms in Construction ... 16
2.5. Scaffold related work ... 17
CHAPTER 3 METHODOLOGY AND CASE STUDY ... 21
3.1. Introduction to Data Analysis ... 21
3.1.1. Descriptive Analysis ... 22 3.1.2. Diagnostic Analysis ... 22 3.1.4. Prescriptive Analysis... 23 3.1.3. Predictive Analysis ... 23 3.2. Proposed methodology ... 23 3.3. Data Collection ... 26 3.4. Data Preprocessing ... 31 3.5. Data Visualization ... 38 3.6. Modelling ... 54
3.6.1. Multiple linear regression ... 56
3.6.2. Decision tree regression ... 56
3.6.3. Random forest regression ... 57
vi
3.7. Model Evaluation ... 60
3.7.1 Root Mean Squared Error (RMSE) ... 60
3.7.2 Mean Absolute Error (MAE) ... 60
3.7.3 R squared value ... 61
3.8. Implementing the model and test results. ... 62
CHAPTER 4: CONCLUSIONS ... 74 4.1. Future Work ... 76 CHAPTER 5: REFERENCES ... 77 APPENDIX ... 84 Appendix 1 ... 84 Appendix 2: ... 85 Appendix 3 ... 85 Appendix 4: ... 86 Appendix 5 ... 87 Appendix 6 ... 89
vii
List of Figures
Figure 1 Example of tubular frame Scaffold [11] ... 8
Figure 2 Example of tube and clamp Scaffolding [12]... 9
Figure 3 Example of System Scaffolding [13] ... 10
Figure 4 Example of Tower Scaffolding [14] ... 11
Figure 5 Example of Dance floor Scaffolding [15] ... 12
Figure 6 Example of Cantilever Scaffolding [16] ... 12
Figure 7 Example of hanger suspended Scaffolding [18] ... 13
Figure 8 Work flow of a single scaffolding activity ... 15
Figure 9 General Data Analysis process ... 22
Figure 10 Framework of the proposed work ... 26
Figure 11 Boxplot showing IQR ranges ... 33
Figure 12 Data set before removing outliers ... 35
Figure 13 Scatter plot of Manhours after removal of Outliers. ... 36
Figure 14 Micro level distribution of qualitative parameters ... 37
Figure 15 Components of Data visualisation ... 38
Figure 16 Scaffold manhours in terms of work classification ... 39
Figure 17 Productivity in terms of work classification ... 39
Figure 18 Scaffold manhours in terms of discipline ... 40
Figure 19 Productivity in terms of discipline ... 41
Figure 20 Distribution of man hours combined in both work classification and discipline ... 41
Figure 21 Average manhour distribution along the time period of the project. ... 43
Figure 22 Consumption of manhours in terms of work classifications along time period ... 44
Figure 23 Manhours consumption at different temperatures ... 45
viii
Figure 25 General process of filter method feature processing ... 46
Figure 26 General process of wrapper method feature processing ... 47
Figure 27 General process of embedded method feature processing ... 47
Figure 28 Sample of clustering of data sets ... 50
Figure 29 Example of an artificial neural network ... 59
Figure 30 Flow chart of building a predictive model. ... 65
Figure 31 Test results of algorithms in comparison with actual values ... 72
Figure 32 Test results of artificial neural network predictive model in comparison with manual estimation and actual values. ... 73
ix
List of Tables
Table 1 Parameters related to scaffolding data ... 29
Table 2 Sample data set for scaffolding work ... 30
Table 3 Scaffold type in terms of man hours and productivity. ... 42
Table 4 Correlation for quantitative parameters ... 51
Table 5 Random forest method ranking of variables ... 52
Table 6 Relative importance method ranking of variables ... 52
Table 7 Importance level of different parameters on scaffolding man hours ... 53
Table 8 Parameters considered for modelling in the initial stage ... 63
Table 9 IQR different range model analysis ... 66
Table 10 Predictive models based on variable importance ... 67
Table 11 Test results of complete data set ... 68
Table 12 Test results for dataset grouped based on type of scaffold ... 69
Table 13 Test results for dataset grouped based on work classification ... 69
Table 14 Test results for dataset grouped based on discipline ... 69
Table 15 Final set of input parameters for the predictive models ... 70
Table 16 Cumulative test results for regression models ... 71
1
CHAPTER 1: INTRODUCTION
1.1.
Back Ground
Construction Industry is one of the major driving tools of the Canadian economy. Most of the economy for construction is highly dependent on heavy industrial projects such as petroleum, mining, shipbuilding, steel, chemicals, machinery manufacturing, and oil refineries since they involve huge capital and resources. A forecast for the upcoming decade (2019-2028) conducted under the assistance of Government of Canada, says that the mining, quarrying and other oil sand industries would be the major influence for driving the construction economy [1]. In particular, Alberta’s oil sands stands as a primary source of growth in Canada’s heavy industrial projects. As for the scale of development, based on the oil sands market analysis by Ernst and Young [2], the impact of the oil sands on Canada’s economy is forecasted to reach a total of nearly $4.93 trillion for the years 2010 to 2035, and over 90% of the economic impact will be felt in Alberta. Meanwhile, according to the Alberta oil sands supply chain opportunity analysis [3], total capital expenditures on oil sands projects are forecasted to exceed $150 billion over the next 10 years. The range of estimated total expenditures on maintenance, repair, and operation between 2011 and 2022 is from $227 billion to $330 billion [3]. Based on the actual figures and projections, steel fabrication and machinery manufacturing are expected to play a critical role in oil sands projects. In addition, the statistics of Canadian construction claims that the main challenge construction industries would face in the near future would be labor resources. The government anticipates that around 2 million laborers are in a verge to retirement and the demand for labor would go high, since most of the industrial works happens in remote areas where there is less availability of human resources. Also, there is a scarcity of young laborers who are willing to work for heavy industrial projects [4]. These kinds of projects involve heavy equipment such as boilers, pressure vessels, tanks, heat exchangers, and
2
steel pipes and tubes which are designed for many disciplines of work (structure, civil, chemical, manufacturing, and mechanical). To facilitate the construction of these components, each discipline needs the temporary structures amongst which scaffolding is widely used. Scaffolding provides temporary elevated platforms, thereby allowing laborers to access their work areas and transport materials vertically and horizontally. In this respect, the scaffolding in the industrial projects should be installed, modified and/or dismantled in accordance with the requirements of the disciplines on their demand times in order to prevent project schedule delays. Due to the demand-based scaffolding operation, the construction domain has difficulty to plan scaffolding operation in the early phases of the project. This has led to ad hoc way of using resources such as labor, equipment, and materials. There is a need for effective utilization of resources, especially the manpower because the labor cost is highly expensive and there is a lack of human resources.
1.2.
Research Motivation
The day-to-day challenges faced in the construction processes provide the room of opportunity for improving the work productivity by adopting new technologies and/or by implementing various innovative approaches. However, it is believed that the complexities in heavy industrial projects involving larger machine tools, huge facilities, and various work processes are higher than the other construction sectors (e.g., residential, civil and commercial). The reason behind the complex nature of the industrial sector is; it involves higher risk in handling materials and laborers since they are bulk projects. There is a need of proper planning in order to avoid the uncertainties such as overflow of time, cost and quality may arise and affect the overall project’s performance throughout its lifecycle. Hence, an effective planning is of utmost importance for heavy industrial projects.
Over the years, planning of the projects, primarily concentrated on permanent structures, as they tend to consume more workforce and resources. The permanent structures such as
3
buildings, bridges, and tunnels can be aided through certain erected temporary structures by providing access, support, and protection for the facilities which are under construction. Apart from this, temporary structures are also used in various above and below ground facilities in order to facilitate inspection, repair and maintenance works [5]. Some of the examples of temporary structures are earth-retaining structures, tunneling supports, underpinning, diaphragm/slurry walls, construction ramps, runways, and scaffolding. Once the permanent structures are completed, these temporary structures are either incorporated along with them or are broken into pieces and separated [5]. The current industrial practices are highly dependent on the knowledge and experiences of individual engineers for most of the temporary works. There is a lack of planning and estimation for these temporary works prior to the start of the project. The current market has a lot of software designed for temporary facilities (e.g., shoring and scaffolding) which are commercially available. Unfortunately, all these are not globally adopted due to their limitations of not being implemented successfully in any kind of working environment. The main decisions have been taken by human cognition, based on the visualization of building designs or construction sites [6]. Many construction projects use temporary facilities regularly, and the safety, quality, profitability, and duration of these structures are having a larger impact on the overall budget and time of any construction project considered. They sometimes exceed more than a quarter percent of the total cost of the project. Hence, the careful study and planning of these activities is a requirement for current construction industry’s scenario. Generally, construction projects require different kinds of temporary works which consume a considerable amount of time and cost of the project, one such work is scaffolding. The recent discoveries in the field of project management proves that the scaffolding works do consume a substantial amount of resources (e.g., labours, equipment and space), which sometimes could create budget overrun, schedule delay and other issues such as safety, quality, and profitability of the projects when they are not planned efficiently in the
4
planning stages of the construction projects [7]. Scaffolding has been an essential temporary work, which is required in both prefabrication sites and in the construction sites for providing temporary elevation platforms to facilitate the labor works as well as material transferring. In practice, the companies roughly estimates the scaffolding manhours by a considerable percentage (15-40%) of the total manpower of the project, which is a significant portion of the total cost of the project. Since there are no standardized procedures for guiding the scaffolding practitioners in regard to planning the scaffold works, the man power may exceed the range quoted by scaffolding expertise and may cause cost overruns and/or schedule delays. Furthermore, previous researchers and the industrial companies hardly gave attention to scaffolding and developed any scientific and systematic models for estimating scaffolding manhours. .Henceforth, there is a necessity of developing scaffold-planning models for not only efficient execution of the projects but also project productivity improvement in terms of cost and time. In this respect, this research helps to build a predictive model for scaffolding manhours in heavy construction projects based on the application of machine learning algorithms including multiple linear regression, decision tree regression, random forest regression and artificial neural networks (ANN). By the effective utilization of a case study obtained from a collaboration company, the proposed model is developed and validated in the planning stages of construction projects.
1.3.
Objectives
The research objective is to know which all factors are impacting the manhours consumption by scaffold activities and how much percent of manhours have been used for scaffolding works for the heavy industrial projects. The traditional practice for manhours required for each scaffolding task is decided based on scaffold expertise which is subjective based on their experiences. The decision may vary from person to person. Deciding the work schedule and allotting the resources for scaffolding activities might vary for different reasons such as delay
5
of the work due to labor /material unavailability, or the temperature may not be favourable and many.. Some of the subcontractors prefer scheduling the scaffolding activity based on the trade of work (giving priority to a particular trade) whereas some subcontractors use the date of request raised (the early request is considered first) for conducting the work. This might lead to a lot of impromptu decisions. To avoid ad hoc methods of estimating and allotting resources (such as man power and materials), there is a need to plan for scaffolding activities in prior. Hence, predicting the manhours for scaffolding activities during the planning phase of the project in order to avoid unnecessary cost overruns and schedule delays is considered as the main goal of this research. In this way, the supervisor can have an idea of manpower requirement and plan the associated works in a much detailed way. The proposed method would
estimate and keep track of the manhours required for scaffolding works using technical methods and will further help during the decision-making process for planning efficiently. A case study of the industrial project from a well-known heavy industrial construction company has been considered for this research. The study is undertaken step by step in the following process.
i. Study of existing scaffolding process and the requirements by referring to historical data of the industrial projects.
ii. Data visualization in order to understand and monitor utilization of scaffold data in relation to manhours consumed for scaffolding tasks.
iii. Development of a predictive model for scaffold manhours using machine learning algorithms based on the previous project data analysis in terms of associated specific trades, scaffold weights/volumes, work type, and other impacting factors.
6
1.4.
Thesis Organisation
Chapter 1 deals with the back ground and motivation of the research .The importance of temporary structures, especially scaffolding activities in the heavy industrial companies, the consequence of having improper planning of scaffolding are discussed.
Chapter 2 deals with the literature review associated with the scaffolding. Types of scaffolds, planning and existing methods of scaffold estimation, automation in construction field, and implementation of machine learning in the construction field are critically reviewed.
Chapter 3 deals with the general method of data analysis process and how it is implemented to current research for building a predictive model using machine learning algorithms. A step by step process of data analysis is explained. Starting from collection of scaffold data, pre-processing by feature selection, removing outliers, data visualisation through graphs and correlation charts are explained in detail. Further, various machine learning algorithm such as Multiple Linear Regression, Decision Tree Regression, Random Forest Regression and Artificial Neural Networks (ANN) are discussed. Also, evaluation metrics such as Root Mean Squared Error (RMSE); Mean Absolute error (MAE), and R squared values are discussed. Chapter 4 deals with the results of the predictive model built using machine learning algorithms with the help of existing data. The test results of each model is tabulated and compared. The results are represented in terms of accuracy and error values. A brief explanation
Chapter 5 deals with the conclusion of the whole research and scope for future works. It also addresses the limitations for the current methodology
7
CHAPTER 2 LITERATURE REVIEW
This chapter explains about the basics of scaffolding and different types of scaffolding structures used in the field of construction. In addition, it describes about the recent developments in the field of construction in terms of automation, application of machine learning and various other innovative methods. Further, this section put lights on the existing methods of scaffold planning and estimation and it also explains the approach of this research.
2.1. Introduction to Scaffolding
Occupational safety and health services (OSHA) defines scaffolding as any structure, framework, swinging stage, suspended scaffolding, or boatswain’s chair, of a temporary nature which are used to support and/or protect construction workers by providing easy access to construction work areas horizontally and vertically, and also helps in material transfers [8]. Based on the loads to be carried on the scaffolding structure, materials such as bricks, steel, blocks, bamboo are chosen to build scaffolding [9]. There are different components to build scaffolding. It varies for each type of the scaffolding. However, there are some basic components required to construct any type of scaffolding, which includes base plates or castors, mudsills, adjustable screw jacks, vertical braces on both sides of frames, horizontal braces on every third tier of frame, platform materials to deck the working level, guardrails with toe boards, guardrail posts, ladders or stairs for access and intermediate platforms [10]. Choosing the components for building a particular scaffold is upto the manufacturer’s choice. But, selecting the right scaffold for the work is a technical concern, since it depends on various factors such as
i. Site conditions- As in concrete floors, exterior, interiors, backfill.
ii. Weight of workers, materials, tools and equipment’s that has to be carried. iii. Anticipated weather conditions.
8
iv. Height at which the work is carried. v. Experience of the crew.
vi. Type of work such as for painting, electrical, piping for which the scaffold is built. vii. Duration of work [10].
It should be noted that there are different kinds of scaffold used by the construction industries based on the requirements mentioned above. In North America and Canada, generally the construction industries prefer certain types of scaffolds. Each of the scaffold are explained in brief.
2.1.1. Tubular Frame Scaffolds
Tubular frame scaffolds are the standard scaffolds in the construction industries. The main advantage is the frames are available in different sizes and configurations, and also they are easy to assemble and can be done manually. They are generally made of steel but in the current practices, aluminium is chosen [10].An example of tubular frame scaffold is represented in Figure 1.
9
2.1.2. Tube and clamp scaffolds
Tube and clamp scaffolds, also known as tube and coupler scaffolding are one of the oldest type of scaffolding which emerged its way into the construction industry back in early 1900s and is still in use because of the fact that they are made of steel, which adds strength to the structure and also they are easy to assemble and dismantle. This type of scaffolding is the most flexible type of built-up scaffolding because it is usable to any type of configuration, as in it can be used in any direction such as vertical, horizontal or diagonal. Due this flexible nature, it is used for extremely complex designs. The only main disadvantage of this tube and clamp scaffolding is, it uses more labor force the high consumption of labour force which extends the cost consumption [9]. However, it is highly recommended to build these kind of scaffolds with the help of a scaffolding expertise to ensure the safety of the workers. Also, after certain height (10m), it is a rule that this scaffold has to be designed by professional engineer [10]. An example of tube and clamp scaffold is represented in Figure 2.
10
2.1.3. Systems scaffolds
Systems scaffolding which are also referred as modular system scaffolding are systematically built with the help of horizontally, vertically and diagonally pre-engineered components of fixed incremental lengths. An important feature of all the types of system scaffolding is, the device with which it connects all the horizontal ledgers to the vertical nodes. Most of the features that contributes towards the importance of this scaffold type are safety, speed, efficiency and consistency. Another contributor to its fame is, its simplicity in terms of assembling which ensures that the amount of loose pieces are fewer when compared to other assembling scaffolding systems. This scaffolding is a bit more expensive than the other types because its initial investment cost is high [9].Though the height and width of the scaffold cannot be adjusted as in tube and clamp, systems scaffolds are widely adopted for non-rectangular, dome-shaped and circular structures [10].An example of the system scaffolds is represented in Figure 3.
Figure 3 Example of System Scaffolding [13] 2.1.4. Tower Scaffolds
Tower scaffolds also known as staircase towers are the scaffolds built for the safety of labor working at heights. It’s always designed by an engineer since its failure in erecting can cause serious damages. The interesting thing about tower scaffolding is that, it's not necessary for it to be built from the ground level. Based on the requirement, it can be built from any height
11
above the ground level along with the secure access. Such type of scaffolds are useful in situations where the customers might want the structures to not meet with the ground and obstruct the path for pedestrians. The key features of this type of scaffold is -its fast to build, certain types of tower scaffolds can be built by a single person and few might not even require any kind of prior experience [9]. Tower scaffolds are widely used in North America and Canada. The entire scaffold can be raised and released to the required height providing the workers a comfortable working platform. The manufacturer’s regulations should be always followed to build the tower scaffold [10].An example of tower scaffold is represented in Figure 4.
Figure 4 Example of Tower Scaffolding [14] 2.1.5. Dance floors
Dance floor scaffolds are temporary platforms erected along with the regular type of scaffolding. They are built in a way that multiple workers can work in the same platform. This in turn helps to complete the tasks in a shorter span. They are generally used for ceiling works and lobby areas [15].An example of dance floor type of scaffold is represented in Figure 5.
12
Figure 5 Example of Dance floor Scaffolding [15]
2.1.6. Cantilever Scaffolding
Cantilever scaffolds are special kind of scaffolding which are used when there is difficulty in placing the base of the scaffold on the ground or in the congested pathways. The use of poles and frames are not required in this kind of scaffolding and also they are easy to erect [16].An example of cantilever scaffolding is represented in Figure 6.
Figure 6 Example of Cantilever Scaffolding [16]
2.1.7. Hanger Scaffolding
Hanger scaffoldings are the suspended types of scaffolding which are built using ropes and pulleys. This is one of the scaffolding used by the workers during maintenance activities for moving above and below the ground level [17].A hanger scaffolding example is represented in Figure 7.
13
Figure 7 Example of hanger suspended Scaffolding [18]
2.2. Need of Scaffold Planning in Industrial Sector
Being one of the largest sector of the construction domain, the heavy industrial projects lack obligation of having proper scheduling and planning throughout its life cycle. Industrial projects do have their complexities and uncertainties due to the involvement of larger number of man power, labor resources and many other complicated process.In practice, the estimation of the cost for any construction project is generally divided into two types of cost; namely Direct and Indirect costs. The direct costs include labor, materials, supplies, equipment, and any expenses related to the final product. The indirect cost comprises of overheads, profits, and contingence allowances and other temporary costs that does not fit in the Work Break down Structure (WBS) of the project. Surprisingly, these indirect costs have exceeded up to 55% of the total project cost [19]. There are different ways of estimating the project costs depending on engineering experiences and knowledge, and regulations in companies. By close investigations it can be said that the estimator’s experience and knowledge is the key deciding factor for estimation of indirect works. Most of the industrial companies claim that the percentage of indirect cost required for scaffolding works earlier used to vary from 15-20% of
14
the total direct work of the project, but it is extended to 30% and more which is not at all a negligible amount [7]. Since there are no scientific and objective procedures to guide scaffold expertise in regards to planning and estimating of scaffold work, uncertainties such as cost and schedule overruns have become more common. About the schedule delays; the work phase model created by the Construction Owners Association of Alberta (COAA) do suggest to have an effective planning and scheduling for scaffold activities since any delay in the scaffold work would affect the other major works directly [20]. COAA recommends having integral planning for scaffolding in each work packages of any construction project. By collective thoughts put together, it can be said that, scaffolding accounts for considerable percentage of overall cost of the project. However, to overcome the current issues (e.g., cost and schedule overruns) faced by scaffolding activity, due to potentially incorrect human judgments or decisions, there is a need of proper planning and estimation of scaffolding activities in the planning stages of construction projects. It is urgent to develop a scientific model and/or method for scaffolding planning and estimation [7].
2.3. Current Scaffolding Practices
Planning of scaffolding activities is completely subjective and differs from company to company. It is worth mentioning that, most of the companies plan scaffolding as on need basis that is day–to-day or weekly basis [7]. For any particular project, generally the scaffolding superintendent is in charge for allotting the scaffold works. Initially, the trade foremen raises a request for the scaffold, then the superintendent will approve the request based on the availability of the resources (e.g. labor and materials) [7]. An industrial company claims that; in some scenarios, the scaffolding supervisor consider the early request dates, as in the first requested scaffolding task is approved for the construction. However, sometimes there decisions are taken based on the trade of work for which the scaffolding is required immediately. It is completely subjective decision to supply the scaffolds to the requested site
15
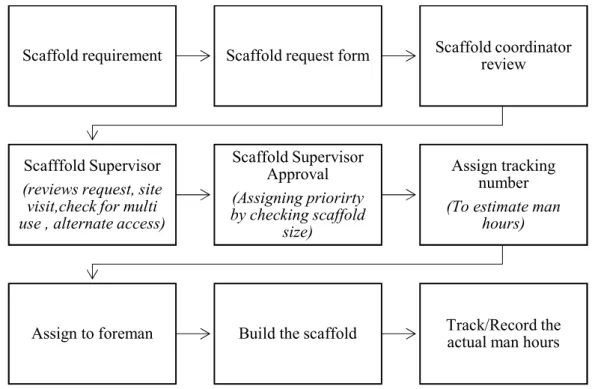
[7]. Figure 8 describes a general method of scaffold workflow in practice. Further, the allocation of manhours to accomplish any scaffold tasks is also decided by various factors such as the scaffolding weights or volumes, the type of scaffold to be built, the trade for which the scaffold is built. It can be summarised that the whole scaffolding activities has been an individualistic approach when it comes to scaffolding planning. However, this subjective decision often leads to excessive use of labor, schedule delays due to non-approval of scaffolding requests, resource shortages and in turn affect the overall project cost. An advanced plan of scaffolding activities would help in the effective use of the resource such as labor force and scaffolding materials. Further, a prior planning also helps in coordination between different project management teams within the project which helps to take right decisions in terms of time and cost [21]. Retrieving the necessary information and automated tracking of on-going construction works has proved to be a better solution; for taking decisions during the planning of work processes and the ability to handle dynamic circumstances [22].
Figure 8 Work flow of a single scaffolding activity
Scaffold requirement Scaffold request form Scaffold coordinator review
Scafffold Supervisor (reviews request, site
visit,check for multi use , alternate access)
Scaffold Supervisor Approval (Assigning priorirty by checking scaffold size) Assign tracking number (To estimate man
hours)
16
2.4. Machine Learning (ML) Algorithms in Construction
The traditional practices of handling construction projects are by visual inspection and human cognition. However, the recent developments in the field of science and technology has led to many data driven software and other innovations in the construction field [22]. Every aspect of the construction is getting adapted to new software, whether it might be scheduling, estimation, safety analysis or mitigating risks [22]. Through machine learning techniques, existing data can be effectively used in building automated monitoring systems through machine learning [22]. Use of machine learning helps to analyze the data of the construction works, which would further provide effective insights and guides the engineers/project managers during decision-making phases. Time, cost, quality, safety, operations and maintenance, and many other aspects of project management have adopted machine learning (ML) algorithms [23]. There are four different types of algorithms that can be used to project management areas for planning and estimation; they are classification, regression, association, and clustering [24]. Both classification and regression are used as predictive models where classification has categorical outputs and regression has continuous variable has outputs. Association is used for finding the relationships between the variables and clustering is a segmentation process where the similar variables are grouped [24]. In works related to construction, a lot of attempts has been made to adopt machine learning techniques. For instance, in 1997, Siquera [25] implemented machine learning algorithms (neural networks and regression models) for performing cost estimation to low rise buildings. This was one of the initiatives taken towards the emergence of automation in the field of construction. Hammad et.al [26] in their paper tried to build a predictive model for determining the duration of a steel fabrication using ML. The results turned out to be more accurate than the existing traditional practice. Some studies were done on estimating fluctuation costs such as liquidity, building services indexes by constructing classifier models such as SVM (Support vector diagram), Boltzmann machine (DBM) learning and
back-17
propagation neural networks [27]. Further, attempts have been made to use machine learning algorithms in occupancy predictions and Wi-Fi sensing in the buildings [28], and also it has been used to provide decision making output about the intensity of accidents occurred [29]. Other than these areas of construction, the use of ML has been very useful for temporary structures such as scaffolding. The ML adoption for the scaffolding works so far has been discussed below in section 2.5.
2.5. Scaffold related work
Scaffolding has become an irremovable concern to industries across petroleum, oil and gas, building, and infrastructure, in terms of less availability of labor and high cost, low productivity and delayed works [7]. It is believed that the in-depth analysis of scaffolding activities with a considerable amount of time spent, hardly have chances of success when compared to some other fields of study. The existing literature concerns the structural aspect of scaffold construction in specific scenarios. However, there are numerous researches that has proved its advantages over the machine learning algorithms finding solution for various construction related works. In addition, many scholastic researchers acclaimed that the planning methodologies hardly synchronizes with the dynamic scenarios and complexities faced by the construction industries. Campbell et.al [30] says that with the growing technology, computer simulations proved to be a solution for taking decisions during the planning of manufacturing processes since it has the capability of modelling the dynamic circumstances. Further, the author claims that simulation could also be useful in different stages of a project such as preconstruction planning phase, construction scheduling and post-construction [30].
The technology has grown wider and smarter to provide appropriate and accurate judgments for the complex scenarios in the construction field. The effective use of these resources can help in reducing potentially incorrect human judgments or decisions [6]. Although being introduced to a lot of advanced techniques and software, temporary works still lack essential
18
planning. Most of the temporary works, especially scaffolding, are generally not included in the main architectural and bid drawings [31]. Scaffolding being a significant temporary work often rely on the knowledge of engineers for estimation and planning. Since the front end planning of scaffolding mainly depends on individual experiences, there is a lack of firm scientific decisions and practical approaches for a proper estimation in terms of cost and manhours consumption [31]. There have been quite a few developments with respect to scaffold work. For instance, Feng et al. [31] in their paper describe constructing a safety model for scaffolding through BIM. A discrete firefly algorithm was used to find scaffolding scheduling and cost process for a modular construction environment. It was one of the attempts to address the issue of TCTP’s (Time-Cost Trade-off Problems). Further, a multi-objective discrete firefly algorithm was created by Hou et.al [32] in which they used certain scaffolding work-related parameters such as the number of crews and equipment to achieve the objective of minimizing cost and time for scaffolding works in the projects. Cho et.al [33] in their paper tried to use machine learning algorithms (SVM-support vector machine) for predicting safe/unsafe situation of the scaffolding activity based on different loads carried. The model helped in deriving different safety scenarios such as safe situation, overturning, uneven settlement, or overloading conditions [33].In addition to safety and cost issues, there were few approaches where they tried recognizing the images automatically and learning the progress of the scaffold activities [34], constructing the BIM (building information modelling) based scaffolding framework to track the scaffold safety risks and finding standard hazards and solutions [31]. Hou et.al says [21] the main concerns of the researches so far has been about the safety and design related issues of scaffolding. Apart from these aspects, for the successful execution of any construction project, the other crucial issues that have been identified are optimization and planning of scaffold works. Addressing this issue has been one of the main concerns, especially in heavy industrial projects since they invest a lot of capital for machine
19
and labor. Kumar et.al [7] in their research says that, there is a difficulty in planning the industrial construction scaffolding because it operates mostly on as-needed basis .They claim that each scaffold manufacturing company have different approach in constructing a scaffold, which further leads to different cost estimates. Further, there might be a huge number of modifications done to a particular scaffold, since it is used for multiple trades. For instance, if a scaffold used for the first floor can be re used for the next floor just by extending few stairs; it is beneficial when compared to dismantling the whole thing and reconstructing the new one. These kind of scenarios make the scaffold planning more challenging. Further, he adds that these scenarios are labor intensive jobs and hence consume more time and cost. To overcome this issue, he suggests an advanced scaffold plan which anticipates such situations would be a beneficial to the companies. In his research paper, he made an attempt to carry out macro and micro level of estimation for scaffolding, considering various factors as inputs - trades of work, trade hours, the geometry of equipment, elevation of equipment, the weight of equipment etc. The output parameters involved scaffold manhours derived from the existing data. Similar to Chandan Kumar research, using WEKA analysis, researcher Wu, L. [19] came up with an estimation model for scaffolding by considering historical data of an industrial project. In these two research(Wu, L. 2013, Kumar et al. 2013), there were regression models created which gave a quantitative method for the project estimator and project manager to quickly come up with the scaffold manhours needed for future projects based on the information available at the start of a project. Due to insufficient scaffolding data, the results generated from the models did not yield good results. One of the recent studies of real time data of an actual liquefied natural gas (LNG) plant construction, address how scaffold productivity is affected by various factors such as scaffold types, dimension of the scaffolds and it discusses the obligations faced by the companies due to improper planning [35]. However, these approaches remarked as stepping stones to carry out the planning and estimation of scaffold research works.
20
To summarise, it can be said that poor planning leads to low productivity in the overall works and badly affects the performance of the project in terms of cost and time. In order to provide valuable solutions, this paper aims to develop a mathematical optimization model for manhours predictions in future use. In addition, this approach could be implemented in the planning stages of any heavy industrial construction projects, so that the project estimators get a standardized method to decide the manhours required for scaffold tasks. The next sections deals with the methodology adopted to build the predictive model.
21
CHAPTER 3 METHODOLOGY AND CASE STUDY
This chapter briefs about various types of data analysis and theories of machine learning techniques used in business and technology. This proposed research methodology describes step by step procedure of consolidating the collected scaffolding related data into an understandable format, cleaning the data errors by techniques such as outlier’s removal, feature selection etc., visualising the data to learn the data parameters relationship with each other, understanding about different machine learning algorithms used for building the predictive model, and later to evaluate the model using error metrics for verification of the proposed model. Further, the results are briefly discussed.
3.1. Introduction to Data Analysis
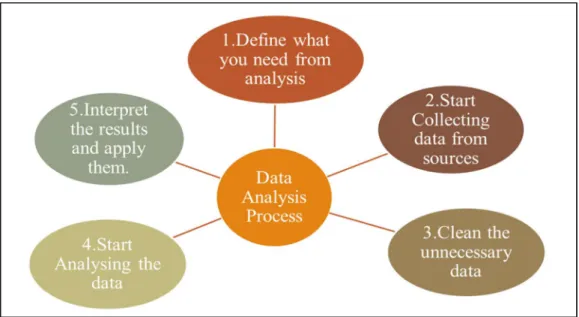
Efficient data analysis helps to get necessary and valuable information from the existing records of data which provides significant benefits to the business and research fields. By carefully analysing the existing information, there are high chances of getting enhanced knowledge from past and present trends of any event or situation. In addition, the data driven decisions are very helpful for all sort of industries and business [36]. The general process of conducting data analysis includes defining of the problem statement, collecting necessary information, cleaning the data, and interpreting its uses for future purposes (Figure 9). Data can be further explored by the help of different statistical analysis and optimizations. There are different kinds of data analysis such as descriptive analysis, diagnostic analysis, predictive analysis and prescriptive analysis [36]. Each of them is discussed below.
22
Figure 9General Data Analysis process 3.1.1. Descriptive Analysis
Descriptive analysis yields the summary or useful statistics in an understandable format for the end users from the raw information. The analysis can be about detailed description of a thing, statement or an event that has already occurred. This type of analysis can be done verbally or statistically or sometimes both. Descriptive analysis would give better results based on individual experiences [36]. Examples of descriptive analysis includes sales overview of the companies, monthly revenue reports.
3.1.2. Diagnostic Analysis
Diagnostic Analysis are sometimes combined with the descriptive analysis. This type of analysis provides with more valuable set of information. The urge to gather more information makes the analysis a little harder to perform. In other words, this type of analysis tries to provide additional information about interconnections associated with an issue. For example, helping the customer to know what is the importance of choosing one product over the other [37].
23 3.1.3. Predictive Analysis
Predictive analysis is performed based on the trends held by the organisation’s existing records. This analysis helps in forecasting the probability of an event occurring in future or estimating the time for the tasks to occur [36].There would be a lot of factors that the outcome would be dependent on. For instance, in the construction domain, particular accident risks can be predicted based on the existing activities responsible for the accidents [37]. Examples of analysis includes sales forecasting, risk assessment [37].The current research is a predictive analysis which helps in forecasting the scaffolding manhours for the upcoming industrial projects.
3.1.4. Prescriptive Analysis
Prescriptive analysis is the step by step explanation process of any situation. This analysis includes a systematic action plan that helps to obtain the required objective. It involves goals, values, policies and strategies to find a solution for the current problem or situation [36].The best example of prescriptive analysis is Artificial Intelligence [36].
3.2. Proposed methodology
The traditional practice for manhours estimation of each scaffolding task is based on scaffolding experts decision, which necessarily need not to be correct always and it is mostly subjective. As discussed earlier, the decision varies from person to person and also from company to company. There might be fluctuations such as the delay of work due to unfavorable temperature, skills of labors or other material related issues which alter the decisions, time and again. Also, few industrial companies claims that some sub-contractors assign the scaffolding manhours based on the trade of work to be carried (first preference would be given to piping), whereas few other companies uses the date of request raised (the early request is considered first) for the scaffolding activity. This often leads to impromptu decisions which would affect the time and cost of the projects adversely. Therefore, this research aims to identify all the
24
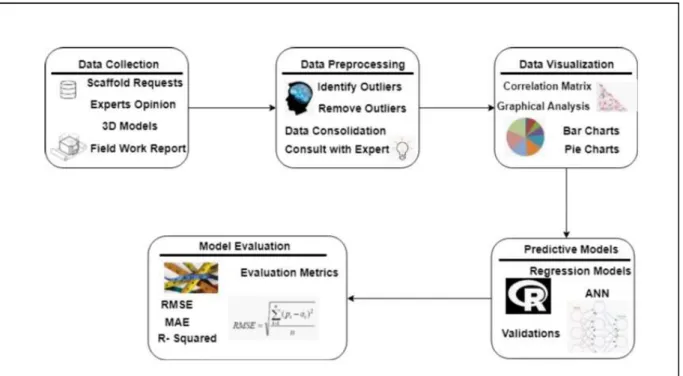
factors that are affecting the scaffolding manhours and find out a technical solution in terms of planning and estimation in order to avoid the excess manhours consumption from the scaffolding activities. A scientific and systematic approach to determine the scaffolding manhours in the planning phase of the project would avoid the ad-hoc way of handling the man power for the scaffolding activities, and also helps the supervisor to have a detailed plan for the associated scaffolding works in any given projects. Hence, predicting the scaffolding manhours using the existing data patterns is considered as the end output in this research because the early predictions during the planning phase would avoid schedule and cost overruns. The derived output (manhour spent on scaffold activities) is based on particular trades, work type, temperature, elevation, and other parameters. The process to achieve this objective, involves different stages which starts from collecting the historical data (scaffolding data) of the project (from a heavy industrial company), data preprocessing which includes cleaning the data and removing the outliers that disturb the data pattern, clustering the data into various groups, selecting the variables using feature selection process, training the data by different algorithms and yielding most accurate models for future predictions.The methodology consists of five main components:
i. Data collection: In general, the scaffolding structures are assigned to any particular trade, location, or as a support for common access in the site area. To perform scaffolding activity, a request has to be raised by trade foreman to the scaffold supervisor of the project. These requests are sent for approval from the site engineer or senior person in the project. Once the requests are approved, the scaffolding structure is built, modified or dismantled in the field. The data related to scaffolding activity is then collected from the construction sites. There would be a scaffold coordinator, responsible for entering these requests and keeping track of the scaffolding progress on site.
25
ii. Data preprocessing: After the data is collected, data preprocessing is conducted to - remove noisy and inconsistent data, merge the data from multiple data sources, clean
and transform the data by removing the obvious outliers in the dataset [38]. The current preprocessing of the scaffolding data involves three steps: (i) consolidating the data received from multiple sources such as payroll, field data; (ii) using mathematical methods such as boxplot and scatter plots to identify outliers; (iii) removing the potential outliers by consulting the scaffolding crew and engineers.
iii. Data visualization – The preprocessed data is further visualized to understand the data in different perspectives, to know the trends of data workflow, also to observe the values in macro level and micro levels. Visualizing the data is done through creating correlation matrices to find the relationship of various factors which are affecting the scaffold manhours. The graphical charts are used to learn the relations between different parameters, proportions of different trades, night time work involved over the project duration, discipline of work, scaffold crew members required for scaffolding activities and other valuable insights.
iv. Predictive models –After understanding the data and its parameters , a predictive model is developed to forecast scaffolding manhours using various mathematical methods, and a comparison is conducted to find out which method is relatively optimal in terms of performance. Various machine learning algorithms are trained to build a model for future predictions.
v. Model Evaluation - The models built are regression type, which recommends different evaluation metrics such as RMSE, MAE and R squared value to find the better performance. These metrics helps to decide best suitable model for predicting scaffold manhours. Based on the existing data, by the aid of machine learning algorithms, it is possible to train and build the predictive models (using machine learning algorithms such
26
as regression and neural networks). The proposed model requires various input parameters that would be responsible for performing each scaffolding task. The built model would provide approximate manhours for scaffolding tasks in future, if the necessary information is fed. The process estimates and keep track of the manhours for scaffolding works and help during the decision-making process to plan efficiently. Each of the data analysis process is further discussed individually in the following sections. The Figure 10 represents the overview of the proposed methodology in this research.
Figure 10 Framework of the proposed work
3.3. Data Collection
Data Collection is the initial step to conduct any data analysis process. Gathering all the necessary data would help in analysing the information and further use that source for getting the data driven and machine based efficient solutions. Collecting the relevant data from the company’s information systems is the preliminary task to start with the data analysis. Numerous discussions were held with the related engineers and experts in the scaffolding field
27
to inquire and gather the necessary information. Generally, the scaffoldings are either built, modified or dismantled for different trades such as piping, civil, electrical, and mechanical. The scaffolding data involves many categorical and quantitative parameters. The quantitative parameters include elevation, temperature, weights of scaffolding materials and so on. The categorical parameters consist information such as the site area, discipline of work (build/modify/dismantle), and trade for which scaffolding is needed. In this research, the data required to conduct the scaffolding data analysis is gathered from three different sources.
i. Field collected scaffolding data: The general procedure for a scaffolding activity is carried out by, the trade foremen requesting to the scaffold supervisor or engineer for resources (labor and material), further the request is carefully assessed by the engineers. These requests are categorized into three types: (i) the new scaffold builds; (ii) modification of existing scaffolding; and (iii) dismantle of the scaffolding. Within each request, the details of the scaffolding activities are recorded. Each request, based on the entered information, has an estimated manhours for the corresponding scaffolding activities. After these activities are conducted, the information about the actually spent hours and used materials are retrieved back to the coordinator or engineer to enter into the system. Those data are tabulated in the spread sheets and other forms for the record maintenance.
ii. Location data: It involves work area volumes, location of work areas where scaffolding is built. The sources to track the location data are 3D models and the cloud based systems within the company.
iii. Progress data: It involves data from other project management systems, such as payrolls, materials list data etc. Such data consists project completion percentage, actual man hours, additional hours, temperature, night time ratio, apprentice ratio, work shifts, quantity of materials used for scaffolding and its weights.
28
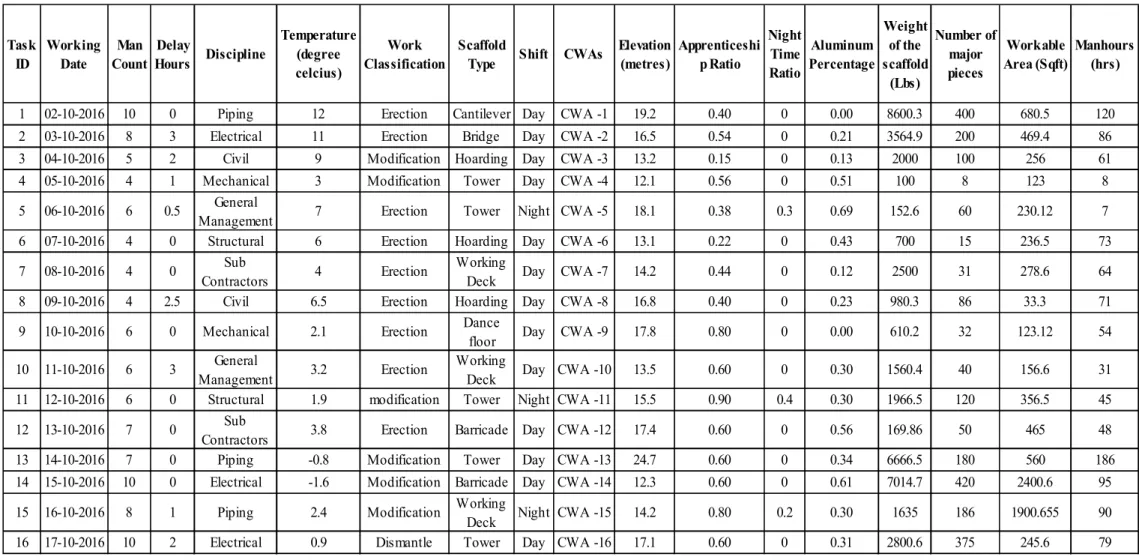
In this research, a heavy industrial project involving multiple trades such as piping, electrical, and civil is considered as the case study to analyse the scaffolding activities. The scaffolding activities carried out for different trades in that particular project has been gathered. The data is further consolidated to a structured pattern by removing outliers, selecting the important parameters and clustering the dataset. To get the effective end results for any data mining process, it is necessary to get the complete data before performing any technical analysis. The particular project considered as case study in this research was completed in a span of 30 months. The scaffold requests details collected for each scaffold task were in separate excel spread sheets. Further, tabulating and extracting the information from multiple tables to one single table were performed using R programming language. All data from the sources were eventually consolidated as a dataset for further data processing. The final single dataset which was considered for this research had around 15000 rows (data points). Each row of information represented a scaffold request and had a unique Task ID. The raw data of the project considered in this research, had 17 parameters. Each of the parameters are briefed in Table 1. There were 5 categorical variables and quantitative parameters. Table 2 represents the sample data set of the project considered for case study. Further, after data collection there is a need to process the data into clean and understandable format. Hence, various statistical methods and logical implementations were used. Each of them are briefed in the next section.
29
Table 1Parameters related to scaffolding data
Categorical Parameters Quantitative Parameters Specific Areas:
Construction areas where scaffolding activities are conducted
Working Date(dd/mm/yyyy)
The start and completion date of the scaffolding task Work Classification:
New build (erection), modification, or dismantle
Actual Manhours (hours)
The tracked actual spent manhours of the scaffolding tasks
Scaffold Type:
Typical types include: Platform deck, tower, barricade etc.
Total Added/Dismantled Weight(lbs)
Weight of the scaffolding materials added or removed from the scaffolding structures.
Discipline:
Discipline of trade work that scaffolding are built/modified for. E.g. Civil, structure, mechanical etc.
Elevation(ft.)
At which height scaffolding activities are conducted relative to ground elevation
Shift :
Day shifts or night shifts of work
Temperature(0 C)
At which temperature the scaffolding tasks were performed on site.
Delay hours (hours)
If there were any delays due to labor or equipment unavailability.
Night Shift Ratio (%)
Percentage of work done in the night for each scaffold task.
Apprenticeship Ratio (%)
Percentage of apprentice labor worked for each scaffold task.
Man count( No.s)
Number of labor required to perform each scaffold task.
Aluminium Percentage (%)
Percentage of aluminium in the scaffold materials used for each scaffold task.
Workable Area (Sqft)
Available work space area to perform each scaffold task.
30
Table 2 Sample data set for scaffolding work Task
ID Working Date CountMan Hours DisciplineDelay
Temperature (degree celcius)
Work
Classification Scaffold Type Shift CWAs Elevation (metres) Apprenticeship Ratio Night Time Ratio Aluminum Percentage Weight of the scaffold (Lbs) Number of major pieces Workable Area (Sqft) Manhours (hrs)
1 02-10-2016 10 0 Piping 12 Erection Cantilever Day CWA -1 19.2 0.40 0 0.00 8600.3 400 680.5 120
2 03-10-2016 8 3 Electrical 11 Erection Bridge Day CWA -2 16.5 0.54 0 0.21 3564.9 200 469.4 86
3 04-10-2016 5 2 Civil 9 Modification Hoarding Day CWA -3 13.2 0.15 0 0.13 2000 100 256 61
4 05-10-2016 4 1 Mechanical 3 Modification Tower Day CWA -4 12.1 0.56 0 0.51 100 8 123 8
5 06-10-2016 6 0.5 ManagementGeneral 7 Erection Tower Night CWA -5 18.1 0.38 0.3 0.69 152.6 60 230.12 7
6 07-10-2016 4 0 Structural 6 Erection Hoarding Day CWA -6 13.1 0.22 0 0.43 700 15 236.5 73
7 08-10-2016 4 0 ContractorsSub 4 Erection Working Deck Day CWA -7 14.2 0.44 0 0.12 2500 31 278.6 64
8 09-10-2016 4 2.5 Civil 6.5 Erection Hoarding Day CWA -8 16.8 0.40 0 0.23 980.3 86 33.3 71
9 10-10-2016 6 0 Mechanical 2.1 Erection Dance floor Day CWA -9 17.8 0.80 0 0.00 610.2 32 123.12 54
10 11-10-2016 6 3 ManagementGeneral 3.2 Erection Working Deck Day CWA -10 13.5 0.60 0 0.30 1560.4 40 156.6 31
11 12-10-2016 6 0 Structural 1.9 modification Tower Night CWA -11 15.5 0.90 0.4 0.30 1966.5 120 356.5 45
12 13-10-2016 7 0 Sub
Contractors 3.8 Erection Barricade Day CWA -12 17.4 0.60 0 0.56 169.86 50 465 48
13 14-10-2016 7 0 Piping -0.8 Modification Tower Day CWA -13 24.7 0.60 0 0.34 6666.5 180 560 186
14 15-10-2016 10 0 Electrical -1.6 Modification Barricade Day CWA -14 12.3 0.60 0 0.61 7014.7 420 2400.6 95
15 16-10-2016 8 1 Piping 2.4 Modification Working Deck Night CWA -15 14.2 0.80 0.2 0.30 1635 186 1900.655 90
31
3.4. Data Preprocessing
According to the data analysis process, the next step after data collection is data pre-processing. Generally the data collected from the large databases will have errors. These errors might be in different forms - (i) incomplete data which has certain missing attributes values, contains aggregate data. (ii) Noisy data which has errors and outliers values that deviates from the larger pattern of data. (iii) Inconsistent data which has discrepancies in the codes, negative or incorrect values. These kinds of errors are quite common in real world databases due to various reasons such as manual entries, multiple people handling the data, computer errors at time, technical limitations while transferring or merging data, incorrect format of entering the parameters and so on[39]. The data which has to be analysed using data mining techniques should be in a clean and consolidated state. The processing of data involves multiple steps such as data cleaning, data integration, data transformation and data reduction. Data cleaning involves filling up the missing values, identifying the outliers and removing them using statistical methods. Data integration is a process of merging data from multiple databases and data transforming is a process of normalising the data to have the uniformity in the distribution of values. Further, data reduction is removing unrelated parameters (by correlation and other feature selection methods) which does not add value to end result of data mining process [39]. In this research, the initial step of data pre-processing, that is data cleaning is done by removing the uncertainties such as missing/incorrect values, duplicated data entries, and removing the potential outliers with the help of statistical methods and expert’s opinion in the company. After the scaffolding work is executed, the manual entry related to the works are tracked and recorded by the particular scaffold foremen or the coordinator. The tracked data might have some errors, such as lack of information about a particular scaffold request or repetitions of the same requests. These values/rows were filled up by understanding job descriptions for each requests and particular scaffold supervisor for the project was contacted for the assistance in
32
removing the rows that had missing values. Due to the errors resulting from the human components in the data collection processes, there are high chances of having outliers in the data that can affect the results of data analysis process.
The data points in the dataset which do not lie in the general behaviour of the model are referred as outliers. They disturb the distribution pattern of any data set [39]. There are various methods of handling the outliers such as least square fitting (regression), standard deviation, interquartile range (IQR), and cook’s distance and so on. In addition, there are visual methods such as scatter plots, boxplots and histograms help to analyze the behaviour of data and identify outliers. However, there is no standard rule that is followed to remove the outliers. In past research, data analysts have tried different approaches to remove outliers from the databases. For example, Negri et al [40] introduced an artificial neural networks (ANNs) based method to estimate the consumption of electrical materials in early stages of construction projects. In their research, higher root-mean-square-error (RMSE) is used as an indicator for outliers (to be specific, 10% of the attributes with the highest RMSE is removed from the dataset to protect the model). Huang et al. [41] have proposed a novel strategy of fusing available redundant measurements of cooling load of multiple-chiller plants to reduce measurement uncertainties, where the Moffat distance is used in consistency checking to remove the outliers. Another example is cluster method for identifying text similarities in construction documents that cluster size is used to identify outliers [42]. Although the past research has addressed outliers from different statistical methods, the outlier removal process remains similar. The first step will be identifying the data points in the dataset that are far from the overall distribution pattern (e.g. by mathematic quantification such as percentage, distance or data sizes); and the next step is to decide the potential outliers by justifying and confirming with the experts who completely understand the data. In this research, an iterative method IQR (Inter Quartile Range) is adopted to identify potential outliers. Further, the scaffolding expert’s opinion was considered for
33
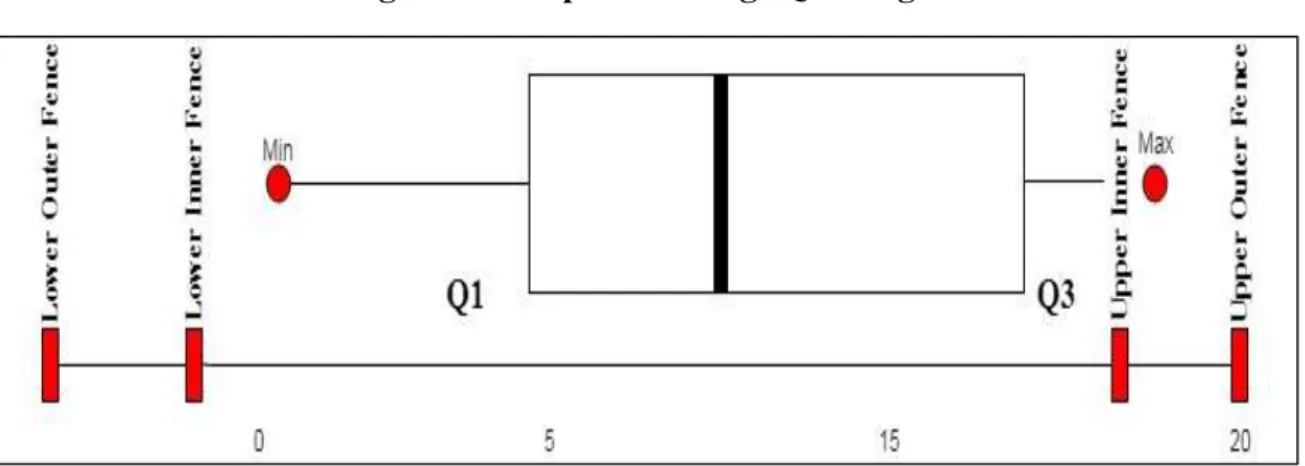
removing outliers. Figure 11 shows the general representation of IQR ranges through the boxplot. To illustrate IQR, the box plot defines lower quartile as the 25th percentile, median as the middle point and upper quartile as the 75th percentile. The difference between the upper quartile (Q3) and the lower quartile (Q1), which spreads over half of the data is referred as IQR.
IQR = Q3 – Q1 ………Eq (1) A point beyond the inner fence on either side is considered a mild outlier. A point beyond the
outer fence is considered an extreme outlier.A potential outlier is a data point that is 1.5 times the IQ range from the edge of the box [39]. IQR method is similar to the standard deviation; however, IQR range is advantageous because they are not affected by the extreme values of data points [43].
Figure 11 Boxplot showing IQR ranges
As mentioned earlier, there are no written rules to remove outliers. However, in this research a set of rules were defined to remove outliers. Since, the scaffolding man hours is the desired output, removing the out of range values from the manhours could be the suitable option. But, in some cases, if the manhours consumption is more may be the work completed in terms of weights or volume would also be more. In this way, it would be inappropriate to remove outliers just based on manhours. Hence, a new parameter, which determines the hourly productivity of the scaffolding works was introduced. The productivity of any construction works is generally
34
measured in terms of duration taken to complete any given task. In this research, productivity is defined as weight of materials carried in each manhour.
Productivity =
( ) ( ) … Eq (2)There were two methods adopted to identify outliers – (i) Statistical method (IQR) and (ii)
Company official’s rule (based on project knowledge). IQR range was established for the
productivity in the data set. The default value of IQR (values less than and more than 1.5*IQR) resulted in removing large amount of data from the data set (almost removal of 3000 rows/data points). Further, when the results were discussed with scaffold officials, removing necessary data just based on analysis of IQR was not accepted. However, it was suggested to try removing the data points with the help of different combinations such as removing data points below 25% and after 75% range of data set. For instance, removing the 5 % of data which was not in the range compared to the rest 95% of the data set. The different probabilities combination such as 20%-80%, 15%-85%, 10%-90%, 5%- 95% could be tried to choose the data set in such a way that there is no unnecessary loss of data. It is worth mentioning that, in real-time data, it is good to seek opinion of experts who know about the data well and assist about the necessity of removing the outliers. In this case study, after identifying the outliers through IQR range, the second approach was to consult with the company’s professional scaffold practitioners. A new set of rules was made by them for removing the potential outliers. The rules set by experts knowledge, removed the data points which fall in the following criteria.
i. The data rows which doesn’t have manhours value and the ones less than 5. ii. The rows which had less than 20 lbs weight.
35
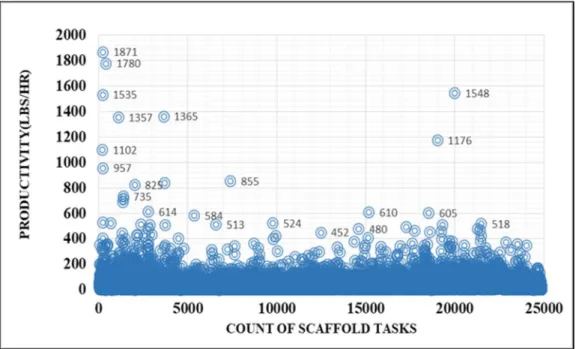
Figure 12 Data set before removing outliers
The Figure 12 above represents the scatter plot of productivity of scaffolding tasks accomplished during the project life cycle. Scatter plots after removing the outliers have a uniform pattern from both company’s set of rules represented in Figure 13(i) and statistical range by IQR represented in Figure 13(ii). Further, the different data sets obtained from each IQR range was trained to build the model and compared with the model developed from the dataset obtained by applying company’s rule. Based on the careful observation, probability range of 5-95% was chosen because the number of data points in this range almost matched the number of data points of company’s rule. Another reason to choose 5-95% range is, the data should not be unnecessarily wasted by removing outliers in extreme ranges. However, all the other probability ranges are further to be checked in the later stages.
36
(i) Data set after removing the outliers (company’s rule)
(ii) Data set after removing the outliers (IQR rule [5-95%]) Figure 13 Scatter plot of Manhours after removal of Outliers.
After removing the outliers the necessary step is to remove the parameters which are not impacting the output variable. Along with the required information, the other project centric details from the data, which does not add value for future predictions were carefully analysed and removed by seeking the scaffold experts’ advice.The scaffolding data set had 5 parameters of categorical type - work area, discipline of the work, work classification, shift and scaffolding type. The ‘work areas’ represented the location of work for only particular project, hence those
![Figure 1 Example of tubular frame Scaffold [11]](https://thumb-us.123doks.com/thumbv2/123dok_us/1357829.2681655/17.892.270.621.712.1049/figure-example-tubular-frame-scaffold.webp)
![Figure 2 Example of tube and clamp Scaffolding [12]](https://thumb-us.123doks.com/thumbv2/123dok_us/1357829.2681655/18.892.268.621.661.1015/figure-example-tube-clamp-scaffolding.webp)
![Figure 4 Example of Tower Scaffolding [14]](https://thumb-us.123doks.com/thumbv2/123dok_us/1357829.2681655/20.892.275.617.493.893/figure-example-of-tower-scaffolding.webp)
![Figure 7 Example of hanger suspended Scaffolding [18]](https://thumb-us.123doks.com/thumbv2/123dok_us/1357829.2681655/22.892.220.671.111.437/figure-example-of-hanger-suspended-scaffolding.webp)