Instructions for use
Title Effect of interseeding cover crops and fertilization on weed suppression under an organic and rotational croppingsystem. 1. Stability of weed suppression over years and main crops of potato, maize and soybean
Author(s) Uchino, Hiroshi; Iwama, Kazuto; Jitsuyama, Yutaka; Ichiyama, Keiko; Sugiura, Eri; Yudate, Toshiko; Nakamura,Satoshi; Gopal, Jai
Citation Field Crops Research, 127, 9-16https://doi.org/10.1016/j.fcr.2011.10.007
Issue Date 2012-02-27
Doc URL http://hdl.handle.net/2115/48660
Type article (author version)
Effect of interseeding cover crops and fertilization on weed suppression under an organic and rotational cropping system
1. Stability of weed suppression over years and main crops of potato, maize and soybean
H. Uchino1, K. Iwama1,*, Y. Jitsuyama1, K. Ichiyama1, E. Sugiura1, T. Yudate1, S. Nakamura1 and J. Gopal2
1
Laboratory of Crop Science, Department of Botany and Agronomy, Graduate School of Agriculture, Hokkaido University, Sapporo, 060-8589, Japan
2
Division of Crop Improvement, Central Potato Research Institute, Shimla, Himachal Pradesh, 171 001, India
*
Corresponding author. Tel.: +81-11-706-3878; fax: +81-11-706-3878. E-mail address: [email protected] (K. Iwama)
Abstract
Interseeding cover crops is an alternative to laborious intertillages and hand weeding followed in organic farming. The objective of this study was to evaluate the effect of fertilization and interseeding cover crops on the growth of main crops and weeds and the stability of weed suppression over years and main crop species under four-year rotational organic farming. Two cover crops, winter rye (Secale cereale L.) and hairy vetch (Vicia villosa Roth), were interseeded in furrows of potato (Solanum tuberosum L.), soybean (Glycine max Merr.) and maize (Zea mays L.) at 3-5 weeks after planting the main crops. The number and dry weight of weeds were measured at the maximum plant height stage of main crops and main crop yields were recorded at their physiological maturity. The light competition between main crops, cover crops and weeds was analyzed by vertical community structure and vegetation cover ratio (VCR) of each
crop. Since light competition of main crops with cover crops and weeds was not severe, main crop yields were not suppressed significantly by either cover crops or weeds. Weed growth was suppressed significantly by interseeding cover crops through increasing the VCR of main crops plus cover crops. This weed suppression by interseeding cover crops was stable to the main crop species in rotational cropping systems and to the various environmental conditions, because the cover crops compensated the low VCR of main crops alone at early growth stage especially when main crop growth was depressed by unfavorable environmental conditions. In addition, input of compost and fermented organic fertilizer had positive effects on the main crop yield and weed suppression. It is concluded, therefore, that weeds can be suppressed effectively and stably without yield reductions of main crops by interseeding cover crops with sufficient fertilization in organic farming systems.
Keywords: cover crop, interseeding, light competition, stability of weed suppression, vegetation cover ratio, vertical community structure
Abbreviations: DAP, days after planting main crops; VCR, vegetation cover ratio; NoF, no fertilizer treatment; NoC, no cover crop treatment; WithC, with cover crop treatment; NoC+W, hand weeding with no cover crop treatment
1. Introduction
Weeds are one of the major threats to crop production in organic farming. The risk of weeds is not only reducing the main crop yields but also decreasing the commercial quality and the feeding palatability of main crops (vanBarneveld, 1999) and increasing the soil seed bank of weeds (Buhler, 1999), which may cause severe weed infestation in subsequent crop production (Uchino et al., 2009). In organic farming systems, weeds are managed by multiple intertillages and hand weedings, but these are labour, time and resource intensive. Hence, better options are needed to manage weeds. One of the options can be the use of cover crops. However, there are reports that cover crops sometimes inhibited not only growth of weeds but also of main crops due to competition between main crops and cover crops (Garibay et al., 1997; Hooks and Johnson, 2001). An understanding of the cover crop’s features and their proper management are necessary for the effective weed control using cover crops (Barberi, 2002).
Cover crop species and/or cultivar is one of the important cover crop’s features. Uchino et al. (2011) compared the effectiveness of nine cover crop species for weed suppression. They reported that winter rye (Secale cereale L.) was the most suitable candidate for interseeding as a cover crop with main crops in a snowy-cold Hokkaido region, located in the northern part of Japan, because of its high weed suppression and relatively low plant height. Among leguminous species, hairy vetch (Vicia villosa Roth) was found to be an effective cover crop for weed suppression. The effectiveness of these cover crops for weed suppression was also reported by Barberi and Mazzoncini (2001) and Teasdale and Daughtry (1993).
Growth pattern is another important feature. Bilalis et al. (2003) reported a negative correlation between weed dry weight and percentage of soil cover by crop residue as one of the parameters of growth pattern. Uchino et al. (2011) also reported that vegetation cover ratio (VCR), which is defined as a percentage of area covered by vegetation to unit soil surface area, correlated significantly and negatively with weed dry weight and concluded that the VCR was an accurate parameter to evaluate weed suppression by cover crops. Since the procedure to measure the VCR is simple and nondestructive, the VCR is very
useful to evaluate the light competition between plants (Rasmussen et al, 2007).
In addition to the VCR, vertical community structure (spatial distribution of leaf and solar radiation) of mixed-species canopy is also used as an indicator to evaluate light competition between plants. For example, Liebman (1989) investigated the vertical community structure of crops (barley (Hordeum
vulgare L.) and pea (Pisum sativum L.)) and weed (white mustard (Brassica hirta Moench.)), and reported
that relative spatial position of each plant species within a mixed-species canopy was one of the important factors affecting light competition and plant growth. The importance of spatial distribution and its effects on the light competition and the dry matter production was well reviewed by Holt (1995).
Cover crop sowing date is one of the important cover crop managements. Abdin et al. (2000) reported that weeds could be suppressed significantly with a little effect on maize yield by sowing cover crops at 10 and 20 days after maize emergence. We also examined previously the effects of cover crop’s sowing dates on the growth of main crops and weeds under organic farming systems (Uchino et al., 2009). In this, cover crops, winter rye and hairy vetch, were sown with main crops, soybean (Glycine max Merr.) and maize (Zea mays L.), respectively, at three different sowing dates (2 weeks before planting main crops, same date with planting main crops and 3 weeks after planting main crops), and it was revealed that weed growth was suppressed sufficiently without significant yield reductions of main crops only when cover crops were sown at 3 weeks after planting the main crops. However, this result was based only on a one-year experiment for each main crop. There is thus need to confirm the stability (i.e. long-term effectiveness) of weed suppression by multiple-year experiments. Barberi (2002) also emphasized the necessity of the long-term (during one or more crop rotation cycles) experiments for evaluating the stability of weed suppression especially in organic farming systems.
The objective of the present study was to evaluate the effect of interseeding cover crops on the growth of main crops and weeds and its stability over four-year organic farming systems. Two cover crops, winter rye and hairy vetch, were interseeded in furrows of three main crops, potato (Solanum tuberosum L.),
soybean and maize, at 3-5 weeks after sowing the main crops. Light competition between main crops, cover crops and weeds was analyzed from the vertical community structure and VCR of each plant species. The effect of fertilization on weed suppression was also discussed by comparing fertilized and unfertilized treatments.
2. Materials and methods
The field experiments were conducted at the Field Science Center for the Northern Biosphere, Hokkaido University (Sapporo, Hokkaido, Japan, 43˚04’ N, 141˚20’ E) from 2003 to 2006. The soil was brown lowland with a pH 6.0-6.2 and approximately 4.5% organic matter prior to starting the experiment. Three main crops, potato, soybean and maize, were grown in organic and rotational cropping systems at two adjacent fields (Fields 1 and 2). The crop sequence of rotational cropping systems is shown in Table 1. Early maturing potato variety ‘Kitaakari’, medium maturing soybean variety ‘Toyomusume’ and early maturing dent flint maize variety for silage ‘39H32’ were used as main crops. These varieties are widely cultivated under conventional farming systems in this region. Winter rye ‘Fuyumidori’ and hairy vetch ‘Mameya’ were used as gramineous and leguminous cover crops, respectively. Sowing dates of main crops and cover crops, which were sown at 3-5 weeks after sowing main crops, are shown in Table 1.
The experiment was arranged as a randomized complete block design with four replications. Each plot was 3 m by 4 m, and consisted of four potato rows planted 75 cm apart with 20 cm between plants or five soybean rows planted 60 cm apart with 20 cm between plants or four maize rows planted 75 cm apart with 18 cm between plants. Cover crop seeds, which were embedded in a seed tape at 5 cm intervals, were sown in furrows of main crops at a rate of 213, 333 and 320 seeds m-2 for potato, soybean and maize, respectively. From 2003 to 2005, four treatments ware conducted as follows: (a) no fertilizer (NoF - compost, fertilizer and cover crops were not applied at all). This was the control treatment to evaluate the effects of compost application on crop productivity and weed dynamics; (b) no cover crop
(NoC - compost and fermented organic fertilizer were applied but cover crops were not sown); (c) winter rye (compost and fermented organic fertilizer were applied and winter rye was sown as a cover crop); and (d) hairy vetch (compost and fermented organic fertilizer were applied and hairy vetch was sown as a cover crop). In each treatment (including NoF and NoC), weeds were removed by single intertillage with ridging (potato) or intertillage (soybean and maize) and hand weeding just before sowing cover crops. In 2006, continuous hand weeding treatment (NoC+W) was examined instead of hairy vetch cover crop in soybean and winter rye cover crop in maize for checking the effect of weeding on main crop productivity. Plots were arranged exactly the same way for four years, i.e., the plot, which was used as NoF in 2003, was continuously used as NoF in successive years.
At two to four weeks before planting of main crops, a fully ripened compost (N: 0.72-0.73%, P2O5: 0.57-0.61%, K2O: 0.84-0.89% w/w in fresh weight) was broadcasted and incorporated to the soil at
60, 50, 40 and 30 t ha-1 in 2003, 2004, 2005 and 2006, respectively. In addition, one t ha-1 of fermented organic fertilizer (N 5 %, P2O5 6 %, K2O 4%) was applied ca. 5 cm below the seeding furrow of the main
crops seeds before planting main crops. Application rate of compost and fermented organic fertilizer for soybean was reduced to half relative to the other main crops because of the nitrogen fixation by soybean. Irrigation was applied at 28 and 33 days after planting main crops (DAP) for maize (total: 42 mm) and at 29 DAP for soybean (23mm) in 2005 and at 1 DAP for maize (19 mm) and 2 DAP (19 mm) for soybean in 2006. Irrigation was not applied in the other years.
At the maximum plant height stage of main crops, the vertical community structure of each plot was determined by the stratified clip method (Monsi and Saeki, 1953) from 2003 to 2005. The measured area was 100 x 75 cm for potato and maize, and 100 x 60 cm for soybean. The leaf areas of main crops, cover crops and weeds were measured at layer -20-0, 0-20, 20-40, 40-60 and 60-80 cm for potato, 0-20, 20-40, 40-60, 60-80 and 80-100 cm for soybean, and 0-50, 50-100, 100-150, 150-200 and 200-250 cm for maize by using an automatic area meter (AAM-9, Hayashi Denko, Tokyo, Japan). For potato, top of the
mounded ridge was considered as a basis of the layer (i.e. 0 cm high), and bottom of the mounded ridge was considered as -20 cm high. Canopy photosynthetically active radiation (PAR) transmittance was measured at -20, 0, 20, 40, 60 and 80 cm above ground for potato, at 0, 20, 40, 60, 80 and 100 cm for soybean, and at 0, 50, 100, 150 and 200 cm for maize by using a PAR line sensor with a length of one meter (LI-191, LI-COR, Lincoln, NE, USA). Dry weights of main crops, cover crops and weeds and the number of weeds were recorded at the maximum plant height stage of main crops from 2003 to 2006. In 2005 and 2006, the vegetation cover ratio (VCR) of main crops, cover crops and weeds was recorded at weekly intervals until canopy closure. The methods followed were as described by Uchino et al. (2009). Yields of main crops were measured at physiological maturity stage of each main crop. The fresh weight of marketable tubers (heavier than 20 g) was recorded for potato, and the dry weight of grains for soybean and maize.
Meteorological data of daily mean air temperature at 150 cm high and precipitation were obtained from the Sapporo District Meteorological Observatory (43˚04’ N, 141˚20’ E). The accumulated effective temperature for dominant weed was calculated as a sum of ‘daily average temperature minus lower threshold temperature of the dominant weed for germination (Wiese and Binning, 1987)’.
Statistical analysis was conducted using the SPSS software (version 14.0J, SPSS Japan). Analysis of variance (ANOVA) was performed as per combined model (McIntosh, 1983). Year and treatment were treated as fixed factors, and replication as a random factor for weed dry weight and weed number at the maximum plant height stage of main crops. The differences between treatments were tested by the least significant difference at 5% level of probability when ANOVA was significant. Correlation coefficients between variables were calculated by Pearson product-moment method.
3. Results
between two cover crop treatments (i.e., winter rye and hairy vetch) for any of the measured variables (data not shown). Therefore, the averaged data of these treatments are presented as cover crop treatment (WithC) from 2003 to 2005. In 2006, the data of winter rye treatment for soybean and hairy vetch treatment for maize are presented as WithC.
3.1. Climatic conditions
The daily average temperature was relatively lower from May to October in 2003, compared to the other three years and 10-year average (Table 2). In particular, the daily average temperature in July was ca. 3 ˚C lower in 2003 than in the 10-year average. As a result, the mean daily temperature during growing period was lower in 2003 than in the other years of potato and soybean crops. The temperature in June was also lower in 2006 than in the other years.
Total precipitation during the growing period was lower in 2003 than in the other years for potato, and also in 2006 than in the other years for soybean and maize. Monthly precipitation was markedly lower in July 2003 and in August and September 2006, compared to 10-year average.
3.2. Weed number and dry weight
The main weed species were redroot pigweed (Amaranthus retroflexus L.), common lambsquarters (Chenopodium album L.), common purslane (Portulaca oleracea L.) and Tufted knotweed
(Persicaria longiseta (De Bruyn) Kitag.). A perennial weed, field horsetail (Equisetum arvense L.) was also
observed. Among these weed species, redroot pigweed and field horsetail grew continuously until physiological maturity stage of the main crops and were dominant throughout the study period.
For the comparison of weed growth between the treatments, the data in NoC+W was omitted from the statistical analysis, because weed growth was zero due to hand weeding done during the growing period.
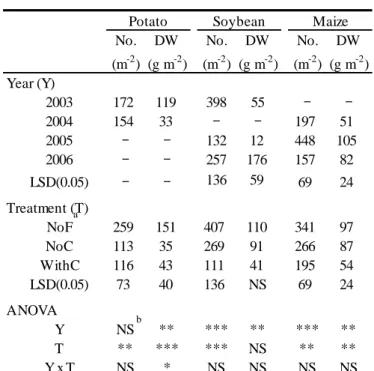
Table 3 shows the weed number and dry weight at the maximum plant height stage of main crops from 2003 to 2006. The main effect of year was significant in all measurements, except in the weed number for potato. The weed dry weight was significantly higher in 2003 than in 2004 for potato. The weed number and weed dry weight in 2005 were the lowest for soybean and the highest for maize in three years.
The main effect of treatment was significant in all measurements, except in the weed dry weight for soybean. The weed number and dry weight were significantly higher in NoF than in WithC for three main crops, indicating the significant weed suppression by the combination of fertilization and interseeding cover crops. There was no significant difference between NoC and WithC in both weed number and weed dry weight for potato. On the other hand, weed number was significantly higher in NoC than in WithC for both soybean and maize, and weed dry weight was significantly higher in NoC than in WithC for maize. Although it is not significant, weed dry weight tended to be higher in NoC than in WithC for soybean. The interaction between year and treatment was significant only in the weed dry weight for potato. It was markedly higher in 2003 than in 2004, particularly in NoF (data not shown).
The variation of weed growth between the main crop species was larger in NoC than in WithC, i.e., the coefficient of variation among main crop species and years in weed dry weight was 64% in WithC but 78% in NoC.
3.3. Vertical community structure
LAI distribution of main crops, cover crops and weeds, and PAR transmittance of each layer at the maximum plant height stage of main crops are shown in Figs 1, 2 and 3 for potato, soybean and maize, respectively. Interaction between year and treatment in LAI of main crops and weeds was significant for potato but not for soybean and maize (data not shown). Therefore, the data of vertical community structure for two years were separated for potato, but combined for soybean and maize.
layer was higher in NoF than in NoC and WithC in both years, causing higher LAI of weeds in NoF than in the other treatments (Fig. 1). The differences of plant height and LAI of main crops between NoC and WithC were very small in both years. When comparing LAI of main crops between two years, it was significantly higher in 2004 than in 2003 for NoC and WithC (p≤0.05), but did not differ significantly for NoF. LAI of weeds was significantly higher in 2003 than in 2004 in all treatments (p≤0.05), especially in NoF. In addition, weeds expanded their leaves at higher layer and, thus, caught more PAR in 2003 than in 2004, probably causing higher weed dry weight in 2003 than in 2004 for potato (Table 3).
For soybean, LAI of main crops did not differ significantly between the three treatments (Fig. 2). LAI of weeds tended to be lower in WithC than in NoF and NoC, probably causing relatively lower weed number and weed dry weight in WithC than in NoF and NoC (Table 3).
For maize, LAI of main crop was significantly lower in NoF than in NoC and WithC, especially at 200-250 cm layer, but did not differ significantly between NoC and WithC (Fig. 3). LAI of weeds was significantly higher in NoF than in WithC, and tended to be higher in NoC than in WithC. These differences between treatments might result in higher weed number and dry weight in NoF and NoC than in WithC (Table 3).
3.4. Vegetation cover ratio of main crops, cover crops and weeds
The VCR of main crops, cover crops and weeds was analyzed on the basis of the accumulated effective temperature for the dominant annual weed, according to Uchino et al. (2009). Lower threshold temperature of redroot pigweed for germination was defined at 10 ˚C (Wiese and Binning, 1987). Table 4 shows the VCR of main crops, cover crops and weeds at 150 ˚C·day after weeding and interseeding cover crops for soybean and maize in 2005 and 2006. This degree day coincided with 45 (soybean) and 40 (maize) DAP in 2005 and with 47(soybean) and 44 (maize) DAP in 2006.
cover crops was lower in 2005 than in 2006. The VCR of main crops plus cover crops for soybean was markedly higher in 2005 than in 2006, causing lower VCR of weeds in 2005.
In 2005, the VCR of main crops did not differ significantly between NoC and WithC for both soybean and maize. The VCR increased slightly by interseeding cover crops in WithC (6.1% for soybean and 4.8% for maize), and the difference in the VCR of main crops plus cover crops between NoC and WithC was still small (4.4% for soybean and 5.0% for maize). The VCR of weeds did not differ significantly between NoC and WithC for both main crops.
In 2006, the VCR of main crops did not differ significantly between NoC, WithC and NoC+W for both soybean and maize. The result shows that the growth of main crops was not suppressed by either cover crops or weeds at the 150 ˚C·day after weeding and interseeding cover crops. The VCR was increased markedly by interseeding cover crops in WithC (10.8% for soybean and 35.7% for maize), and, therefore, the VCR of main crops plus cover crops differed significantly between NoC and WithC for both main crops. However, like in 2005, the VCR of weeds did not differ significantly between NoC and WithC. These results of the VCR of weeds in both years suggest that the effect of interseeding cover crops on the weed growth was obscure at the 150 ˚C·day after weeding and interseeding cover crops.
Although effects of interseeding cover crops on the VCR of weeds were not significant at the 150 ˚C·day after weeding and interseeding cover crops, there is a possibility that interseeding cover crops might had affected the successive weed growth. Fig. 4 shows the relationship between the VCR of main crops plus cover crops at the 150 ˚C·day after weeding and interseeding cover crops (Table 4) and the weed dry weight at the maximum plant height stage of main crops (Table 3) in 2005 and 2006. The VCR of main crops plus cover crops had significantly a negative correlation with weed dry weight for two years, indicating that the VCR of main crops plus cover crops at the early growth stage of main crops strongly affected the successive weed growth.
3.5. Main crop yield
The yields of main crops in each treatment from 2003 to 2005 and in 2006 are shown in Tables 5 and 6, respectively. Main effect of year was significant for potato and soybean: the yields of these main crops were significantly lower in 2003 than in the other years (Table 5). The yields of soybean and maize also tended to be lower in 2006 than in the other years (Table 6). These lower yields of main crops were probably caused by lower air temperature and precipitation in both 2003 and 2006 (Table 2).
Main effect of treatment was significant in all years studied or non-leguminous crops, potato and maize, and only in 2006 for leguminous crop, soybean: the yields of these main crops were significantly lower in NoF than in the other treatments (Tables 5, 6). There was no significant difference between NoC and WithC for all main crops in all years. In addition, the yields of soybean and maize in NoC and WithC did not differ significantly with NoC+W, indicating that main crop yields were not suppressed by either cover crops or weeds in spite of relatively high VCR of cover crops and weeds at the early growth stage (Table 4).
4. Discussion
4.1. Effect of fertilization on weed suppression
Our results indicated the significant weed suppression by fertilization particularly, when comparing weed growth between NoF and NoC (Table 3). This agreed with the study by Olasantan et al. (1994), who showed the significant reduction of weed dry weight by fertilizer application in maize and cassava (Manihot esculenta Crantz) production system. Abu-Irmaileh (1981) also reported the decrease of hemp broomrape (Orobanche ramosa L.) infestation on tobacco (Nicotiana tabacum L.) and tomato
(Lycopersicon esculentum Mill.) by fertilizer application.
However, some studies reported the adverse effect of fertilization on competition between main crops and weeds, e.g., Carlson and Hill (1986) showed the dry weight of weed, wild oat (Avena fatua L.)
was increased by fertilizer application in wheat (Triticum aestivum L.) production system. This discrepancy in the effect of fertilization on crop-weed competition may be attributed to the difference in the response to soil fertility levels among weed species. Blackshaw et al. (2003) compared the response of 23 weed species including wild oat to different nitrogen input and revealed that wild oat increased drastically its shoot biomass as nitrogen input increased compared to other weed species. On the other hand, field horsetail, which was dominant perennial weed in the present study, has advantages in low soil fertility (Andersson and Lundegårdh, 1999), because it can grow from tuber and creeping rhizomes as well as spores, resulting in the significant increase of weed growth without fertilization. It is considered, therefore, that sufficient fertilization is one of the important managements to reduce the risk of severe weed infestation particularly in organic farming fields where field horsetail is dominated.
4.2. The effect of interseeding cover crops on weed suppression
It has been generally reported that growth and seed bank size of weeds varied depending on the main crop species in rotational cropping systems (Buhler et al., 2001). In the present study, although weed growth was suppressed by fertilization as described above, weed growth under no cover crop condition differed largely between three main crops, i.e., weed number and dry weight in NoC were high for soybean and maize but low for potato (Table 3). This low weed growth for potato may be associated with the specific field operation, i.e. ridging, done in potato cultivation. The intertillage with ridging, which is the essential operation for potato to avoid the tuber greening, resulted in the difference of soil surface elevation, i.e., it was about 20 cm higher at the top of the ridge than at the bottom. Weeds, which were emerged near a furrow (i.e., bottom of the ridge) of potato after the ridging, could not capture enough light because of considerably low PAR at -20cm height (Fig. 1), and thus could not grow vigorously. Clements et al. (1996) reported that seed bank size of weeds was less in the ridging system than in the conventional tillage system with moldboard plow. Boydson and Vaughn (2002) also reported that weed growth in potato could be
controlled sufficiently by intertillage with ridging alone compared to standard herbicide weed management. Weed growth for soybean and maize was significantly suppressed by interseeding cover crops (Table 3) and thus the coefficient of variation among main crop species and years in weed dry weight was smaller in WithC than in NoC. This means that interseeding cover crops could suppress the weed growth stably in rotational cropping systems. In addition, a significant effect of treatment and a non-significant effect of the interaction between year and treatment on weed growth (Table 3) indicate that weed suppression by interseeding cover crops was also stable to the different years with various environmental conditions. These stabilities of weed suppression to the main crop species in rotational cropping systems and to the various environmental conditions will be essential to successful inclusion of cover crops into organic farming systems where weed management tools are more limited and laborious compared to conventional production systems.
4.3. The relationship between light competition and weed growth
There was a significant and negative correlation between the VCR of main crops plus cover crops and the weed dry weight (Fig. 4), and the VCR of main crops plus cover crops was increased by fertilization and interseeding cover crops (Table 4). In addition, LAI of main crops plus cover crops was increased and LAI of weeds tended to be decreased by fertilization for potato (Fig. 1) and by interseeding cover crops for soybean and maize (Figs 2, 3). These results show that light competition of main crops and cover crops with weeds affected strongly the weed growth, and the weed suppression (Table 3) was enhanced by the increase of the VCR (and LAI) of main crops plus cover crops by fertilization and interseeding cover crops. Teasdale and Mohler (2000), Bilalis et al. (2003) and Uchino et al. (2009) had also reported that degree of weed suppression depended significantly on the soil cover ratio by main crops and/or cover crops.
precipitation etc.). In the present study, the VCR of main crops alone was lower in 2006, when air temperature in June and precipitation during growing period were low (Table 2), than in 2005, causing higher VCR of weeds in NoC in 2006 than in 2005 (Table 4). The low VCR of main crops alone in 2006 was markedly compensated by high VCR of cover crops in WithC. Our results indicate that the compensatory role of interseeding cover crops (i.e., increasing VCR of main crops plus cover crops and weed suppression) was more effective in the year when the growth of main crops was suppressed more severely, and enhanced the stability of weed suppression to the various environmental conditions. Brennan and Smith (2005) also reported the stable weed suppression for two years by cover crop of mustards
(Brassica juncea (L.) Czern. and Brassica hirta Moench) and positive correlation between VCR of crops
and weed suppression.
The combination of main crop and cover crop species may be one of the important factors causing the stability of weed suppression to various environmental conditions. Main crops used in the present study were summer annual crops, which prefer warm weather, whereas cover crops were winter annual crops, which prefer cool weather. Main crop growth was enhanced in the warm year (Table 2), causing high VCR of main crops alone (Table 4). On the other hand, main crop growth was suppressed but cover crop growth was enhanced in the cool year (Table 2), causing low VCR of main crops alone and marked increase of the VCR of main crops plus cover crops by interseeding cover crops (Table 4). However, our results were based only on the combination of summer main crops with winter cover crops. Therefore, further investigations are needed to validate our hypothesis by comparing, for example, the stability of weed suppression between the combinations of summer main crops with summer cover crops and summer main crops with winter cover crops.
4.4. The relationship between light competition and main crop growth
crops increased the VCR of main crops plus cover crops through expanding cover crop leaves mainly at the bottom layer of plant community (Figs. 1, 2, 3). Since main crops, whose leaves were expanded mainly at the upper layer of plant community, could absorb sufficient light, the growth suppression of main crops due to the light competition with cover crops was small, causing the non-significant yield reduction in WithC compared to NoC+W for soybean and maize (Table 6). Although the yield of potato can not be compared with NoC+W, which was not applied in potato experiments, the reduction of tuber yield by cover crops was considered to be small in the present study. This is because the tuber yields in WithC (Table 5) were almost the same as another report (36.6 to 48.2 t ha-1) (Kawakami et al., 2004), which surveyed previously the yield of same potato variety (i.e., Kitaakari) under conventional farming systems at the same experimental fields as the present study.
In addition to the non-significant difference in yields between WithC and NoC+W, yields in NoC did not differ significantly with NoC+W for soybean and maize and with another report (Kawakami et al., 2004) for potato (Tables 5, 6). This non-significant yield reductions of main crops by weeds may be attributed to the markedly lower LAI and VCR of weeds compared to those of main crops (Table 4; Figs 1, 2, 3), i.e., light interception by weeds was small and, thus, light competition between main crops and weeds was not severe enough to suppress the growth of main crops. In the present study, therefore, the adverse effect of weeds on the main crop yields was small when weeds were removed by intertillage at the early growth stage of main crops.
5. Conclusions
Our four-year study revealed that weed can be suppressed effectively and stably without yield reductions of main crops by interseeding cover crops with sufficient fertilization in organic farming systems. These stabilities of weed suppression were mainly caused by the compensatory role of interseeding cover crops. It cannot be disregarded, however, that our results were based only on the field
which was dominated by a few specific weeds (i.e, redroot pigweed and field horsetail), and, therefore, further investigations were needed to confirm the stability of weed suppression to the various dominant weed species and to generalize the usefulness of interseeding cover crops as an effective weed management tool.
Acknowledgements
We thank Mr. S. Ichikawa and Mr. N. Moki of the Field Science Center for the Northern Biosphere, Hokkaido University, for field managements.
References
Abdin, O.A., Zhou, X.M., Cloutier, D., Coulman, D.C., Faris, M.A., Smith, D.L., 2000. Cover crops and interrow tillage for weed control in short season maize (Zea mays). Eur. J. Agron. 12, 93-102.
Abu-Irmaileh, B.E., 1981. Response of hemp broomrape (Orobanche ramosa) infestation to some nitrogenous compounds. Weed Sci. 29, 8-10.
Andersson, T.N., Lundegårdh, B., 1999. Growth of field horsetail (Equisetum arvense) under low light and low nitrogen conditions. Weed Sci. 47, 41-46.
Barberi, P., 2002. Weed management in organic agriculture: are we addressing the right issues? Weed Res. 42, 177-193.
Barberi, P., Mazzoncini, M., 2001. Changes in weed community composition as influenced by cover crop and management system in continuous corn. Weed Sci. 49, 491-499.
Bilalis, D., Sidiras, N., Economou, G., Vakali, C., 2003. Effect of different levels of wheat straw soil surface coverage on weed flora in Vicia faba crops. J. Agron. Crop Sci. 189, 233-241.
Blackshaw, R.E., Brandt, R.N., Janzen, H.H., Entz, T., Grant, C.A., Derksen, D.A., 2003. Differential response of weed species to added nitrogen. Weed Sci, 51, 532-539.
Boydston, R.A., Vaughn, S.F., 2002. Alternative weed management systems control weeds in potato (Solanum tuberosum). Weed Technology 16, 23-28.
Brennan, E.B., Smith, R.F., 2005. Winter cover crop growth and weed suppression on the central coast of California. Weed Technol. 19, 1017-1024.
Buhler, D.D., 1999. Weed population responses to weed control practices. I. Seed bank, weed populations, and crop yields. Weed Sci. 47, 416-422.
Buhler, D.D., Kohler, K.A., Thompson, R.L., 2001. Weed seed bank dynamics during a five-year crop rotation. Weed Technol. 15, 170-176.
Carlson, H., Hill, J., 1986. Wild oat (Avena fatua) competition with spring wheat: effects of nitrogen fertilization. Weed Sci. 34, 29-33.
Clements, D.R., Benott, D.L., Murphy, S.D., Swanton, C.J., 1996. Tillage effects on weed seed return and seedbank composition. Weed Sci. 44, 314-322.
Garibay, S.V., Stamp, P., Ammon, H.U., Feil, B., 1997. Yield and quality components of silage maize in killed and live cover crop sods. Eur. J. Agron. 6, 179-190.
Holt, J.S., 1995. Plant responses to light: A potential tool for weed management. Weed Sci. 43, 474-482.
Hooks, C.R.R., Johnson, M.W., 2001. Broccoli growth parameters and level of head infestations in simple and mixed plantings: Impact of increased flora diversification. Ann. Appl. Biol. 138, 269-280.
Kawakami, J., Iwama, K., Jitsuyama, Y., Zheng, X., 2004. Effect of cultivar maturity period on the growth and yield of potato plants grown from microtubers and conventional seed tubers. Am. J. Potato Res. 81, 327-333.
Liebman, M., 1989. Effects of nitrogen-fertilizer, irrigation, and crop genotype on canopy relations and yields of an intercrop weed mixture. Field Crops Res. 22, 83-100.
Monsi, M., Saeki, T., 1953. Über den Lichtfactor in den Pflanzengesellschaften und seine Bedeutung für die Stoffproduktion. Jpn. J. Bot. 14, 22-52.
Olasantan, F., Lucas, E., Ezumah, H., 1994. Effects of intercropping and fertilizer application on weed control and performance of cassava and maize. Field Crops Res. 39, 63-69.
Rasmussen, J., Norremark, M. and Bibby, B. M. 2007. Assessment of leaf cover and crop soil cover in weed harrowing research using digital images. Weed Res. 47, 299-310.
Teasdale, J.R., Daughtry, C.S.T., 1993. Weed suppression by live and desiccated hairy vetch
(Vicia villosa). Weed Sci. 41, 207-212.
Teasdale, J.R., Mohler, C.L., 2000. The quantitative relationship between weed emergence and the physical properties of mulches. Weed Sci. 48, 385-392.
Uchino, H., Iwama, K., Jitsuyama, Y., Ichiyama, K., Sugiura, E., Yudate, T., 2011. Stable characteristics of cover crops for weed suppression in organic farming systems. Plant Prod. Sci. 14, 75-85.
Uchino, H., Iwama, K., Jitsuyama, Y., Yudate, T., Nakamura, S., 2009. Yield losses of soybean and maize by competition with interseeded cover crops and weeds in organic-based cropping systems. Field Crops Res. 113, 342-351.
vanBarneveld, R.J., 1999. Physical and chemical contaminants in grains used in livestock feeds. Aust. J. Agr. Res. 50, 807-823.
Wiese, A.M., Binning, L.K., 1987. Calculating the threshold temperature of development for weeds. Weed Sci. 35, 177-179.
2003 2004 2005 2006 Field 1
Main crop species potato maize soybean maize Sowing date of main crop 4-May 20-May 26-May 18-May Sowing date of cover crop 11-Jun 18-Jun 23-Jun 8-Jun Field 2
Main crop species soybean potato maize soybean Sowing date of main crop 22-May 6-May 21-May 18-May Sowing date of cover crop 24-Jun 10-Jun 15-Jun 15-Jun
Year
Table 1. The cropping sequence and sowing dates of main crops and cover crops
Table 2. Monthly average air temperature and precipitation during growing period (from sowing to physiological maturity) of the main crops.
2003 2004 2005 2006 1997-2006 2003 2004 2005 2006 1997-2006 Month May 12.9 13.8 10.7 12.9 12.9 31 76 62 45 57 June 17.1 18.5 18.3 15.7 16.8 69 58 51 77 55 July 17.7 21.3 20.1 20.6 20.8 29 71 119 107 106 August 20.7 21.9 23.5 24.3 22.2 91 128 114 37 109 September 17.5 18.4 18.8 18.5 18.3 111 127 126 58 151 October 11.6 12.5 13.2 11.7 12.1 150 46 72 91 86
Mean or total during growing period of each main crop
Potato 16.0 19.0 - - - 129 192 - -
-Soybean 18.0 - 20.1 19.3 - 321 - 411 297
-Maize - 20.0 20.1 19.5 - - 332 391 279
Table 3. The number (No.) and dry weight (DW) of weeds at the maximum plant height stage of main crops.
No. DW No. DW No. DW
(m-2) (g m-2) (m-2) (g m-2) (m-2) (g m-2) Year (Y) 2003 172 119 398 55 - -2004 154 33 - - 197 51 2005 - - 132 12 448 105 2006 - - 257 176 157 82 LSD(0.05) - - 136 59 69 24 Treatment (T) NoF 259 151 407 110 341 97 NoC 113 35 269 91 266 87 WithC 116 43 111 41 195 54 LSD(0.05) 73 40 136 NS 69 24 ANOVA Y NS ** *** ** *** ** T ** *** *** NS ** ** Y x T NS * NS NS NS NS
Potato Soybean Maize
a
Abbreviations of treatments: NoF, no fertilizer ; NoC, no cover crop ; WithC, with cover crop .
b
* Significant at 5% level of probability; ** Significant at 1% level of probability; *** Significant at 0.1% level of probability; NS: not significant.
a
Table 4.The vegetation cover ratio (%) of main crops, cover crops and weeds at 150 ˚C·day after weeding and interseeding cover crops for soybean and maize.
a
Abbreviations of treatments: NoF, no fertilizer ; NoC, no cover crop ; WithC, with cover crop ; NoC+W, hand weeding with no cover crop.
b
NS: not significant.
b a
Main crop Cover
crop
Main crop + cover crop
Weed Main crop Cover
crop Main crop + cover crop Weed 2005 NoF 56.6 - 56.6 1.2 30.9 - 30.9 8.3 NoC 64.6 - 64.6 0.3 49.2 - 49.2 4.7 WithC 62.9 6.1 69.0 0.4 49.3 4.8 54.2 2.4 LSD(0.05) NS - 4.2 NS 8.9 - 8.5 2.9 2006 NoF 28.6 - 28.6 18.5 21.7 - 21.7 13.4 NoC 43.1 - 43.1 13.0 29.3 - 29.3 15.0 WithC 42.1 10.8 52.9 5.7 31.2 35.7 67.0 8.7 NoC+W 44.3 - 44.3 2.9 28.9 - 28.9 0.5 LSD(0.05) 7.9 - 8.5 8.3 6.2 - 5.8 7.9 Soybean Maize Year and treatment
Table 5.Tuber fresh weight (t ha-1) of potato and grain dry weights (t ha-1) of soybean and maize.
Potato
Soybean
Maize
Year (Y)
2003
30.3
2.51
-2004
36.3
-
8.57
2005
-
4.65
8.28
Treatment (T)
NoF
19.1
3.55
5.85
NoC
39.6
3.52
9.96
WithC
41.3
3.67
9.47
LSD(0.05)
5.3
NS
0.61
ANOVA
Y
**
***
NS
T
***
NS
***
Y x T
NS
NS
NS
aAbbreviations of treatments: NoF, no fertilizer ; NoC, no cover crop ; WithC, with cover crop .
b
** Significant at 1% level of probability; *** Significant at 0.1% level of probability; NS: not significant.
b a
Treatment Soybean Maize NoF 1.98 4.13 NoC 3.02 9.01 WithC 3.07 9.15 NoC+W 3.62 8.61 mean 2.92 7.73 LSD(0.05) 0.95 1.83
Table 6. Grain dry weights (t ha-1) of soybean and maize in each treatment in 2006.
a
Abbreviations of treatments: NoF, no fertilizer ; NoC, no cover crop ; WithC, with cover crop ; NoC+W, hand weeding with no cover crop.
Figure captions
Fig. 1. Leaf area index (LAI) and photosynthetically active radiation (PAR) transmittance at each height at the maximum plant height stage of potato in 2003 (a-c) and 2004 (d-f).
(a, d) no fertilizer treatment; (b, e) no cover crop treatment; (c, f) cover crop treatment. White bar, main crops; Gray bar, cover crops; Black bar, weeds. Open circle and solid line, PAR transmittance. MC, main crop; CC, cover crop; W, weed. Each LAI value indicates the mean ± standard error (n = 4).
Fig. 2. Leaf area index (LAI) and photosynthetically active radiation (PAR) transmittance at each height at the maximum plant height stage of soybean.
The data are average of 2003 and 2005 because interaction between year and treatment for LAI of main crops and weeds was not significant. (a) no fertilizer treatment; (b) no cover crop treatment; (c) cover crop treatment. White bar, main crops; Gray bar, cover crops; Black bar, weeds. Open circle and solid line, PAR transmittance. MC, main crop; CC, cover crop; W, weed. Each LAI value indicates the mean ± standard error (n = 4).
Fig. 3. Leaf area index (LAI) and photosynthetically active radiation (PAR) transmittance at each height at the maximum plant height stage of maize.
The data are average of 2004 and 2005 because interaction between year and treatment for LAI of main crops and weeds were not significant. (a) no fertilizer treatment; (b) no cover crop treatment; (c) cover crop treatment. White bar, main crops; Gray bar, cover crops; Black bar, weeds. Open circle and solid line, PAR transmittance. MC, main crop; CC, cover crop; W, weed. Each LAI value indicates the mean ± standard error (n = 4).
Fig. 4 The relationship between the vegetation cover ratio (VCR) of main crops plus cover crops at the 150 ˚C·day after weeding and interseeding cover crops and the weed dry weight at the maximum plant height of main crops in 2005 and 2006.
-20 0 20 40 60 80 -20 0 20 40 60 80 2 1 0 0 1 2 0 1 2 0 50 100 100 50 0 100 50 0 2 1 0 0 1 2 0 1 2 0 50 100 100 50 0 100 50 0 LAI PAR transmittance (%) P la n t he igh t (c m ) NoF 2003 NoF 2004 NoC 2003 NoC 2004 WithC 2003 WithC 2004 Total LAI MC CC W 4.21±0.29 0.12±0.02 0.10±0.02 Total LAI MC CC W 1.26±0.15 0.00±0.00 1.39±0.24 Total LAI MC CC W 2.82±0.13 0.00±0.00 0.39±0.10 Total LAI MC CC W 2.84±0.07 0.24±0.04 0.53±0.09 Total LAI MC CC W 1.33±0.15 0.00±0.00 0.47±0.03 Total LAI MC CC W 3.93±0.14 0.00±0.00 0.09±0.02
0 20 40 60 80 100 0 0.5 1.0 2.5 0 50 100 100 50 0 100 50 0 PAR transmittance (%) Total LAI MC CC W 4.36±0.20 0.00±0.00 0.56±0.13 2.0 1.5 0 0.5 1.0 1.5 2.0 2.5 0 0.5 1.0 1.5 2.0 2.5 LAI P la n t he igh t (c m ) Total LAI MC CC W 4.92±0.30 0.00±0.00 0.44±0.10 Total LAI MC CC W 4.75±0.19 0.56±0.22 0.19±0.06
0 50 100 150 200 250 0 0.5 1.0 0 50 100 100 50 0 100 50 0 PAR transmittance (%) Total LAI MC CC W 3.34±0.09 0.00±0.00 0.70±0.09 1.5 LAI P la n t he igh t (c m ) Total LAI MC CC W 4.13±0.12 0.00±0.00 0.61±0.04 Total LAI MC CC W 4.07±0.06 0.41±0.04 0.48±0.08 1.0 0.5 0 1.5 0 0.5 1.0 1.5
VCR of main crops plus cover crops (%) 0 50 100 0 W ee d d ry w ei gh t (g m -2 ) 50 100 150 200 250 r = -0.70 p = 0.01 (n = 12)