Discovery of High-Confidence Single Nucleotide Polymorphisms from
Large-Scale
De Novo
Analysis of Leaf Transcripts of
Aegilops tauschii
,
A Wild Wheat Progenitor
JULIO CESAR MASARUIehisa1,†, AKIFUMI Shimizu2,†, KAZUHIRO Sato3, SHUHEINasuda4, and SHIGEOTakumi1,* Laboratory of Plant Genetics, Graduate School of Agricultural Science, Kobe University, Nada-ku, Kobe 657-8501, Japan1; Department of Biological Resources Management, School of Environmental Science, University of Shiga Prefecture, Shiga, Hikone 522-8533, Japan2; Institute of Plant Science and Resources, Okayama University, Kurashiki 710-0046, Japan3and Laboratory of Plant Genetics, Graduate School of Agriculture, Kyoto University, Kyoto 606-8502, Japan4
*To whom correspondence should be addressed. Tel. þ81 78-803-5860. Fax. þ81 78-803-5860.
Email: [email protected] Edited by Masahiro Yano
(Received 10 April 2012; accepted 4 October 2012)
Abstract
Construction of high-resolution genetic maps is important for genetic and genomic research, as well as for molecular breeding. Single nucleotide polymorphisms (SNPs) are the predominant class of genetic variation and can be used as molecular markers. Aegilops tauschii, the D-genome donor of common wheat, is considered a valuable genetic resource for wheat improvement. Our previous study implied thatAe. tauschiiaccessions can be genealogically divided into two major lineages. In this study, the tran-scriptome of twoAe. tauschii accessions from each lineage, lineage 1 (L1) and 2 (L2), was sequenced, yielding 9435 SNPs and 739 insertion/deletion polymorphisms (indels) after de novo assembly of the reads. Based on 36 contig sequences, 31 SNPs and six indels were validated on 20 diverse Ae. tauschii
accessions. Because almost all of the SNP markers were polymorphic between L1 and L2, and the D-genome donor of common wheat is presumed to belong to L2, these markers are available for D-genome typing in crosses between common wheat varieties and L1-derived synthetic wheat. Due to the conserved synteny between wheat and barley chromosomes, the high-density expressed sequence tag barley map and the hypothetical gene order in barley can be applied to develop markers on target chromosomal regions in wheat.
Key words: Aegilops tauschii; expression sequence tag; next generation sequencing; single nucleotide polymorphism; wheat
1. Introduction
Common wheat (Triticum aestivumL., genome
con-stitution AABBDD) is an allohexaploid species that arose by natural hybridization between tetraploid
wheat Triticum turgidum L. (AABB), including emmer
and durum wheats, and a diploid wild wheat relative
Aegilops tauschii Coss. (DD).1,2 Ae. tauschii is widely distributed in Eurasia and shows abundant genetic
variation.3–11 Population structure analyses revealed
two major phylogenetic lineages and an HG17
minor lineage [haplogroup lineage (HGL) 17] in Ae.
tauschii.12 In turn, the major lineages 1 (L1) and 2 (L2) can be genealogically divided into six and three
sublineages, respectively. It is supposed that the Ae.
†
These authors contributed equally to this work.
#The Author 2012. Published by Oxford University Press on behalf of Kazusa DNA Research Institute.
This is an Open Access article distributed under the terms of the Creative Commons Attribution Non-Commercial License (http://
creativecommons.org/licenses/by-nc/3.0/), which permits unrestricted non-commercial use, distribution, and reproduction in any medium, provided the original work is properly cited.
Advance Access publication on 2 November 2012
at Okayama University on March 24, 2014
http://dnaresearch.oxfordjournals.org/
tauschiipopulations involved in the origin of common wheat are limited to a narrow distribution range, ap-parently restricted to L2, which has given rise to a
founder effect in hexaploid wheat.12,13In fact, the
D-genome of common wheat is less polymorphic than
the A- and B-genomes.14–16 Tetraploid wheat and
Ae. tauschii can be crossed artificially to produce
syn-thetic hexaploid wheat.17,18 These synthetics can be
used as intermediates to exploit the natural variation ofAe. tauschiiin hexaploid wheat improvement.19
High-resolution genetic map construction is im-portant for genetic and genomic research, as well as
for molecular breeding.20 In wheat, genetic maps
are commonly constructed using simple sequence
repeats (SSR) markers,21,22 but the number of SSR
markers reported in public databases such as the
National BioResource Project (NBRP) KOMUGI
website (http://www.shigen.nig.ac.jp/wheat/komugi/
strains/aboutNbrpMarker.jsp) and GrainGene website
(http://wheat.pw.usda.gov/GG2/maps.shtml) is not
sufficient for high-resolution maps. Although SSR are the most popular marker system, the constructed map resolution remains low in plant species without a known genome sequence. An alternative marker system, single nucleotide polymorphism (SNP), has received considerable attention because it is the
predominant class of genetic variation.23
High-throughput SNP-typing systems can be developed for organisms with a reference genome or comprehensive
expressed sequence tag (EST) database, e.g. barley.24But,
in many plants having large and complex genomes and insufficient reference information, genome-wide SNP discovery is insufficient because of the presence of
highly repetitive regions. In Ae. tauschii, an organism
without a reference genome and composed of highly repetitive regions, annotation-based genome-wide SNP discovery has been developed to overcome these problems. In this strategy, Roche 454 shotgun reads with low genome coverage of one genotype were annotated, and then genomic and cDNA shotgun reads of another genotype were generated on SOLiD or Solexa platforms to identify putative SNPs. However, around 56% of the sequence length, characterized as a repetitive region, was excluded
from the analysis.25
In the present study, RNA-seq, a next generation se-quencing technology for transcripts, was used as a cost-effective, simpler means of SNP discovery than
annotation. SNPs, insertion/deletion polymorphisms
(indels), and SSRs were discovered from de novo
as-sembly data from ESTs of two Ae. tauschiiaccessions,
PI476874 (L1) and IG47182 (L2), that were mapped
on an SSR linkage map using an F2 population.26 We
show that SNP markers can be developed in a chromo-somal region of interest using the low-coverage
genome sequence of wheat chromosome 7D27 or
barley GenomeZipper results obtained from a synteny
model conserved among barley, Brachypodium, rice,
and sorghum.28
2. Materials and methods
2.1. Plant material, RNA extraction, and next generation sequencing
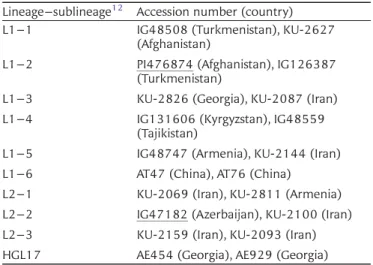
TwentyAe. tauschiiaccessions from each sublineage
were used (Table 1). Two Ae. tauschii accessions,
PI476874 from the L1-2 sublineage and IG47182 from the L2-2 sublineage, were used for cDNA se-quencing. Total RNA was isolated from leaves of 21-day-old seedlings using an RNeasy Plant Mini Kit (QIAGEN, Hilden, Germany). mRNA was isolated
from 45mg of RNA using an mRNA Purification Kit
(Takara-Bio, Ohtsu, Japan). A 200 ng aliquot of mRNA was used to fragment the mRNA and synthesize cDNA from it using a cDNA Synthesis System (Roche
Diagnostics, Mannheim, Germany). Approximately 108
adapter-ligated cDNA molecules from the samples were used for library preparation using a GS FLX Titanium Rapid Library Preparation Kit (Roche Diagnostics). The library was sequenced with a GS FLX Titanium Sequencing Kit on a GS FLX System (Roche Diagnostics) according to the manufacturer’s instructions. Files containing raw sequence data were deposited in the sequence read archive of the DNA Data Bank of Japan (accession number: DRA000536).
2.2. Assembly, SNP and indel discovery, and SSR mining
All reads from both accessions were pooled andde
novo assembled with the GS de novo assembler
algo-rithm (Newbler) version 2.6 (Roche Diagnostics) to
Table 1. Lineage, sublineage, accession number, and origin ofAe. tauschiiaccessions used in this study
Lineage–sublineage12 Accession number (country)
L1–1 IG48508 (Turkmenistan), KU-2627 (Afghanistan)
L1–2 PI476874 (Afghanistan), IG126387 (Turkmenistan)
L1–3 KU-2826 (Georgia), KU-2087 (Iran) L1–4 IG131606 (Kyrgyzstan), IG48559
(Tajikistan)
L1–5 IG48747 (Armenia), KU-2144 (Iran) L1–6 AT47 (China), AT76 (China) L2–1 KU-2069 (Iran), KU-2811 (Armenia) L2–2 IG47182 (Azerbaijan), KU-2100 (Iran) L2–3 KU-2159 (Iran), KU-2093 (Iran) HGL17 AE454 (Georgia), AE929 (Georgia)
Underlining indicates the accessions used for RNA-seq.
at Okayama University on March 24, 2014
http://dnaresearch.oxfordjournals.org/
generate reference contig sequences. During assem-bly, primer sequences and poly-A tails were trimmed from raw reads, and parameters of a minimum overlap length of 40 bp and minimum overlap iden-tity of 90% were used. SNPs and indels were discov-ered by aligning all individual reads to the reference contig sequences using GS Reference Mapper version 2.6 (Roche Diagnostics). Only the accession-specific sequence variants (supported by at least two reads) were extracted as true polymorphisms from ‘All’ and ‘HC’ sequence differences produced by the GS Reference Mapper. SSR motifs within the reference contig sequences were identified by Sputnik software
(http://espressosoftware.com/sputnik/index.html),
and indels were searched for within these motifs to extract polymorphic SSRs.
2.3. Gene annotation and analysis of synonymous and non-synonymous mutations
The reference sequences were aligned with the
National Center for Biotechnology Information
(NCBI) non-redundant (nr) protein database and the
Brachypodium distachyon (version 1.2, ftp://ftpmips.
helmholtz-muenchen.de/plants/brachypodium/v1.2),
rice (RAP-DB, http://rapdb.dna.affrc.go.jp/), and wheat
TriFLDB protein databases (http://trifldb.psc.riken.jp/
index.pl) using BlastX with an E-value cutoff of 1023.
Gene ontology (GO) terms were assigned using
Blast2GO29and a locally installed database based on
BlastX hits against the NCBI nr database.
To study whether the discovered SNPs and indels affect amino acid sequences, the longest open reading frames (ORFs) of the isotigs that include all the 1793 contigs with high confidence (HC) polymorphism
were extracted using EMBOSS.30 The isotigs without
any BlastX result, described above, were excluded from analysis. Only the ORFs supported by the BlastX search were selected.
2.4. SNP and SSR validation
Validation of identified SNPs was performed through cleaved amplified polymorphic sequence (CAPS), derived CAPS (dCAPS), and high-resolution melting (HRM) methods. Gene-specific primer sequences, SNP locations, product length, and restriction enzymes are summarized in Supplementary Table S1. dCAPS primers were designed using the dCAPS Finder 2.0
program available on the website http://helix.wustl.
edu/dcaps/dcaps.html.31 The polymerase chain
reac-tion (PCR) condireac-tions for CAPS and dCAPS markers
were 1 cycle of 948C for 2 min and 40 cycles of
948C for 30 s, 608C (for CAPS) or 568C (for dCAPS)
for 30 s, and 688C for 30 s. HRM analysis was
per-formed using a LightCycler 480 Real-Time PCR
System and LightCycler 480 HRM Master 2reagents
(Roche Diagnostics) according to our previous study.32
For HRM analysis, all samples were spiked with 10– 50% of PI476874 DNA to facilitate discrimination of the homozygous genotype. All PCR products were checked on a 1.5% agarose gel to ensure the presence of a single band.
SSR markers, depending on the indel length (see section 3.4), were amplified following the same condi-tions for CAPS markers or were analysed by HRM as described above. The polymorphic information content (PIC) was calculated using Excel Microsatellite toolkit
add-in software.33
2.5. Comparison of HC SNPs and previously reported SNP dataset
For all of the 4337 HC SNPs, 100 bp sequences were extracted from 1748 contigs, positioning SNPs in the middle of the sequence. These sequences
were BlastN searched against Ae. tauschii gene
sequences with SNPs (E-value cutoff of 10 and gap
ex-tension penalty of 0) reported previously and
pub-lished at http://avena.pw.usda.gov/wheatD/agsnp.
shtml.25
2.6. Linkage map construction
A set of 104 F2 individuals derived from a cross
between PI476874 and IG47182 was used as the mapping population. A total of 19 cfd, 21 barc, 17 wmc, 20 gwm, 8 gdm, and 2 hbg SSR markers
(http://wheat.pw.usda.gov/GG2/index.shtml, http://nics.
naro.affrc.go.jp/team/dna_marker/) were assigned to
each chromosome as anchor markers. A genetic map
was constructed using MAPMAKER/EXP version 3.0b.34
The genetic distances were calculated with the
Kosambi function.35
2.7. In silico mapping of contigs with HC SNPs on virtual barley chromosomes
Shotgun barley genomic reads mapped on the virtual barley chromosomes were extracted from flow-sorted chromosome reads submitted by Mayer
et al.28 (accession number ERP000445). The tBlastX algorithm was used to align the 1793 contigs with extracted barley genomic reads and against a set of 5006 full-length cDNAs (accession numbers
AK248134 to AK253139),36 and a set of 23623
full-length cDNAs (accession numbers AK353559 to
AK377172),37 with an E-value cutoff of 1021. The
Blast search results obtained against Brachypodium
and rice database were also used (see section 2.3).
at Okayama University on March 24, 2014
http://dnaresearch.oxfordjournals.org/
3. Results and discussion
3.1. Sequencing and assembly of Ae. tauschii ESTs
To see how many SNPs could be discovered in one RNA-seq experiment between two phylogenetically
distinct Ae. tauschii accessions, PI476874 and
IG47182 (respectively from L1 and L2) were selected. The sequencing of leaf cDNA libraries produced 669 383 and 700 124 reads corresponding, res-pectively, to 247 Mb and 254 Mb per accession after trimming. All reads from both accession-derived li-braries were assembled using Newbler 2.6. Newbler assembled reads into a contig representing transcript regions, isotigs (sets of contigs representing a partial or entire transcript), and isogroups (sets of isotigs). During the assembly process, Newbler constructed
multiple alignments of overlapping reads and
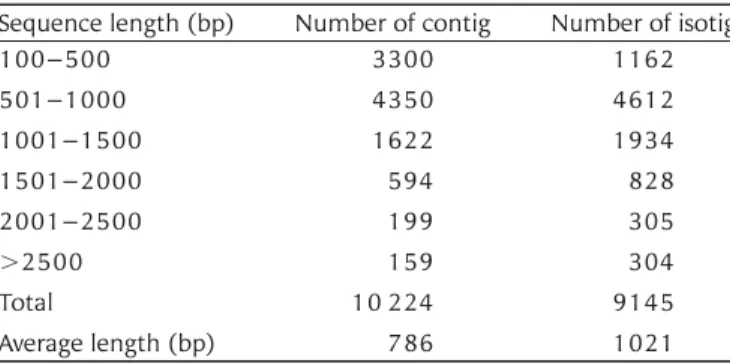
divided them into consistent sequences, i.e. contigs. Alignments that cannot be divided are collected as isogroups, and branching structures between them are searched by traversal paths through connected branches, i.e. isotigs (isotigs and isogroups are Newbler-specific terms). Different isotigs within the same isogroup represent alternative splicing variants. Thus, an isogroup represents genes, isoforms, or gene families. In this study, sequences shorter than 100 bp were excluded from the following analyses. A total of 10 224 contigs were assembled into 9145 isotigs (including some contigs that were not com-bined into isotigs), with a total of 7753 isogroups obtained. The length of the majority of contigs and isotigs ranged between 500 and 1000 bp, with an average of 786 and 1021 bp, respectively
(Table 2). However, among isotigs, a sequence length
as long as 11 328 bp was found (isotig02315),
which showed sequence similarity to aBrachypodium
distachyon E3 ubiquitin-protein ligase UPL1-like
protein (XP_003575554.1,E-value¼0).
For functional gene annotation, isotigs were reas-sembled to remove redundancy and to obtain longer transcripts using CAP3 with default parameter
settings (90% identity and overlap of 40 bp)38
according to Ewen-Campen et al.39 Overall, 8895
assembled sequences were produced, and sequence similarity searches were conducted against the NCBI
nr, rice, Brachypodium, and wheat protein databases
using the BlastX algorithm. Of the query sequences, 90% had BlastX hits in the NCBI nr protein database. Similarly, 89 and 87% of the query sequences
showed homology to annotatedBrachypodiumproteins
and annotated rice proteins, respectively. On the other hand, 68% of the contig sequences had homology to wheat proteins, which might be due to the lower number of proteins deposited in the wheat database
(8590 proteins) than the Brachypodium(31 029
pro-teins) and rice (40 353 propro-teins) databases.
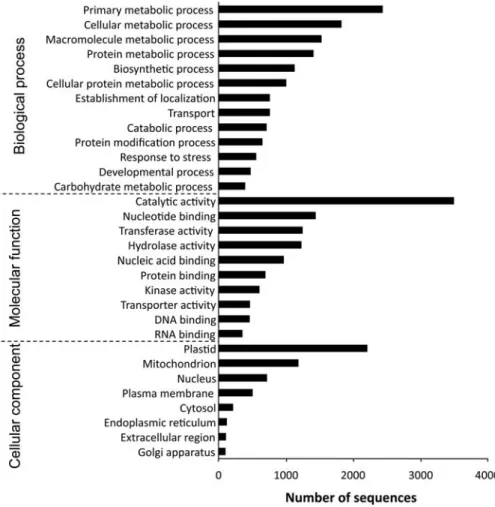
To see whether the sequenced transcripts are func-tionally diverse or not, GO annotation was performed based on the BlastX hits against the NCBI nr database. In total, 7740 sequences were assigned to one or more GO annotations. Of the assigned GO terms, 13 260 were under the biological process domain, 10 280 under molecular function, and 9750 under
cellular component (Fig.1). A large functional
diver-sity of genes was found in the transcriptomic data. Because the total RNA for the transcriptome analysis was extracted from leaves, a large proportion of the assignments fell into the plastids category of the cellu-lar component subontology.
3.2. SNP and indel discovery
Polymorphic sites were discovered using GS Reference Mapper to align individual reads from both accessions against the reference contig sequences. Among the 10 351 total polymorphic sites, 9435 were SNPs
and 739 were indels (Table 3). Furthermore,
accord-ing to the read depth (3 non-duplicate reads) and
quality (QV20), 4578 polymorphic sites were
clas-sified as HC polymorphisms, including 4337 SNPs (in 1748 contigs), 198 indels (in 153 contigs), and 44 variants with two or more nucleotide changes. The HC SNPs data are available online as Supplemental data (Supplemental Data1.fna). HC SNP frequency was one SNP per 1854 bp, and when considering all the discovered SNPs the frequency, it was 852 bp
per SNP (Table3).
To study how many HC SNPs are also present in the
polymorphism dataset reported by You et al.,25 a
BlastN search was performed using as query 4337 100-bp sequences, in which each of the HC SNPs were positioned in the middle. Hits were obtained
for all the 4337 sequences with an E-value cutoff of
10, of which 546 SNPs were common to our dataset (Supplementary Tables S2 and S3). With an
E-value cutoff of 1025, 1943 hits were obtained, but
the number of common SNPs between the two data-sets did not differ greatly (538 SNPs). These results
Table 2. Contig and isotig sequence length distribution Sequence length (bp) Number of contig Number of isotig
100–500 3300 1162 501–1000 4350 4612 1001–1500 1622 1934 1501–2000 594 828 2001–2500 199 305 .2500 159 304 Total 10 224 9145 Average length (bp) 786 1021
at Okayama University on March 24, 2014
http://dnaresearch.oxfordjournals.org/
indicate that the majority of HC SNPs (around 3800) are only present in our dataset. Because the genome of Ae. tauschii is composed of large repetitive
regions, only 44% of the total genomic read length
has been available for SNP discovery.25Our results
in-dicate that SNP discovery by RNA-seq is cost-effective in organisms with complex genomes, as reported in
maize.40
Although most contigs with HC polymorphisms contained one or two HC SNPs, 41 contigs had a large number of SNPs, ranging from 11 to 44
(Fig. 2A). The number of SNPs per contig was not
completely dependent on sequence length, indicated
by the low coefficient of determination (R2¼0.05)
(Fig. 2B). To study whether these nucleotide
varia-tions affect amino acid sequences, the longest ORFs from isotigs that include contigs with HC polymorph-isms were extracted. The longest ORFs supported by BlastX search were found in 1538 out of the 2214 isotigs. Synonymous and non-synonymous mutations were analysed on contig sequences. In about 1100 out of the 1379 selected contigs, nucleotide varia-tions were found mainly within the ORF, whereas the number of SNPs was similar between the ORF and untranslated region (UTR) in around 80 contigs (Supplementary Table S4). Although the number of
Figure 1. GO classification of assembled sequences. The results are summarized into three main subontologies: biological process, molecular function, and cellular component. Based on BlastX results against the NCBI nr protein database, 7740 sequences were assigned to one or more GO annotations.
Table 3.Polymorphisms detected between two Ae. tauschii accessions
Number of polymorphic sites Total polymorphic sites HC polymorphic sites Total 10 351 (3578 contigs) 4578 (1793 contigs) SNPs 9435 (3444 contigs) 4337 (1748 contigs) Indel 739 (539 contigs) 198 (153 contigs) Involving two or more
nucleotides 112 (100 contigs) 44 (42 contigs) Average bp per polymorphic sitea 777 1756 Average bp per SNPa 852 1854 a
Calculated by dividing the total number of (HC) poly-morphic sites or SNPs by the total length of contigs (8 039 509 bp).
at Okayama University on March 24, 2014
http://dnaresearch.oxfordjournals.org/
SNPs was higher in ORFs than in UTRs, synonymous mutations predominated in most cases. Non-syn-onymous mutations outnumbered synNon-syn-onymous ones in 370 contigs. Nonsense mutations were observed in four contigs. However, we cannot discharge the possibility that the reads of paralogous genes are included in these highly polymorphic contigs.
The predominant length of indels was 3 bp,
fol-lowed by 2, and 1 bp (Fig.2C). The longest indel
mu-tation was 11 bp in contig04102 and contig05280. Indels were found in 90 out of the 1379 analysed contigs (Supplementary Table S4), of which 45 contigs included indel mutations within ORF, and frame-shift mutations occurred in 16 contigs. These results indicate that, despite the high number of poly-morphic sites, the effect on protein sequence is not necessarily high.
3.3. SNP validation
To validate the detected SNPs, 33 polymorphic contigs were randomly selected. Of the 33 contigs, 30 contained HC SNPs and the remaining 3 contained lower confidence (LC) SNPs. The validation was
per-formed by genotyping 20 diverse Ae. tauschii
Figure 2. Detection of SNPs and indels in the contigs. (A) Frequency distribution of HC SNPs per contig (n¼1748 contigs). (B) Relationship between the number of SNPs per contig and the contig length; data are from 1748 contigs containing SNPs. Significant correlation is indicated by asterisks (***P,0.001). (C) Frequency distribution of HC indel length in base pairs per contig in a total of 153 contigs.
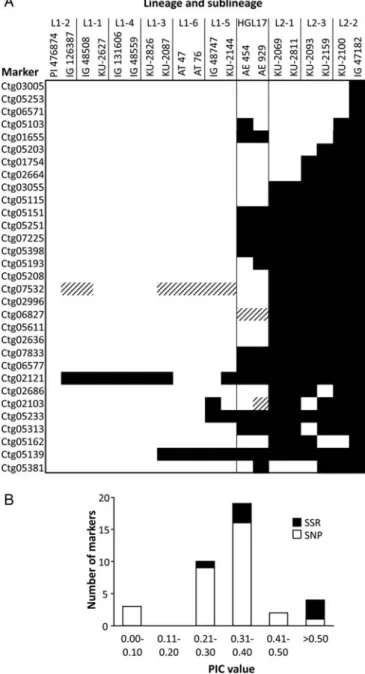
Figure 3. Validation of identified polymorphisms in the contigs. (A) Summary of genotyping results of the 31 polymorphic SNP markers in the 20 Ae. tauschii accessions. Genotypes of the two accessions used in transcriptome sequencing, PI476874 and IG47182, are shown in the first and last columns, respectively. White, black, and shaded regions indicate the PI476874, IG47182, and other alleles, respectively. (B) Frequency distribution of PIC values. PIC values of SNP markers (open bars) and SSR markers (black bars) among the 20 Ae. tauschiiaccessions. A total of 31 SNP and 6 SSR markers were used.
at Okayama University on March 24, 2014
http://dnaresearch.oxfordjournals.org/
accessions, chosen based on the intraspecific
diversifi-cation patterns of Ae. tauschii.12 The selected
acces-sions consisted of two accesacces-sions from each of the nine Ae. tauschii sublineages (six of L1 and three of
L2) and HGL17, excluding any admixtures (Fig.3A).
First, all 33 contigs were searched for restriction enzyme recognition sites, with at least 14 SNPs found and converted into CAPS markers. All 14 CAPS markers were polymorphic among the examined accessions (Supplementary Fig. S1A). An alternative to a CAPS marker is a dCAPS marker that consists of the introduction of one or more mismatches into the primer, creating a restriction site dependent on
the presence or absence of the SNP.41 Five of the
SNPs that were not converted into CAPS markers were used to develop dCAPS markers by introducing one or two mismatches in the primer sequence. Two dCAPS markers could not be used for genotyping because unexpected bands were amplified by PCR, and a dCAPS marker for contig05220 was unavailable due to the generation of digestion-resistant PCR pro-ducts in some accessions (Supplementary Fig. S1B). In dCAPS markers, a single mismatch at position 1,
2, or 3 from the 30 end of the primer is preferred
to avoid digestion-resistant products.42 However, in
some cases, a mismatch at position 1 or 2 may also lead to undigested products, if the polymerase has
proofreading exonuclease activity.43The
digestion-re-sistant products were generated for unknown reasons because in the dCAPS analysis of the contig05220 marker, a single mismatch was introduced at position
1 and amplification was performed using a TaqDNA
polymerase lacking proofreading activity. The remain-ing two dCAPS markers were successfully used in genotyping (Supplementary Fig. S1C).
SNP genotyping based on HRM analysis has also
been reported in hexaploid wheat andAe. tauschii.32
Primers for HRM analysis were designed for the remaining 17 contigs (including the three contigs that failed in the dCAPS analysis) to obtain PCR
pro-ducts of 100 bp. Only two of the 17 HRM primer
sets failed in polymorphism detection, although both amplified genomic regions contained HC SNPs between PI476874 and IG47182. HRM analysis is useful as an alternative to SNP-typing because it is
cost-effective when the restriction enzyme in CAPS/
dCAPS markers is expensive. Another advantage of HRM is the possibility of detecting more than two alleles (Supplementary Fig. S2), which is not possible
with CAPS/dCAPS. In addition, the relatively short
length of the PCR products required for HRM analyses increases the probability that primer pairs are located within a single exon because more than half of the exons in plant genomes are less than 145–156 bp (Supplementary Table S5). Our results indicate that almost all of these SNPs can be converted to
PCR-based molecular markers, at least in diploid wheat species.
To evaluate the allelic diversity within the Ae.
tauschii population, PIC values were calculated for each validated SNP marker. PIC values ranged from
0.091 to 0.591 (average, 0.313) in the 20Ae. tauschii
accessions (Fig. 3B). Among the 31 markers, three
showed IG47182-specific SNP alleles, and 15 clearly
distinguished the L1 accessions from L2 (Fig. 3A).
Because many of the validated SNPs were polymorph-ic between L1 and L2 accessions, the markers devel-oped using information about these SNPs can be used in genotyping of mapping populations obtained
from interlineage crosses (L1L2). Moreover,
consid-ering that the subspecies strangulata is a possible
major D-genome donor and the evolutionary birth-place of hexaploid common wheat, the D-genome
donor has been thought to belong to L2,12indicating
that these markers might be useful for genotyping the progeny of common wheat cultivars crossed with L1-derived hexaploid wheat synthetics. Further studies are needed to confirm this hypothesis. The HGL17 accessions, considered one of the ancestral
lineages of Ae. tauschii, are not included in either L1
or L2, but rather are located genealogically between
these two lineages.12Consistently, the genotype
pat-terns of the two HGL17 accessions analysed (AE454 and AE929) were intermediates between L1 and L2 accessions.
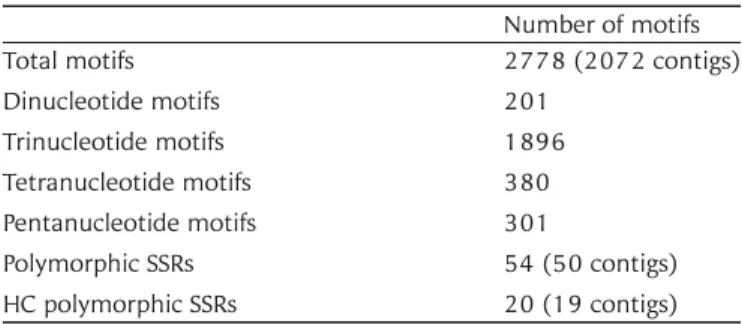
3.4. EST-SSR mining and validation
Among all 10 224 contigs, a total of 2778 SSR motifs were found in 2072 contigs and were
com-posed mainly of trinucleotide motifs (Table 4). Indel
polymorphisms between PI476874 and IG47182 were searched as polymorphic SSRs in the 2778 motifs. In total, 54 polymorphic SSRs were found in 50 contigs, with 20 of them HC SSRs. Based on these data, 18 EST-SSR markers, including 14 HC and 4 LC polymorphic SSRs, were developed for
valid-ation in the 20Ae. tauschii accessions. Seven EST-SSR
markers generated multiple bands or amplified pro-ducts with a length much longer than expected
Table 4. SSR motifs found in 10 224 contigs Number of motifs
Total motifs 2778 (2072 contigs)
Dinucleotide motifs 201 Trinucleotide motifs 1896 Tetranucleotide motifs 380 Pentanucleotide motifs 301 Polymorphic SSRs 54 (50 contigs) HC polymorphic SSRs 20 (19 contigs)
at Okayama University on March 24, 2014
http://dnaresearch.oxfordjournals.org/
( probably due to the presence of introns) and were excluded from further analyses. Four out of the eight EST-SSR markers with more than a 4-bp differ-ence were able to distinguish genotypes of samples in 13% non-denaturing polyacrylamide gels. HRM analysis was conducted for the other EST-SSR markers, including indels with less than a 5-bp differ-ence, and this detected polymorphisms in only two of the seven EST-SSR markers. PIC values of these six markers ranged from 0.305 to 0.686, with an
average of 0.424 (Fig. 3B). The number of alleles in
the EST-SSR markers ranged from two to six (average, 3.0), which was higher when compared with that in SNP markers with two to three alleles (average, 2.1). This difference might reflect the higher average PIC value of the EST-SSR markers.
3.5. Genetic map construction
We developed 37 polymorphic markers, including 31 SNPs and 6 EST-SSRs. To study the proportion of these markers that can be assigned to a genetic
map, genotypes of 104 F2 individuals obtained from
a cross between PI476874 and IG47182 were deter-mined. All these markers were successfully mapped onto a linkage map constructed using 87 publicly
available SSR markers.26,32The total map length was
1282.1 cM, with an average interval of 9.5 cM between markers. In total, 12 markers were distorted on chromosome 1D, 24 markers on chromosome 2D, 6 markers on chromosome 4D, and 10 markers on chromosome 5D. Segregation ratios of the newly mapped markers are presented in Supplementary Table S6. The distribution of the 37 marker positions ranged from 1 on chromosome 1D to 12 on chromo-some 5D (Supplementary Fig. S3). Two markers, one SNP marker and an SSR marker, were derived from dif-ferent sites of contig06827, and both mapped to the same location.
We performed a BlastN search of the 36 mapped contigs against the deletion-mapped ESTs of common
wheat,44 obtaining 17 matches (Supplementary
Table S7). Of the 17 contigs, 14 (82%) were located on the same homoeologous group chromosomes as the deletion-mapped ESTs. Recently, a genome survey sequence of common wheat chromosome 7D
was published.27 To compare the order of the six
contigs that mapped to chromosome 7D of Ae.
tauschii, a BlastN search was performed against the
7D Synthetic Build v2.0.27Four contigs were assigned
to the short arm and two to the long arm of
chromo-some 7D, as expected based on the Ae. tauschii
genetic map (Supplementary Table S8). The contig order in the survey sequence data was similar to that in the 7D linkage map, although the position of contig02996 differed slightly.
In barley, a hypothetical gene order has been pro-posed for each of the seven chromosomes based on
conserved synteny among barley, Brachypodium, rice,
and sorghum.28 Due to the conserved synteny
between wheat and barley,45 the contigs with HC
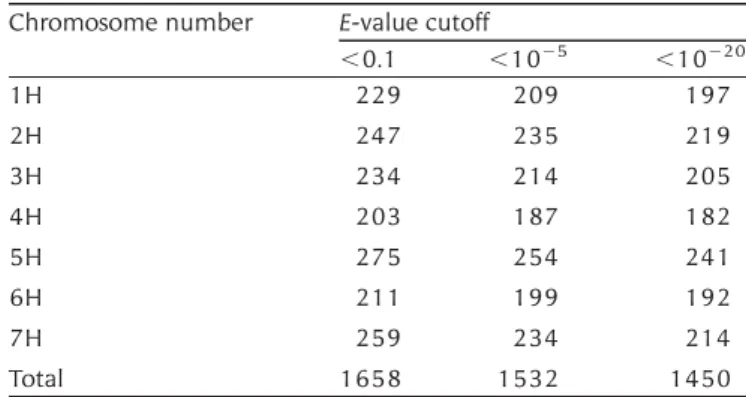
SNPs were mapped on the virtual barley chromo-somes, aligning with the shotgun barley genomic
sequences.28A total of 1450 contigs (E-value cutoff
of 10220) were mapped with a distribution of
around 200 contigs per chromosome (Table5). The
order of contigs on the genetic map of chromosomes 2D and 5D was also compared, respectively, with the virtual barley chromosomes 2H and 5H. These two chromosomes were selected because the number of mapped contigs was higher than that for the remaining chromosomes. Of the seven contigs that mapped to chromosome 2D, one failed to be assigned to any barley chromosomes, four were assigned to chromosome 2H, and two to other chromosomes (Supplementary Table S9). To confirm this result, tBlastX search was performed against 5006 and
23 614 barley full-length cDNAs,36,37 and BlastX
search was performed againstBrachypodiumand rice
protein database. Based on these Blast hits, six out of the seven contigs were located on chromosome 2H (Supplementary Table S9), indicating that some hom-ologous genes on the chromosome other than 2H were hit in the former analysis. Contig06577 failed to be assigned to any barley chromosome. The
contig order on chromosome 2D ofAe. tauschii
corre-sponded to the gene order on chromosome 2H of
barley (Fig.4A). Similarly, 12 out of 13 contigs ofAe.
tauschii chromosome 5D were assigned to chromo-some 5H of barley based on tBlastX hits against barley shotgun genomic reads (Supplementary Table S10). Contig05381 was assigned to chromosome 2H, and this result was confirmed by performing a Blast
search against barley cDNA and Brachypodium and
rice protein sequences (Supplementary Table S10).
The contigs on chromosome 5D of Ae. tauschii,
except for contig05398, showed an order identical to
Table 5. Number of contigs with HC SNPs mapped on the virtual barley chromosome
Chromosome number E-value cutoff
,0.1 ,1025 ,10220 1H 229 209 197 2H 247 235 219 3H 234 214 205 4H 203 187 182 5H 275 254 241 6H 211 199 192 7H 259 234 214 Total 1658 1532 1450
at Okayama University on March 24, 2014
http://dnaresearch.oxfordjournals.org/
that on barley chromosome 5H, whereas contig05398
was located in a slightly different region (Fig. 4B).
Previously,14% of barley genes could not be assigned
to virtual chromosomes by the GenomeZipper
ap-proach.28 Therefore, contig06577 that failed to be
assigned to the virtual barley chromosomes might correspond to the unassigned 14% of barley genes. Indeed, this contig showed sequence similarity with
Brachypodium and rice genes Bradi1g19250 and Os07g0656700 that are probably located on the short arm of chromosome 2H, according to the synteny with barley (Supplementary Table S9). Furthermore, contig05381 (mapped on chromosome 5DL but assigned to barley 2HS) also showed
se-quence similarity with Bradi4g34390 and
Os09g0502200 that probably map to chromosome 5HL of barley (Supplementary Table S10). The chromosomal locations of the remaining mapped contigs were similarly confirmed (Supplementary Table S11). These results suggest that the contigs should be assigned to virtual barley chromosomes not only by alignment with the shotgun genomic
reads, but also by alignment with Brachypodium and
rice protein sequences. The chromosomal locations of unassigned contigs might be searched based on
the synteny among barley, Brachypodium, and rice.
Our results indicate that information on hypothetical gene order in barley may be useful for the develop-ment of molecular markers in target chromosomal regions of wheat.
3.6. Conclusion
Marker development in targeted chromosomal regions is important for map-based gene cloning and for molecular breeding in wheat and other
crops. In this study, transcriptomes of twoAe. tauschii
accessions belonging to different major lineages were compared, yielding 4578 HC-polymorphic sites from 1793 contigs. Thirty-one SNPs were validated in the
20 diverseAe. tauschiiaccessions through conversion
into CAPS, dCAPS, and HRM markers. Development of CAPS markers is dependent on the availability of appropriate restriction enzymes and their cost. In some dCAPS markers, generation of digestion-resist-ant PCR products interferes with precise genotyping.
Figure 4.Synteny between chromosomes 2D and 5D of Ae. tauschii and 2H and 5H of barley. Based on tBlastX hits against barley full-length cDNA andBrachypodiumprotein database, the contig orders on chromosomes 2D (A) and 5D (B) were compared with those on the barley virtual chromosome in the genome zipper. The clone names and accession numbers of barley cDNAs are indicated in parentheses.
at Okayama University on March 24, 2014
http://dnaresearch.oxfordjournals.org/
In this study, we showed that HRM analysis is available for SNP typing. The SNP markers developed in this
study could be applied to construct an F2 map
between L1 and L2 accessions of Ae. tauschii, and
probably between the D genomes of common wheat and L1-derived synthetic wheat. One next gen-eration sequencing experiment on transcriptomes of
parental accessions leading to de novo-generated SNP
markers was able to identify the chromosomal location of more than 1700 genes in the wheat D genome. RNA-seq is a more cost-effective method for SNP dis-covery than the annotation-based one in organisms with large and complex genomes. In addition, due to the conserved synteny between wheat and barley chro-mosomes, the barley high-density EST map and linear gene order can be applied to develop markers on the target chromosomal regions of wheat. Accompanied by further progress on the wheat genome project coordinated by the International Wheat Genome
Sequencing Consortium (http://www.wheatgenome.
org/), more information about genomic sequence
data of each chromosome will become available for wheat marker development.
Acknowledgements: The authors would like to thank Ms Yuka Motoi at Okayama University for technical assistance.
Supplementary data: Supplementary Data are available at www.dnaresearch.oxfordjournals.org.
Funding
This work was supported by grants from the Ministry of Education, Culture, Sports, Science, and Technology (MEXT) of Japan (Grant-in-Aid for Scientific Research (B) No. 21380005 and Grant-in-Aid for Challenging Exploratory Research No. 23658010) to S.T., and by MEXT as part of a Joint Research Program implemented at the Institute of Plant Science and Resources, Okayama University in Japan.
References
1. Kihara, H. 1944, Discovery of the DD-analyser, one of the ancestors of Triticum vulgare, Agric. Hortic., 19, 889–90 [In Japanese].
2. McFadden, E.S. and Sears, E.R. 1944, The artificial syn-thesis ofTriticum spelta,Rec. Genet. Soc. Am.,13, 26–7. 3. Dudnikov, A.J. and Goncharov, N.P. 1993, Allozyme
vari-ation inAegilops squarrosa,Hereditas,119, 117–22. 4. Dvorak, J., Luo, M.C., Yang, Z.L. and Zhang, H.B. 1998,
The structure of theAegilops tauschiigenepool and the evolution of hexaploid wheat, Theor. Appl. Genet., 97, 657–70.
5. Dudnikov, A.J. and Kawahara, T. 2006,Aegilops tauschii: genetic variation in Iran, Genet. Resour. Crop Evol.,53, 579–86.
6. Matsuoka, Y., Takumi, S. and Kawahara, T. 2007, Natural variation for fertile triploid F1 formation in
allohexa-ploid wheat speciation, Theor. Appl. Genet., 115, 509–18.
7. Matsuoka, Y., Takumi, S. and Kawahara, T. 2008, Flowering time diversification and dispersal in central Eurasian wild wheatAegilops tauschiiCoss.: genealogical and ecological framework, PLoS ONE, 3, e3138. doi:10.1371/journal.pone.0003138
8. Matsuoka, Y., Nishioka, E., Kawahara, T. and Takumi, S. 2009, Genealogical analysis of subspecies divergence and spikelet-shape diversification in central Eurasian wild wheat Aegilops tauschii Coss., Plant Syst. Evol.,
279, 233–44.
9. Takumi, S., Nishioka, E., Morihiro, H., Kawahara, T. and Matsuoka, Y. 2009, Natural variation of morphological traits in wild wheat progenitor Aegilops tauschii Coss.,
Breed. Sci.,59, 579–88.
10. Kajimura, T., Murai, K. and Takumi, S. 2011, Distinct genetic regulation of flowering time and grain-filling period based on empirical study of D-genome diversity in synthetic hexaploid wheat lines, Breed. Sci., 61, 130–41.
11. Iehisa, J.C.M. and Takumi, S. 2012, Variation in abscisic acid responsiveness of Aegilops tauschii and hexaploid wheat synthetics due to the D-genome diversity,Genes Genet. Syst.,87, 9–18.
12. Mizuno, N., Yamasaki, M., Matsuoka, Y., Kawahara, T. and Takumi, S. 2010, Population structure of wild wheat D-genome progenitorAegilops tauschiiCoss.: implications for intraspecific lineage diversification and evolution of common wheat,Mol. Ecol.,19, 999–1013.
13. Feldman, M. 2001, Origin of Cultivated Wheat. In: Bonjean, A.P. and Angus, W.J. (eds) The World Wheat Book: A History of Wheat Breeding, Lavoisier Publishing, Paris, pp. 3–56.
14. Cadalen, T., Boeuf, C., Bernard, S. and Bernard, M. 1997, An intervarietal molecular marker map inTriticum aes-tivumL. Em. Thell. and comparison with a map from a wide cross,Theor. Appl. Genet.,94, 367–77.
15. Chao, S., Zhang, W., Akhunov, E., et al. 2009, Analysis of gene-derived SNP marker polymorphism in US wheat (Triticum aestivum L.) cultivars, Mol. Breed.,23, 23–33.
16. Allen, A.M., Barker, G.L.A., Berry, S.T., et al. 2011, Transcript-specific, single-nucleotide polymorphism discovery and linkage analysis in hexaploid bread wheat (Triticum aestivum L.), Plant Biotechnol. J., 9, 1086–99.
17. Kihara, H. and Lilienfeld, F. 1949, A new-synthesized 6x-wheat,Hereditas,35(Suppl), 307–19.
18. Matsuoka, Y. and Nasuda, S. 2004, Durum wheat as a candidate for the unknown female progenitor of bread wheat: an empirical study with a highly fertile F1 hybrid with Aegilops tauschii Coss., Theor. Appl. Genet.,109, 1710–7.
19. Trethowan, R.M. and Mujeeb-Kazi, A. 2008, Novel germplasm resources for improving environmental
at Okayama University on March 24, 2014
http://dnaresearch.oxfordjournals.org/
stress tolerance of hexaploid wheat, Crop Sci., 48, 1255 –65.
20. Yano, M. 2001, Genetic and molecular dissection of naturally occurring variation, Curr. Opin. Plant Biol.,4, 130 –5.
21. Ro¨der, M., Korzun, V., Wendehake, K., et al. 1998, A microsatellite map of wheat,Genetics,149, 2007–23. 22. Somers, D.J., Isaac, P. and Edwards, K. 2004, A high-density microsatellite consensus map for bread wheat (Triticum aestivum L.), Theor. Appl. Genet., 109, 1105 –14.
23. Deschamps, S. and Campbell, M.A. 2010, Utilization of next-generation sequencing platforms in plant genom-ics and genetic variation discovery, Mol. Breed., 25, 553 –70.
24. Close, T.J., Bhat, P.R., Lonardi, S., et al. 2009, Development and implementation of high-throughput SNP genotyping in barley,BMC Genomics,10, 582. 25. You, F.M., Huo, N., Deal, K.R., et al. 2011,
Annotation-based genome-wide SNP discovery in the large and complex Aegilops tauschii genome using next-gener-ation sequencing without a reference genome se-quence,BMC Genomics,12, 59.
26. Koyama, K., Hatano, H., Nakamura, J. and Takumi, S. 2012, Characterization of three vernalization insensi-tive3-like(VIL) homologs in wild wheat,Aegilops tauschii
Coss.,Hereditas,149, 62–71.
27. Berkman, P.J., Skarshewski, A., Lorenc, M.T., et al. 2011, Sequencing and assembly of low copy and genic regions of isolatedTriticum aestivumchromosome arm 7DS,Plant Biotechnol. J.,9, 768–75.
28. Mayer, K.F.X., Martis, M., Hedley, P.E., et al. 2011, Unlocking the barley genome by chromosomal and comparative genomics,Plant Cell,23, 1249–63. 29. Conesa, A., Go¨tz, S., Garcı´a-Go´mez, J.M., Terol, J.,
Talo´n, M. and Robles, M. 2005, Blast2GO: a universal tool for annotation, visualization and analysis in functional genomics research, Bioinformatics, 21, 3674 – 6.
30. Rice, P., Longden, I. and Bleasby, A. 2000, EMBOSS: The European Molecular Biology Open Software Suite,
Trends Genet.,16, 276–7.
31. Neff, M.M., Turk, E. and Kalishaman, M. 2002, Web-based primer design for single nucleotide polymorph-ism analysis,Trends Genet.,18, 613–5.
32. Matsuda, R., Iehisa, J.C.M. and Takumi, S. 2012, Application of real-time PCR-based SNP detection for mapping of Net2, a causal D-genome gene for hybrid
necrosis in interspecific crosses between tetraploid wheat and Aegilops tauschii, Genes Genet. Syst., 87, 137–43.
33. Park, S.D.E. 2001, Trypanotolerance in west African cattle and the population genetic effects of selection. PhD Thesis, University of Dublin.
34. Lander, E.S., Green, P., Abrahamson, J., Barlow, A. and Daly, M.J. 1987, MAPMAKER: an interactive computer package for constructing primary genetic linkage maps of experimental and natural populations, Genomics, 1, 178–81.
35. Kosambi, D.D. 1944, The estimation of map distance from recombination values,Ann. Eugen.,12, 172–5. 36. Sato, K., Shin-I, T., Seki, M., et al. 2009, Development of
5006 full-length cDNAs in barley: a tool for accessing cereal genomics resources,DNA Res.,16, 81–9. 37. Matsumoto, T., Tanaka, T., Sakai, H., et al. 2011,
Comprehensive sequence analysis of 24,783 barley full-length cDNAs derived from 12 clone libraries,
Plant Physiol.,156, 20–8.
38. Huang, X. and Madan, A. 1999, CAP3: a DNA sequence assembly program,Genome Res.,9, 868 –77.
39. Ewen-Campen, B., Shaner, N., Panfilio, K.A., Suzuki, Y., Roth, S. and Extavour, C.G. 2011, The maternal and early embryonic transcriptome of the milkweed bug
Oncopeltus fasciatus,BMC Genomics,12, 61.
40. Hansey, C.N., Vaillancourt, B., Sekhon, R.S., de Leon, N., Kaeppler, S.M. and Buell, C.R. 2012, Maize (Zea mays
L.) genome diversity as revealed by RNA-sequencing,
PLoS One,7, e33071.
41. Neff, M.M., Neff, J.D., Chory, J. and Pepper, A.E. 1998, dCAPS, a simple technique for the genetic analysis of single nucleotide polymorphisms: experimental appli-cations in Arabidopsis thaliana genetics, Plant J., 14, 387–92.
42. Michaels, S.D. and Amasino, R.M. 1998, A robust method for detecting single-nucleotide changes as polymorphic markers by PCR,Plant J.,14, 381–5. 43. Komori, T. and Nitta, N. 2005, Utilization of the CAPS/
dCAPS method to convert rice SNPs into PCR-based markers,Breed. Sci.,55, 93–8.
44. Qi, L.L., Echalier, B., Chao, S., et al. 2004, A chromosome bin map of 16,000 expressed sequence tag loci and dis-tribution of genes among the three genomes of poly-ploid wheat,Genetics,168, 701 –12.
45. Carollo, V., Matthews, D.E., Lazo, G.R., et al. 2005, GrainGenes 2.0. An improved resource for the small-grains community,Plant Physiol.,139, 643–51.
at Okayama University on March 24, 2014
http://dnaresearch.oxfordjournals.org/