Visualization of Geotechnical
Data for Hazard Mitigation
and Disaster Response
NCHRP
SYNTHESIS 467
A Synthesis of Highway Practice
NATIONAL
COOPERATIVE
HIGHWAY
RESEARCH
PROGRAM
Vice Chair: Daniel Sperling, Professor of Civil Engineering and Environmental Science and Policy; Director, Institute of Transportation
Studies, University of California, Davis
Executive Director: Robert E. Skinner, Jr., Transportation Research Board
MEMBERS
VICTORIA A. ARROYO, Executive Director, Georgetown Climate Center, and Visiting Professor, Georgetown University Law Center,
Washington, DC
SCOTT E. BENNETT, Director, Arkansas State Highway and Transportation Department, Little Rock
DEBORAH H. BUTLER, Executive Vice President, Planning, and CIO, Norfolk Southern Corporation, Norfolk, VA JAMES M. CRITES, Executive Vice President of Operations, Dallas/Fort Worth International Airport, TX
MALCOLM DOUGHERTY, Director, California Department of Transportation, Sacramento
A. STEWART FOTHERINGHAM, Professor and Director, Centre for Geoinformatics, School of Geography and Geosciences, University
of St. Andrews, Fife, United Kingdom
JOHN S. HALIKOWSKI, Director, Arizona DOT, Phoenix
MICHAEL W. HANCOCK, Secretary, Kentucky Transportation Cabinet, Frankfort
SUSAN HANSON, Distinguished University Professor Emerita, School of Geography, Clark University, Worcester, MA STEVE HEMINGER, Executive Director, Metropolitan Transportation Commission, Oakland, CA
CHRIS T. HENDRICKSON, Duquesne Light Professor of Engineering, Carnegie Mellon University, Pittsburgh, PA
JEFFREY D. HOLT, Managing Director, Bank of Montreal Capital Markets, and Chairman, Utah Transportation Commission,
Huntsville, Utah
GARY P. LaGRANGE, President and CEO, Port of New Orleans, LA MICHAEL P. LEWIS, Director, Rhode Island DOT, Providence JOAN McDONALD, Commissioner, New York State DOT, Albany ABBAS MOHADDES, President and CEO, Iteris, Inc., Santa Ana, CA
DONALD A. OSTERBERG, Senior Vice President, Safety and Security, Schneider National, Inc., Green Bay, WI STEVEN W. PALMER, Vice President of Transportation, Lowe’s Companies, Inc., Mooresville, NC
SANDRA ROSENBLOOM, Professor, University of Texas, Austin
HENRY G. (GERRY) SCHWARTZ, JR., Chairman (retired), Jacobs/Sverdrup Civil, Inc., St. Louis, MO
KUMARES C. SINHA, Olson Distinguished Professor of Civil Engineering, Purdue University, West Lafayette, IN GARY C. THOMAS, President and Executive Director, Dallas Area Rapid Transit, Dallas, TX
PAUL TROMBINO III, Director, Iowa DOT, Ames
PHILLIP A. WASHINGTON, General Manager, Regional Transportation District, Denver, CO EX OFFICIO MEMBERS
THOMAS P. BOSTICK (Lt. General, U.S. Army), Chief of Engineers and Commanding General, U.S. Army Corps of Engineers,
Washington, DC
TIMOTHY P. BUTTERS, Acting Administrator, Pipeline and Hazardous Materials Safety Administration, U.S. DOT ALISON JANE CONWAY, Assistant Professor, Department of Civil Engineering, City College of New York, NY, and Chair,
TRB Young Member Council
T. F. SCOTT DARLING III, Acting Administrator and Chief Counsel, Federal Motor Carrier Safety Administration, U.S. DOT ANNE S. FERRO, Administrator, Federal Motor Carrier Safety Administration, U.S. DOT
DAVID J. FRIEDMAN, Acting Administrator, National Highway Traffic Safety Administration, U.S. DOT LeROY GISHI, Chief, Division of Transportation, Bureau of Indian Affairs, U.S. Department of the Interior
JOHN T. GRAY II, Senior Vice President, Policy and Economics, Association of American Railroads, Washington, DC MICHAEL P. HUERTA, Administrator, Federal Aviation Administration, U.S. DOT
PAUL N. JAENICHEN, SR., Acting Administrator, Maritime Administration, U.S. DOT THERESE W. McMILLAN, Acting Administrator, Federal Transit Administration, U.S. DOT
MICHAEL P. MELANIPHY, President and CEO, American Public Transportation Association, Washington, DC GREGORY G. NADEAU, Acting Administrator, Federal Highway Administration, U.S. DOT
PETER M. ROGOFF, Under Secretary for Policy, U.S. DOT
CRAIG A. RUTLAND, U.S. Air Force Pavement Engineer, Air Force Civil Engineer Center, Tyndall Air Force Base, FL JOSEPH C. SZABO, Administrator, Federal Railroad Administration, U.S. DOT
BARRY R. WALLERSTEIN, Executive Officer, South Coast Air Quality Management District, Diamond Bar, CA GREGORY D. WINFREE, Assistant Secretary for Research and Technology, Office of the Secretary, U.S. DOT
FREDERICK G. (BUD) WRIGHT, Executive Director, American Association of State Highway and Transportation Officials, Washington, DC PAUL F. ZUKUNFT (Adm., U.S. Coast Guard), Commandant, U.S. Coast Guard, U.S. Department of Homeland Security
NCHRP
SYNTHESIS 467
TRANSPORTATION RESEARCH BOARD
WASHINGTON, D.C.2015 www.TRB.org
Research Sponsored by the American Association of State Highway and Transportation Officials in Cooperation with the Federal Highway Administration
SubScriber categorieS
Geotechnology • Highways • Security and Emergencies
Visualization of Geotechnical
Data for Hazard Mitigation
and Disaster Response
A Synthesis of Highway Practice
conSultantS
Hollie L. Ellis
and Mark J. Vessely Shannon & Wilson, Inc.
individually or in cooperation with their state universities and others. However, the accelerating growth of highway transportation develops increasingly complex problems of wide interest to highway authorities. These problems are best studied through a coordinated program of cooperative research.
In recognition of these needs, the highway administrators of the American Association of State Highway and Transportation Officials initiated in 1962 an objective national highway research program employing modern scientific techniques. This program is supported on a continuing basis by funds from participating member states of the Association and it receives the full cooperation and support of the Federal Highway Administration, United States Department of Transportation.
The Transportation Research Board of the National Academies was requested by the Association to administer the research program because of the Board’s recognized objectivity and understanding of modern research practices. The Board is uniquely suited for this purpose as it maintains an extensive committee structure from which authorities on any highway transportation subject may be drawn; it possesses avenues of communications and cooperation with federal, state, and local governmental agencies, universities, and industry; its relationship to the National Research Council is an insurance of objectivity; it maintains a full-time research correlation staff of specialists in highway transportation matters to bring the findings of research directly to those who are in a position to use them.
The program is developed on the basis of research needs identified by chief administrators of the highway and transportation departments and by committees of AASHTO. Each year, specific areas of research needs to be included in the program are proposed to the National Research Council and the Board by the American Association of State Highway and Transportation Officials. Research projects to fulfill these needs are defined by the Board, and qualified research agencies are selected from those that have submitted proposals. Administration and surveillance of research contracts are the responsibilities of the National Research Council and the Transportation Research Board.
The needs for highway research are many, and the National Cooperative Highway Research Program can make significant contributions to the solution of highway transportation problems of mutual concern to many responsible groups. The program, however, is intended to complement rather than to substitute for or duplicate other highway research programs.
Published reports of the
NATIONAL COOPERATIVE HIGHWAY RESEARCH PROGRAM are available from:
Transportation Research Board Business Office
500 Fifth Street, NW Washington, DC 20001
and can be ordered through the Internet at: http://www.national-academies.org/trb/bookstore
Printed in the United States of America
© 2014 National Academy of Sciences. All rights reserved.
COPYRIGHT INFORMATION
Authors herein are responsible for the authenticity of their materials and for obtaining written permissions from publishers or persons who own the copyright to any previously published or copyrighted material used herein.
Cooperative Research Programs (CRP) grants permission to reproduce material in this publication for classroom and not-for-profit purposes. Permission is given with the understanding that none of the material will be used to imply TRB, AASHTO, FAA, FHWA, FMCSA, FTA, or Transit Development Corporation endorsement of a particular product, method, or practice. It is expected that those reproducing the material in this document for educational and not-for-profit uses will give appropriate acknowledgment of the source of any reprinted or reproduced material. For other uses of the material, request permission from CRP.
NOTICE
The project that is the subject of this report was a part of the National Cooperative Highway Research Program, conducted by the Transportation Research Board with the approval of the Governing Board of the National Research Council.
The members of the technical panel selected to monitor this project and to review this report were chosen for their special competencies and with regard for appropriate balance. The report was reviewed by the technical panel and accepted for publication according to procedures established and overseen by the Transportation Research Board and approved by the Governing Board of the National Research Council.
The opinions and conclusions expressed or implied in this report are those of the researchers who performed the research and are not necessarily those of the Transportation Research Board, the National Research Council, or the program sponsors.
The Transportation Research Board of the National Academies, the National Research Council, and the sponsors of the National Cooperative Highway Research Program do not endorse products or manufacturers. Trade or manufacturers’ names appear herein solely because they are considered essential to the object of the report.
NOTE: The Transportation Research Board of the National Academies, the National Research Council, the Federal Highway Administration, the American Association of State Highway and Transportation Officials, and the individual
states participating in the National Cooperative Highway Research Program do
not endorse products or manufacturers. Trade or manufacturers’ names appear herein solely because they are considered essential to the object of this report.
and to their use for the general welfare. Upon the authority of the charter granted to it by the Congress in 1863, the Academy has a mandate that requires it to advise the federal government on scientific and techni-cal matters. Dr. Ralph J. Cicerone is president of the National Academy of Sciences.
The National Academy of Engineering was established in 1964, under the charter of the National Acad-emy of Sciences, as a parallel organization of outstanding engineers. It is autonomous in its administration and in the selection of its members, sharing with the National Academy of Sciences the responsibility for advising the federal government. The National Academy of Engineering also sponsors engineering programs aimed at meeting national needs, encourages education and research, and recognizes the superior achieve-ments of engineers. Dr. C. D. Mote, Jr., is president of the National Academy of Engineering.
The Institute of Medicine was established in 1970 by the National Academy of Sciences to secure the services of eminent members of appropriate professions in the examination of policy matters pertaining to the health of the public. The Institute acts under the responsibility given to the National Academy of Sciences by its congressional charter to be an adviser to the federal government and, upon its own initiative, to identify issues of medical care, research, and education. Dr. Victor J. Dzau is president of the Institute of Medicine.
The National Research Council was organized by the National Academy of Sciences in 1916 to associate the broad community of science and technology with the Academy’s purposes of furthering knowledge and advising the federal government. Functioning in accordance with general policies determined by the Acad-emy, the Council has become the principal operating agency of both the National Academy of Sciences and the National Academy of Engineering in providing services to the government, the public, and the scientific and engineering communities. The Council is administered jointly by both Academies and the Institute of Medicine. Dr. Ralph J. Cicerone and Dr. C. D. Mote, Jr., are chair and vice chair, respectively, of the National Research Council.
The Transportation Research Board is one of six major divisions of the National Research Council. The mission of the Transportation Research Board is to provide leadership in transportation innovation and progress through research and information exchange, conducted within a setting that is objective, interdisci-plinary, and multimodal. The Board’s varied activities annually engage about 7,000 engineers, scientists, and other transportation researchers and practitioners from the public and private sectors and academia, all of whom contribute their expertise in the public interest. The program is supported by state transportation departments, federal agencies including the component administrations of the U.S. Department of Transporta-tion, and other organizations and individuals interested in the development of transportation. www.TRB.org
www.national-academies.org
and to their use for the general welfare. Upon the authority of the charter granted to it by the Congress in 1863, the Academy has a mandate that requires it to advise the federal government on scientific and techni-cal matters. Dr. Ralph J. Cicerone is president of the National Academy of Sciences.
The National Academy of Engineering was established in 1964, under the charter of the National Acad-emy of Sciences, as a parallel organization of outstanding engineers. It is autonomous in its administration and in the selection of its members, sharing with the National Academy of Sciences the responsibility for advising the federal government. The National Academy of Engineering also sponsors engineering programs aimed at meeting national needs, encourages education and research, and recognizes the superior achieve-ments of engineers. Dr. C. D. Mote, Jr., is president of the National Academy of Engineering.
The Institute of Medicine was established in 1970 by the National Academy of Sciences to secure the services of eminent members of appropriate professions in the examination of policy matters pertaining to the health of the public. The Institute acts under the responsibility given to the National Academy of Sciences by its congressional charter to be an adviser to the federal government and, upon its own initiative, to identify issues of medical care, research, and education. Dr. Victor J. Dzau is president of the Institute of Medicine.
The National Research Council was organized by the National Academy of Sciences in 1916 to associate the broad community of science and technology with the Academy’s purposes of furthering knowledge and advising the federal government. Functioning in accordance with general policies determined by the Acad-emy, the Council has become the principal operating agency of both the National Academy of Sciences and the National Academy of Engineering in providing services to the government, the public, and the scientific and engineering communities. The Council is administered jointly by both Academies and the Institute of Medicine. Dr. Ralph J. Cicerone and Dr. C. D. Mote, Jr., are chair and vice chair, respectively, of the National Research Council.
The Transportation Research Board is one of six major divisions of the National Research Council. The mission of the Transportation Research Board is to provide leadership in transportation innovation and progress through research and information exchange, conducted within a setting that is objective, interdisci-plinary, and multimodal. The Board’s varied activities annually engage about 7,000 engineers, scientists, and other transportation researchers and practitioners from the public and private sectors and academia, all of whom contribute their expertise in the public interest. The program is supported by state transportation departments, federal agencies including the component administrations of the U.S. Department of Transporta-tion, and other organizations and individuals interested in the development of transportation. www.TRB.org
GUSTAVO ORTEGA, California Department of Transportation, Los Angeles TY ORTIZ, Colorado Department of Transportation, Technical Program, Denver KRYSTLE PELHAM, New Hampshire Department of Transportation, Concord MICHAEL ADAMS, Federal Highway Administration (Liaison)
SCOTT A. ANDERSON, Federal Highway Administration (Liaison)
SYNTHESIS STUDIES STAFF
STEPHEN R. GODWIN, Director for Studies and Special Programs JON M. WILLIAMS, Program Director, IDEA and Synthesis Studies JO ALLEN GAUSE, Senior Program Officer
GAIL R. STABA, Senior Program Officer DONNA L. VLASAK, Senior Program Officer TANYA M. ZWAHLEN, Consultant
DON TIPPMAN, Senior Editor
CHERYL KEITH, Senior Program Assistant DEMISHA WILLIAMS, Senior Program Assistant DEBBIE IRVIN, Program Associate
COOPERATIVE RESEARCH PROGRAMS STAFF
CHRISTOPHER W. JENKS, Director, Cooperative Research Programs
CHRISTOPHER HEDGES, Manager, National Cooperative Highway Research Program EILEEN P. DELANEY, Director of Publications
NCHRP COMMITTEE FOR PROJECT 20-05 CHAIR
BRIAN A. BLANCHARD, Florida DOT
MEMBERS
STUART D. ANDERSON, Texas A&M University
SOCORRO “COCO” BRISENO, California Department of Transportation CYNTHIA L. GERST, Ohio Department of Transportation
DAVID M. JARED, Georgia Department of Transportation MALCOLM T. KERLEY, Virginia DOT (retired)
JOHN M. MASON, JR., Auburn University CATHERINE NELSON, Salem, Oregon ROGER C. OLSON, Minnesota DOT
BENJAMIN I. ORSBON, South Dakota Department of Transportation RANDALL R. “RANDY” PARK, Utah Department of Transportation ROBERT L. SACK, New York State DOT
JOYCE N. TAYLOR, Maine Department of Transportation FRANCINE SHAW WHITSON, Federal Highway Administration
FHWA LIAISONS
JACK JERNIGAN MARY LYNN TISCHER
TRB LIAISON
STEPHEN F. MAHER
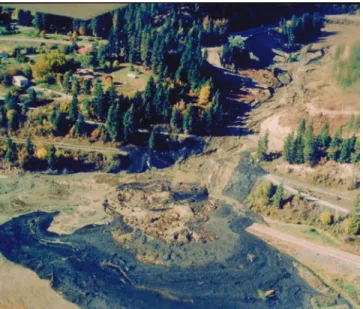
Cover figure: Bonners Ferry, Idaho. On October 15, 1998, more than 200,000 yards of mud gushed out of North Hill. It covered up a county road, and destroyed a portion of Union Pacific track and a 200 yard area of Highway 95. The mass of mud buried almost one million dollars worth of equipment. Highway 95, Idaho’s only major north-south route, was closed three weeks because of the slide. Description: NOAA Nat. Geophysical Data Center.
(Photo credit: D. Krammer, Disaster Services Boundary County Idaho.)
ACKNOWLEDGMENTS: The Transportation Research Board would like to thank Lisa Freese, Scott County (MN), Community Services Division, for her review of this report.
There is a need to understand the use and value of visualization of geotechnical data for mitigating hazards and responding to the consequences of disasters and extreme events. Hazards, disasters, and extreme events with a geotechnical basis include landslides, rock-falls, settlement, sinkholes, and many other events that can degrade or destroy a transporta-tion system. The findings reported in this study provide geotechnical leaders in transpor-tation with an overview of what tools and techniques their colleagues are using and how effective those tools and techniques are for mitigating geotechnical hazards and responding to geotechnical disasters.
Hollie L. Ellis and Mark J. Vessely, Shannon & Wilson, Inc., Seattle, Washington, col-lected and synthesized the information and wrote the report. Information was gathered by literature review, survey, and interviews. The members of the topic panel that oversaw the study are acknowledged on the preceding page. This synthesis is an immediately use-ful document that records the practices that were acceptable within the limitations of the knowledge available at the time of its preparation. As progress in research and practice continues, new knowledge will be added to that now at hand.
mation already exists, either in documented form or as undocumented experience and prac-tice. This information may be fragmented, scattered, and unevaluated. As a consequence, full knowledge of what has been learned about a problem may not be brought to bear on its solution. Costly research findings may go unused, valuable experience may be overlooked, and due consideration may not be given to recommended practices for solving or alleviat-ing the problem.
There is information on nearly every subject of concern to highway administrators and engineers. Much of it derives from research or from the work of practitioners faced with problems in their day-to-day work. To provide a systematic means for assembling and evaluating such useful information and to make it available to the entire highway com-munity, the American Association of State Highway and Transportation Officials—through the mechanism of the National Cooperative Highway Research Program—authorized the Transportation Research Board to undertake a continuing study. This study, NCHRP Proj-ect 20-5, “Synthesis of Information Related to Highway Problems,” searches out and syn-thesizes useful knowledge from all available sources and prepares concise, documented reports on specific topics. Reports from this endeavor constitute an NCHRP report series,
Synthesis of Highway Practice.
This synthesis series reports on current knowledge and practice, in a compact format, without the detailed directions usually found in handbooks or design manuals. Each report in the series provides a compendium of the best knowledge available on those measures found to be the most successful in resolving specific problems.
PREFACE
By Jon M. Williams Program Director Transportation Research Board
5 CHAPTER ONE INTRODUCTION What is Geotechnical Data Visualization? 5 Study Methodology, 5
8 CHAPTER TWO HAZARDS, DISASTERS, AND EXTREME EVENTS Definitions, 8
Examples of Natural Phenomena, 8
12 CHAPTER THREE GEOTECHNICAL DATA TYPES AND SOURCES Reconnaissance, Exploration, and Testing, 12
Instrumentation, 12 Remote Sensing Devices, 12 Geophysical Devices, 12
15 CHAPTER FOUR LITERATURE REVIEW
16 CHAPTER FIVE CURRENT GEOTECHNICAL VISUALIZATION TECHNOLOGY Spreadsheet Software, 16
Boring Log Generators, 16 Fence Diagram Generators, 17 Laboratory Software, 18
General Purpose Database Software, 18 General Purpose X-Y Graphing Software, 18 General Purpose Contouring Software, 19 Geographical Information Systems, 19 Instrumentation Software, 19 Image Analysis Software, 20 Web-Based Imaging Systems, 20 Other Applications, 20
21 CHAPTER SIX CURRENT PRACTICE AND EXPERIENCE Data Management, 21
Geotechnical Analysis, 21 Instrumentation, 21 Remote Sensing Data, 22 Hazard Mitigation, 22
Disaster and Extreme Event Response, 23 Long-Term Disaster Recovery, 23 Visualization Usage and Experience, 23 Visualization Users, 24
Commercial Development, 26 Open-Source Development, 27 Innovative Technologies, 27
29 CHAPTER EIGHT CONCLUSIONS AND RESEARCH OPPORTUNITIES Conclusions, 29
Research Opportunities, 29
31 ABBREVIATIONS
32 REFERENCES
33 BIBLIOGRAPHY
41 APPENDIX A SURVEY QUESTIONNAIRE
51 APPENDIX B SURVEY RESPONSE MATRICES
67 APPENDIX C SURVEY RESPONSE COMMENTARY
78 APPENDIX D SOFTWARE LISTS
Note: Photographs, figures, and tables in this report may have been converted from color to grayscale for printing. The electronic version of the report (posted on the web at www.trb.org) retains the color versions.
Visualization of geotechnical data can be an extremely valuable technique for mitigating hazards and responding to the consequences of disasters and extreme events. Geotechnical data visualization (GDV) can be broadly defined as graphic presentation of geotechnical data intended to provide insight into the nature of the problem at hand and to develop potential solutions for that problem. The tools currently used for visualization of geotechnical data include geotechnical-specific applications, applications adapted from other professions, and general-purpose applications such as spreadsheets and image analysis software.
The first objective of this study was to understand the nature and quantity of the geo-technical hazards, disasters, and extreme events that transportation personnel must prepare for and react to. The second objective was to understand what geotechnical data are avail-able to transportation personnel and how the data are stored and visualized. The information gained from the first two approaches provided a context for the third objective: synthesizing the reported effectiveness of data visualization tools in developing and implementing geo-technical hazard mitigation measures and responding to geogeo-technical disasters or extreme events. The findings reported in this study will provide geotechnical leaders in transportation with an overview of what tools and techniques their colleagues are using and how effective those tools and techniques are for mitigating geotechnical hazards and responding to geo-technical disasters.
Geotechnical data encompasses a varied and complex set of information derived from field reconnaissance, subsurface explorations, field tests, laboratory tests, in-situ instrumen-tation, and remote sensing measurements. The data may consist of geologic setting, physical properties, or performance characteristics. Geotechnical data range in scale from laboratory tests of small samples to field measurements of mass performance, to wide-area images provided by satellite–borne remote sensing devices. Because these data come from many different sources in many different formats, the greatest challenge to those responsible for hazard mitigation and disaster response is often simply accessing, viewing, and interpreting geotechnical data in a consistent and convenient format.
The natural phenomena that lead to hazards or disasters with a geotechnical component may have geological origins (e.g., earthquakes or volcanoes) or meteorological origins (extreme precipitation or temperature, etc.). Hazards, disasters, and extreme events with a geotechnical basis include landslides, rockfalls, settlement, sinkholes, and many other events that can degrade or destroy a transportation system.
Ideally, every geotechnical hazard associated with a transportation system would be miti-gated before a disaster occurs. However, this is not feasible. The economics of mitigating every hazard is unachievable and our ability to recognize, prioritize, and mitigate hazards is imperfect. Consequently, a certain level of risk in building and maintaining transportation systems must be accepted; the most dangerous hazards must be mitigated, and disasters must be responded to as they occur. The role of visualization of geotechnical data is to help reduce those risks by more efficiently identifying hazards and improving mitigation efforts, disaster response, and disaster recovery.
Although the hazards and potential disasters and extreme events may vary from state to state, and even region to region, the effective use of GDV tools and methods in one location can be expected to apply to a range of conditions, events, and objectives in another location. A goal of this study was to identify the GDV approaches that are most effective for hazard mitigation and disaster response and recovery.
Mitigation and response to geotechnical disasters or extreme events are part of the transpor-tation emergency management cycle. Mitigation of a geotechnical hazard occurs during the preparation phase, with an objective of avoiding or minimizing hazards and reducing disaster consequences. During the response phase, immediately following a disaster, the focus is on public and worker safety and minimizing transportation system delays or detours. Mitigation also occurs during the recovery phase of restoring the transportation system to a pre-event level of service. Recovery mitigation is also an opportunity to make improvements to aging infrastructure by rebuilding a more resilient transportation system than existed previously.
The primary sources of information for the study were a literature review; a survey of U.S. state department of transportation (DOT) geotechnical leaders; and interviews with selected railroad and pipeline geotechnical personnel, visualization research leaders in academia, and GDV software vendors.
The literature review was used to obtain an overview of the research and development (R&D) underway in the field of GDV and to sample the case histories that illustrate the value and limitations of GDV in practice. An exhaustive list of all publications from as few as the last 10 years would likely run to thousands of citations. Consequently, the bibliography attached to this report is only a small sampling of the more recent publications. Considering the current and likely continuing rapid pace of technological change, preference in building the bibliography was given to more recent publications.
The publications found in the literature review represent a broad spectrum of GDV pur-poses, technologies, and methods. Although the publications that describe case histories or new methods are usually for a specific transportation system type (e.g., road, rail, or pipeline), the lessons learned and methods described are generally applicable to any transportation system.
It is interesting to note that in the literature there are a number of introspective studies of the impact of visualization technology on the productivity, quality, and mission support in the sciences and engineering. The conclusion of these studies is that, despite cost and imple-mentation challenges, visualization technology has improved the pace, quality, and depth of understanding in the fields where it has been applied.
A survey of state DOT geotechnical leaders was undertaken to determine the type and quantity of natural phenomena and geotechnical hazards that they face, what geotechnical data they collect, store and use, and what tools they have at their disposal to visualize geo-technical data; and to gauge the frequency and effectiveness of their use of visualization in mitigating geotechnical hazards and responding and recovering from geotechnical disasters and extreme events. The survey was sent to the geotechnical leaders of the 50 states, the District of Columbia, and Puerto Rico. Responses were received from 41 states and Puerto Rico, a response rate of 81%.
On average, state DOT geotechnical leaders and their staffs face five different natural hazards and seven geotechnical hazards, with some states having as many as eight natural phenomena hazards and 12 geotechnical hazards to contend with. Although natural hazards with a geological origin such as earthquakes were reported by many states, the majority of the natural phenomena hazards the states face are meteorological.
To identify and mitigate this array of hazards, the state DOTs collect, store, and use a wide range of geotechnical information including exploration and test data, instrumentation
Image credit: U.S.DOT http://www.dot.gov/sites/dot.
dev/files/docs/Disaster_ National_Transportation_
Geotechnical data management practices among DOTs range from manual data collection and paper files to the latest instrument data acquisition systems and sophisticated, centralized information management systems.
The general consensus among the state DOT geotechnical leaders is that visualization of geotechnical data is valuable for hazard mitigation and disaster response. However, many of the DOTs noted that a significant gap exists between the desired level of data availability and visualization tools and their current ability to achieve that level.
Interviews with geotechnical leaders in other transportation system arenas (rail and pipe-line), indicated that they are faced with similar geotechnical hazards, disasters, and extreme events. However, because they represent for-profit organizations, they can more aggressively integrate visualization tools and other technologies into their decision-making processes than may be possible at the state agencies, where a multitude of goals compete for finite funding.
The R&D underway in the academic world bodes well for the improvement and wide-spread use of visualization of geotechnical data; not just for hazard mitigation and disaster response, but for geotechnical engineering in general. Much of the R&D is focused on soft-ware, hardsoft-ware, and data management, but development of improved human-machine inter-action may prove to be the most valuable outcome of this research.
Key findings of the literature review, survey, and interviews may be summarized as follows:
• The natural phenomena hazards that threaten transportation systems throughout the United States include hazards of geological origin, but are dominated by meteorological hazards.
• Almost every type of geotechnical hazard threatens transportation systems, but the most common are unstable rock or soil slopes and embankments, settlement issues, and sinkholes.
• The most costly hazards are unstable rock or soil slopes and embankments.
• Traditional geotechnical, instrument, and remote sensing data are collected and retained, but some DOTs have yet to implement systems to readily access and visualize the data.
• Most DOTs report that geotechnical hazard mitigation is generally successful and that visualization of geotechnical data has an important role in identifying hazards and implementing mitigation measures.
• Most geotechnical leaders would like to have a substantial amount of geotechnical data available online and on site during geotechnical disaster response, but relatively few have the facilities to accomplish this goal.
• When available, GDV plays an important role in responding to geotechnical disasters.
• Visualization of geotechnical data also has an important role in long-term recovery from geotechnical disasters.
WHAT IS GEOTECHNICAL DATA VISUALIZATION?
Although there are a wide variety of potential visualization approaches and tools, geotechnical data visualization (GDV) for hazard mitigation and disaster response and recovery can be very broadly defined as graphic presentation of geotech-nical data in an attempt to gain insight into the nature of the problem at hand, and that which can then be used to develop potential solutions for that problem. The graphic presenta-tion could range from a simple X-Y plot to an interactive, three-dimensional view of subsurface conditions in a trans-portation corridor.
The diagram in Figure 1 illustrates the factors—user, sit-uation, objective, data, and tools—that generally influence what, how, and when GDV is used. Clearly, there will not be one GDV solution for every case: Each user may have different skills, tools, and goals; and each situation will have unique conditions and timing. The objectives and the type and extent of the available data will vary from case to case. While the factors shown in Figure 1 may lead to widely dif-ferent GDV approaches for difdif-ferent situations, their com-mon thread and significant characteristic is a transformation from data to understanding.
Another definition applicable to visualization of geo-technical data for hazard mitigation and disaster recovery is found in the Federal Lands Highway Division’s Design
Visu-alization Guide (http://www.efl.fhwa.dot.gov/manuals/dv) and shown at the bottom of column one While this guide focuses on the visualization of design concepts in the con-text of answering the question “How will the project look when it is done?”, the tools and techniques presented in the guide could be adopted and adapted to visualization of geotechnical data for hazard mitigation and disaster recovery.
The Design Visualization Guide presents a range of routine and innovative visualization tools and techniques including image acquisition, photograph manipulation, interactive and animated two- and three-dimensional applications, stereo-scopic imaging, analytic simulation, and schedule- or event-driven four-dimensional visualizations (space and time).
STUDY METHODOLOGY
The methods used to gather the information for this study consisted of the following:
• A questionnaire submitted to the geotechnical leaders at the 50 U.S. state Departments of Transportation (DOTs) and others
• Literature search, review, and synthesis
• Interviews with geotechnical leaders at several rail and pipeline transportation agencies or companies
• Interviews with several GDV leaders in academia
• Interviews with GDV software vendors.
Study Questionnaire
The purpose of the study questionnaire was to
• Determine the nature of geotechnical hazards and disas-ters faced by the state DOTs and others in the transpor-tation sector
• Understand their data management and processing environment
• Ascertain how they use GDV tools and techniques to – develop and implement geotechnical hazard
mitiga-tion measures
– respond to geotechnical disasters and extreme events
• Obtain their opinion about the use and value of GDV tools and techniques.
chapterone
INTRODUCTION
Design visualization could be defined at its simplest as the simulated repre-sentation of a design concept and its contextual impacts or improvements. Traditionally, design visualization (DV) techniques have been directed towards better communication of what the design will look like. This focus has driven a broad application of DV in the public involvement area: Visualization is almost always a required component of large-scale infrastructure and transportation projects. More recently, the focus has been the integration of DV into the overall notion of “context sensitive” design.
The questionnaire, included in Appendix A, consisted of 37 primarily closed-end questions organized in the following six sections:
1. Hazards, Disasters, and Extreme Events 2. Geotechnical Data Management 3. Hazard Mitigation to Avert Disaster
4. Responding to Disasters and Extreme Events
5. Long-Term Recovery from Disasters and Extreme Events
6. Evaluation and Opinion.
Section 1 addressed the types of natural phenomena, geo-technical hazards, and geogeo-technical disasters encountered by the DOTs. The natural phenomena in a region (geologi-cal and meteorologi(geologi-cal) generally determine the types of geotechnical hazards and disasters that may occur. An iden-tical list of geotechnical hazards and geotechnical disasters was provided in this section under the presumption that any geotechnical hazard, if not mitigated, could become a geotechnical disaster.
Section 2 was used to assess how the DOTs collect, pro-cess, store, and use geotechnical data when developing and implementing hazard mitigation measures or when
respond-ing to disaster or extreme events. The general categories of the questions in this section were:
• Geotechnical data collection, storage, and retention
• Geotechnical instrumentation usage and processing
• Geotechnical remote sensing usage and sources
• GDV software usage and users.
Section 3 was used to determine the types of hazards the DOTs have attempted to mitigate, and how and when they have used GDV in these efforts. Respondents were asked to identify successful and unsuccessful mitigation efforts. They were also asked to identify how and when GDV is used in a mitigation project and how visualization affected the outcome of their mitigation projects.
Section 4 was used to assess how the DOTs use GDV when responding to disasters. These questions focused on the use of geotechnical data in the emergency response immediately following the occurrence of a disaster.
Section 5 was used to assess how the DOTs use GDV to facilitate long-term disaster recovery. Respondents were asked to identify the most useful geotechnical data for long-term recovery and to specify how visualization of the data helped achieve recovery.
FIGURE 1 The factors—user, situation, objective, data, and tools—that generally influence what, how, and when GDV is used.
The questions in Section 6 addressed the frequency and level of use of GDV by the DOTs and were used to gauge their opinion on the utility and value of GDV in hazard mitigation and disaster response.
Responses to the survey questions are summarized in matrix form in Appendix B and commentary by the study authors is presented in Appendix C.
Literature Review
The literature review consisted of a search for national and international journal articles, conference proceedings, ref-erence works, academic research, thesis publications, and textbooks related to the collection, storage, processing, and visualization of geotechnical data. The search was not limited to uses specific to geotechnical hazard mitigation or disaster and extreme event response, as it can be expected that some GDV tools and methods that have been found to be effec-tive in general geotechnical practice would also be effeceffec-tive in such cases. Because of the large number of references found in the literature search, the search results were filtered to remove references less applicable to the study objectives. The search results were further filtered by removing refer-ences that were more than about 10 years old and referred to outdated technologies.
Interviews
Geotechnical leaders at several railroad and pipeline compa-nies were interviewed in order to evaluate the similarities and differences to the state DOTs’ approach to geotechnical hazard mitigation and disaster response, and to gauge their companies’ use of GDV. Interviews were conducted with Frank Wuttig of Alyeska Pipeline Company, Lewis Ruder of the Burlington Northern–Santa Fe Corporation, and Dr. Caleb Douglas of the Union Pacific Corporation.
Interviews with academic R&D leaders were conducted to gain an understanding of the potential future of GDV. These interviews were directed to researchers who are focusing on visualization of natural phenomena and geotechnical hazards and who are exploring the challenges of transferring research and new technologies to geotechnical practice. Interviews were completed with Dr. Michael Olsen at Oregon State University, Dr. Tony Szwilski at Marshall University, and Dr. Gregory Jones at the Scientific Computing and Imaging Institute of the University of Utah.
Several developers and vendors of GDV software were also interviewed to examine how their industry participates in the transfer of visualization technology from research to practice. The software vendors were also requested to provide examples images from their GDV software.
DEFINITIONS
The following definitions were provided in the preamble to the questionnaire sent to the state DOT geotechnical leaders:
• Hazard: Condition or situation with the potential to cause harm.
• Disaster: Outcome of a hazard when it changes from potential event to actual event.
• Geotechnical Data Visualization: Viewing and/or ana-lyzing geotechnical data using visual software. The following additional definitions are provided to clar-ify terms used in this report:
• Natural phenomena hazard: A natural condition or extreme event that may threaten a transportation system.
• Geotechnical hazard: A threat attributable to the soil, rock, and/or groundwater beneath or adjacent to a trans-portation system.
• Geotechnical hazard mitigation: Identification, moni-toring, design, and construction of mitigation measures for a geotechnical hazard.
• Geotechnical disaster response: Immediate and short-term response to a geotechnical event to assist in rescue efforts, protect public and worker safety, and reduce transportation system delays or detours.
• Geotechnical disaster recovery: Long-term recovery from a geotechnical event to restore public safety and transportation system functionality.
Several systems of classifying natural phenomena haz-ards have been proposed. For example, the Organization of America States (OAS) has proposed the classification system shown in Table 1 (http://www.oas.org/dsd/publica tions/Unit/oea54e/ch05.htm) and the Centre for Research on the Epidemiology of Disasters (CRED) in Europe has pro-posed the system shown in Table 2 (http://www.emdat.be/ classification). Although each of these systems has its pur-poses and advantages, for report purpur-poses it is simpler to classify natural phenomena hazard origins as geological or meteorological (including climatologic and hydrologic sources) because geotechnical hazards may arise from mul-tiple natural phenomena hazards: For example, an unstable slope may arise from seismic activity (geological origin) or extreme precipitation (meteorological origin). The survey of state DOT geotechnical leaders indicates that as many as
90% of the geotechnical disasters they have encountered are the result of meteorological events.
Geotechnical hazards can be naturally occurring condi-tions (e.g., unstable slopes or soft soils) or can arise from the constructed features of a transportation system (embankment fills or cut slopes, etc.). The most commonly encountered geo-technical hazards are summarized in Table 3. This table also identifies the potential origin(s) of the geotechnical hazard.
Although the hazards may vary from state to state, and even region to region within a state, the effective use of GDV tools and methods in one location can be expected to apply to a range of conditions, events, and objectives in another location.
The following are several examples of natural phenomena that have led to geotechnical disasters and damage to trans-portation systems.
EXAMPLES OF NATURAL PHENOMENA Landslide, Oso, Washington, March 2014
The landslide disaster of March 22, 2014 near Oso, Wash-ington (Figure 2), cost more than 40 lives, temporarily dammed the Stillaguamish River, and blocked Washington State Route 530. The landslide occurred after a period of unusually intense rainfall, but the specific causes of the land-slide are still under investigation. A U.S. Geological Survey (USGS) website (http://www.usgs.gov/blogs/features/usgs_ top_story/landslide-in-washington-state/) has several other examples of GDV for this disaster. In addition to a lidar (light detection and ranging) image similar to the one shown in Figure 2, the website has a video of a landslide runout model and seismograph records used to confirm that the landslide was not caused by an earthquake. While use of high resolu-tion lidar images and other visualizaresolu-tion techniques would not change the need to route a highway through this valley, the newer images will likely improve the understanding and perception of risk to lives and infrastructure.
Rockfall, Thermopolis, Wyoming, 2002
The rockfall on a railway embankment shown in Figure 3 occurred after spring runoff eroded the soil underlying a tufa formation. Note the ties and rails in the right-center of the
chaptertwo
Category Hazard Examples Atmospheric Hailstorms, hurricanes, lightning, tornadoes, tropical storms
Seismic Fault ruptures, ground shaking, landslides, lateral spreading, liquefaction, tsunamis, seiches
Other Geologic or Hydrologic
Debris avalanches, expansive soils, landslides, rockfalls, submarine slides, subsidence Hydrologic Coastal flooding, desertification, salinization, drought, erosion and sedimentation, river
flooding, storm surges
Volcanic Tephra (ash, cinders, lapilli), gases, lava flows, mudflows, projectiles and lateral blasts, pyroclastic flows
Wildfire Brush, forest, grass, savannah TABLE 1
HAZARD CLASSIFICATION SYSTEM (OAS)
Hazard Subgroup Definition Hazard Main Type
Geophysical Events originating from solid earth Earthquake, volcano, mass movement (dry)
Meteorological Events caused by short-lived, small to meso-scale atmospheric processes (in the spectrum from minutes to days)
Storm
Hydrological Events caused by deviations in the normal water cycle
or overflow of bodies of water caused by wind set-up Flood, mass movement (wet) Climatological Events caused by long-lived, meso- to macro-scale
processes (in the spectrum from intra-seasonal to multi-decadal climate variability)
Extreme temperature, drought, wildfire TABLE 2
HAZARD CLASSIFICATION SYSTEM (CRED)
Hazard
Hazard Origin Natural phenomena
Human action Geological1 Meteorological2
Slopes (natural or cut) x x x
Embankments x x Slope Creep x x x Rockfalls x x x Avalanches x x x Debris Flows x x x Settlement or Heave x x x Sinkholes x x x Subsidence x x x Lateral Spreading x Liquefaction x Surface Ruptures x Frost Heave x Permafrost Thaw/Freeze x
Frozen Debris Lobes x x
Tsunamis x
Seiches x x
Storm Surge x
Wind Blown Soil/Dunes x x
1Earthquakes, volcanoes.
2Includes hydrological and climatological phenomena.
TABLE 3
photograph that were pushed off the embankment by the rockfall. A better understanding of the local geology and seasonal groundwater conditions might have led to hazard mitigation measures that could have avoided this disaster.
Earthquake Sand Boils,
Seattle, Washington, February 2001
Among the many consequences of the February 28, 2001, earthquake centered near Nisqually, Washington, was the appearance of sand boils on King County International Air-port (aka Boeing Field) taxiways and runways. Liquefied sand was ejected through pavement joints and cracks opened by the 6.8 (moment magnitude scale) earthquake as shown in Figure 4. The sand boils occurred in limited areas on the taxiway, runway, and in adjacent grass-covered areas, indi-cating that liquefiable soils in the airport subgrade may be isolated. The airport is built on a former river floodplain, which may have buried channels of liquefiable soils that led to the limited sand boil area. Although the airport area is almost entirely paved, air photographs from areas upstream
of the airport indicate the presence of buried former river channels.
Debris Flows, Beartooth Highway, Montana, May 2005
A spring rain-on-snow event in the Beartooth Mountains of eastern Montana resulted in massive debris flows that dam-aged 13 locations on the steep hairpin highway leading to an eastern entrance to Yellowstone Park. Figure 5 shows two of the damage locations (note the damage to the upper switch-back near the top of the photograph).
Because this highway provides access to the park and is critical to local economy, a design-build team was awarded a contract to restore the highway in a single construction sea-son rather than using a traditional design-bid-build contract that might have taken more than two years to complete.
GDV tools played a critical role in rapid assessment, design, and construction of the repairs. The primary visual-ization tools were air photography and the visualvisual-ization fea-tures of the stability and retaining wall design tools used by the team. Design and construction was a dynamic process:
FIGURE 2 Landslide, Oso, Washington, March 2014. (Image credit: Puget Sound Lidar Consortium, 2013.)
FIGURE 3 Rockfall, Thermopolis, Wyoming, 2002. (Photo credit: D. McCulloch.)
FIGURE 4 Nisqually Earthquake, February 2001, sand boils, Boeing Field Taxiway, Seattle, Washington. (Photo credit: M. Anderson.)
Concepts were developed, designs advanced, equipment mobilized, and materials ordered as explorations, excava-tions, and construction were in progress. Repairs were com-pleted in four months at an estimated savings of $6 million.
Landslide and Debris Flow, Bonners Ferry, Idaho, October 1998
The following description of the geotechnical disaster that damaged two roads and a railroad is from the National
Oce-FIGURE 5 Debris flow, May 2005, Beartooth Highway, Montana. (Photo credit: Montana Department of Transportation.)
FIGURE 6 Landslide, October 1998, Bonner’s Ferry, Idaho. (Photo credit: D. Krammer, Disaster Services, Boundary County, Idaho.)
anic and Atmospheric Administration’s National Geophysi-cal Data Center (http://www.ngdc.noaa.gov/hazardimages):
On October 15, 1998, more than 200,000 [cubic yards] of mud gushed out of North Hill. It covered up a county road, and destroyed a portion of Union Pacific track and a 200-yard area of Highway 95. The mass of mud buried almost one million dol-lars worth of equipment. Note the rails still suspended in air after the collapse of material beneath them. Highway 95, Idaho’s only major north-south route, was closed [for] three weeks because of the slide.
The buried equipment was being used to cut into the toe of slope. The cut exposed saturated, soft and loose, prehistoric glacial lake sediments which are seen in the debris runout in the lower part of the photograph in Figure 6.
The greatest challenge to those responsible for hazard miti-gation and disaster response is often simply accessing, view-ing, and interpreting geotechnical data in a consistent and convenient format. The following sections provide an over-view of geotechnical data sources and the methods used to store and access the data.
RECONNAISSANCE, EXPLORATION, AND TESTING
The variety and complexity of geotechnical data obtained by field reconnaissance, exploration, and field and labora-tory testing can be demonstrated by a review of any of sev-eral guidance documents for geotechnical investigations. For example, the Manual on Subsurface Investigations (AASHTO 1988) lists more than 20 general subsurface data requirements concerning stratum boundaries, groundwater, foundation support, slope stability, seismicity, material prop-erties, and so on. These data requirements are applicable to roadways, air fields, rail and transit track beds, tunnels, cul-verts and pipes, cuts and fills, and associated transportation structures.
The AASHTO manual also includes guidance for con-ducting, compiling, and presenting geotechnical data from field reconnaissance, engineering geophysics, subsurface exploration, in situ testing, hydrogeologic investigation, and laboratory testing of soil and rock.
INSTRUMENTATION
Instrumentation is a general term for sensors and data acquisition devices used to measure temporal changes in soil, rock, groundwater, and structures. Instrumentation is distinguished from remote sensing (see next section) in that the sensor is installed in or on the ground or structure; whereas remote sensing devices provide measurements without being in contact with or modifying the measured object.
Geotechnical instrumentation includes piezometers, slope movement devices, displacement and strain gages, exten-someters, pressure cells, thermistors, and other sensors that are used to repeatedly measure the condition of the soil, rock, groundwater, or structure at a specific location and time. These instruments are generally precise,
accu-rate, and robust; and can be left unattended and monitored remotely. Instrumentation automation is essential for rapid visualization of geotechnical measurements. Most geo-technical instrumentation has the disadvantage of provid-ing point measurements in situations that may require more comprehensive measurements; and, in some instances, the installation of the instrument can alter the original con-dition of the soil, rock, groundwater, or structure being measured.
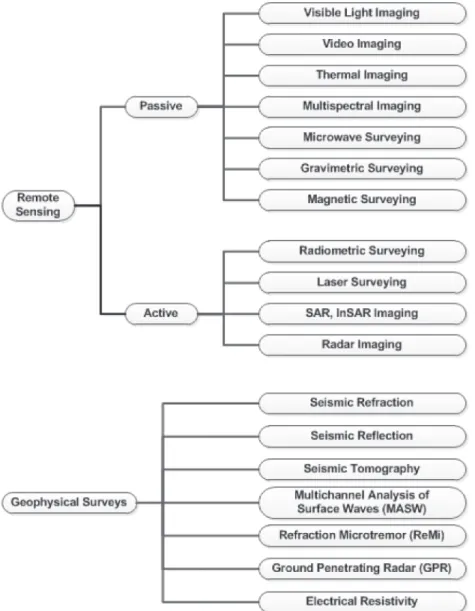
REMOTE SENSING DEVICES
As noted, remote sensors are a special class of instruments that acquire information without being in contact with or modifying the object or area being measured. Some of the remote sensing technologies that are commonly used to acquire geotechnical and geophysical data are shown in Fig-ure 7. Remote sensing devices are generally classified as pas-sive or active, depending on whether they rely on reflected wave energy or emit and receive wave energy from the object being measured.
GEOPHYSICAL DEVICES
Remote sensors for geophysical applications are a sepa-rate group of devices used to measure gravitational, mag-netic, electrical, or seismic properties of the subsurface. The devices generally require a driving force, and the ground response to the driving force is measured by passive sen-sors. The devices provide a relative measure of subsurface properties which can be used to infer such features as dif-fering soil unit thickness, location of soft zones or voids, or groundwater depth.
Remote sensing devices can be airborne (aircraft or satellite) or ground-based. Many remote sensors can only acquire ground surface data, but geophysical remote sens-ing devices can provide images of subsurface conditions. A comprehensive review of spaceborne and airborne remote sensing for geotechnical applications is provided in Rathje et al. (2006).
Although the precision and accuracy of remote sensors vary widely, some devices can provide sub-millimeter accu-racy. Specialized software and personnel are generally required to process raw remotely sensed data, but processed remote
chapterthree
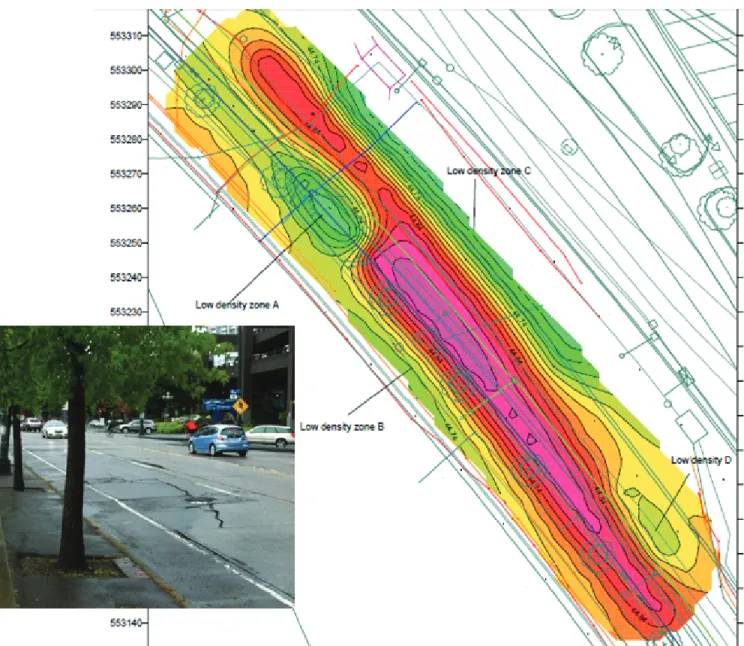
FIGURE 8 Bouguer microgravity survey of low density subgrade. (Contour plot credit: Parsons Transportation Group.) (Photograph credit: P. Van Horne.)
sensing images and surveys are available from several public and commercial sources.
An example of a remote sensing method is shown in Fig-ure 8. The colored contours in the plan view are the results of a Bouguer microgravity survey (gravimetric survey) to
determine the extent of potential voids or low density sub-grade beneath a roadway pavement. The green and yellow contours indicate locations of potential voids or low density subgrade. The distressed pavement in the curbside lane of the roadway shown in the photograph is identified as “Low density zone A” in the plan view.
Approximately 200 national and international journal arti-cles, conference presentations, academic research reports, and thesis publications related to the collection, storage, processing, and visualization of geotechnical data are pro-vided in the bibliography of this study report. The bibli-ography was developed from focused searches of British Library Inside Conferences, Civil Engineering Abstracts, Earthquake Engineering Abstracts, EI Compendex, GEO-BASE, GeoRef, National Technical Information Service, ProQuest Dissertations and Theses, Transport Research International Documentation (TRID), and the web. The searches used key words related to visualization of geo-technical data without restricting the search results to spe-cific reference to geotechnical hazard mitigation or disaster response. The search results were filtered visually to remove any off-topic results.
The distribution of the sources of the bibliography entries is shown in Figure 9. Although the sampling procedure for the bibliography was not random, more than 40% of the entries are from dissertations, which is likely a reflection of the level of interest in GDV in academia.
The distribution of the major topics of the bibliographic entries is shown in Figure 10. The major topic categories were defined as:
• Hazards: Identification, classification, mitigation, or visu-alization of natural phenomena and geotechnical hazards.
• Instruments: Use of geotechnical instruments or instru-mentation software for hazard monitoring.
• Remote sensing and geophysics: Use of remotely sensed data or remote sensing software for geotechnical hazard or disaster monitoring.
• Geographic Information System (GIS): Use or develop-ment of geospatial techniques for geotechnical hazard or disaster monitoring and evaluation.
• Risk: Application of risk assessment or risk analysis methods to geotechnical hazard mitigation or disaster response.
• Data management: Use or development of data manage-ment methods to organize and visualize geotechnical data.
• Modeling: Use or development of numerical or physical models to evaluate geotechnical hazards.
• Technology: General discussion of the state and future of GDV techniques and software.
Many of the entries could fall in two or more categories. For example, several of the entries categorized as “remote sensing” also address incorporating the remotely sensed data into a GIS application.
The major takeaways from the literature review are: one, the breadth and depth of the technologies and methods being developed and used for visualization of geotechnical data; and two, the pace at which this technology changes. The new developments and applications will improve geotechnical engineering professionals’ ability to visualize and solve geo-technical hazard mitigation and disaster response issues; but it will also challenge them to keep abreast of and adopt the new technologies.
chapterfour
LITERATURE REVIEW
FIGURE 10 Bibliography subject distribution. FIGURE 9 Bibliography source distribution.
The data visualization tools available to the practicing geo-technical engineer range from simple x-y graphing programs to sophisticated software systems that integrate multiple graphics tools with complex databases and data and image acquisition software. Visualization software is available in proprietary and open-source formats. Open-source software is developed and supported by an online community of develop-ers and usdevelop-ers and is generally free to the end user. Most of the GDV tools available today are desktop software programs; but online, cloud-based tools are becoming more available.
Geotechnical engineers have the multiple challenges of identifying which visualization tools to apply in any situation (e.g., hazard mitigation, disaster response); knowing how to effectively apply the tools; and keeping abreast of new tech-nology. The following sections provide an overview of the available types and variety of GDV software.
Although this study report is focused on visualization of geotechnical data for hazard mitigation and disaster response, the visualization tools discussed in this report are equally applicable to transportation system activities such as planning, design, construction, and maintenance. The number of different software programs cited in the following sections was deter-mined from a search of the geotechnical literature and Internet for geotechnical software vendors, open source organizations, and online software providers (see Figure 11). The software titles identified in the search are listed in Appendix D. Inclusion of a software title in these lists does not imply an endorsement of the product by the National Academies of Science or the TRB. There may be other software programs not identified by this search that are being used by geotechnical professionals.
SPREADSHEET SOFTWARE
There are about three dozen different proprietary desktop spreadsheet programs; at least seven proprietary online spread-sheet programs; and a dozen or so open-source spreadspread-sheet pro-grams available. Despite this variety, every geotechnical leader at the DOTs and railroad and pipeline companies reported that they and their staff use the same desktop program. The advan-tages of using a common spreadsheet program include ease of sharing data and methods.
The most common use of spreadsheet programs for visu-alization of geotechnical data is to generate x-y graphs to
explore and illustrate data relationships. Most spreadsheet programs also have the capability to generate pie, bar, and other chart types that may be useful in geotechnical engi-neering practice.
The widespread use of spreadsheet programs in visualiz-ing geotechnical data is a double-edged sword. A spreadsheet program provides powerful calculation and visualization capabilities while being relatively easy to learn. However, the proliferation of spreadsheet files can be a data and file management challenge and difficult to maintain with a high level of quality control. Concern for spreadsheet qual-ity control led to formation of the European Spreadsheet Risks Interest Group (http://www.eusprig.org/index.htm). Although most of the cautionary tales on this website refer to disciplines other than engineering, the lessons learned and advice offered are applicable to geotechnical uses of spreadsheet programs.
BORING LOG GENERATORS
Boring logs are generally the geotechnical engineer’s pri-mary method of visualizing and presenting subsurface infor-mation. Whether they are soil boring logs, rock core logs, cone penetration test logs, or any of a number of other sub-surface explorations, the log typically contains a visual rep-resentation of one or more subsurface data elements versus depth or elevation (see Figure 12). This visual representation provides the geotechnical engineer with a first-order analysis of soil or rock layering, groundwater location, and material properties.
A boring log (or other log type) generator is a software program that accepts user data input, stores the data electron-ically, and outputs a completed log to hard copy or an elec-tronic file. Most boring log generators required that the data be input manually, but some have the capability of accepting data from hand-held mobile devices.
Approximately 40 proprietary and shareware desktop bor-ing log generators are available; although spreadsheet and computer-aided drafting (CAD) programs are also used to generate boring logs. The most comprehensive boring log gen-erators are supported by a desktop or server database and can be used for logs of soil, rock, core penetration tests, and other subsurface explorations.
chapterfive
Approximately 80% of the DOTs surveyed use the same vendor’s boring log generator.
FENCE DIAGRAM GENERATORS
The fence diagram is the geotechnical engineer’s second-order method of visualizing and presenting subsurface infor-mation as it merges the inforinfor-mation from several subsurface explorations to create a cross-sectional view of soil or rock layering, groundwater location, and material properties (see Figure 13).
There are a dozen or so proprietary desktop fence diagram generators available to the geotechnical engineer. The ability to generate fence diagrams is integrated with several of the boring log generators described previously.
FIGURE 11 Geotechnical data visualization software used.
Approximately 70% of the DOTs surveyed use the same vendor’s fence diagram generator.
LABORATORY SOFTWARE
Laboratory software includes programs to control laboratory tests, record laboratory data, convert the data to meaningful engineering units, and visualize and present laboratory test results.
More than 80 proprietary desktop laboratory programs are available to geotechnical laboratory technicians and engi-neers. Some of these programs only calculate the results of a specific test or control and measurement, but many have at least a rudimentary capability to visualize test results. The most comprehensive laboratory programs are supported by a desktop or server database, have strong visualization fea-tures, and integrate well with other geotechnical applications. Approximately 60% of the DOTs surveyed use laboratory software. Despite the wide variety of commercial software available, approximately 20% use department-developed pro-grams or spreadsheets to record, calculate, and visualize their laboratory data.
GENERAL PURPOSE DATABASE SOFTWARE
General purpose database software includes proprietary and open-source programs that efficiently collect, store, and retrieve large quantities of geotechnical data. This software
is often used in conjunction with other software applications, such as the boring log generators and laboratory software described previously.
At least a dozen geotechnical-oriented proprietary desk-top database programs are available. These applications can be used to store a wide variety of geotechnical data includ-ing exploration data, laboratory data, and analytical results. These applications are built on the same proprietary or open-source database engines that underlie many database appli-cations in other disciplines.
About 46% of the DOTs surveyed use general purpose database software to support visualization of geotechni-cal data. However, no single vendor’s software dominates this area.
GENERAL PURPOSE X-Y GRAPHING SOFTWARE
In addition to the ubiquitous spreadsheet, there are more than 100 proprietary and open-source x-y graphing programs available for the desktop or on line. This software is used to visualize data relationships and time trends for field and labo-ratory data. Some of these programs also have basic statistical analysis capabilities.
About 40% of the DOTs surveyed report using general purpose x-y graphing software; however, approximately half are using spreadsheet software for this purpose.
GENERAL PURPOSE CONTOURING SOFTWARE
Contouring software is used to visualize three-dimensional data. The most frequent geotechnical use concerns ground surface topography and subsurface contacts, but the contouring is also useful for visualizing multi-dimensional data relationships; for example, contours of limit equilibrium factor of safety against sliding for a range of cohesion and angle of friction values.
Geotechnical engineers have a choice of about two dozen proprietary and open-source contouring programs. The major-ity of these programs are desktop rather than online applica-tions. The more comprehensive contouring programs have strong visualization features and can import three-dimensional data and support image overlays from a variety of sources.
About 40% of the DOTs are using contouring software. Among those DOTs using contouring software, approximately 35% are using CAD software for this purpose.
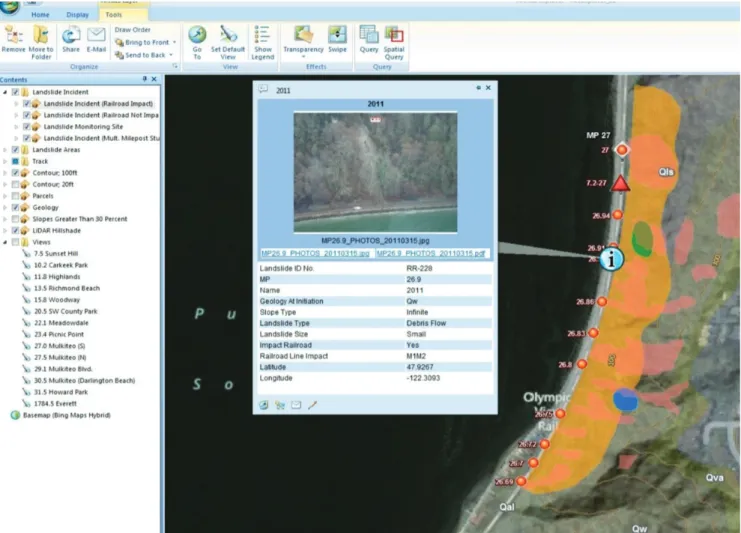
GEOGRAPHICAL INFORMATION SYSTEMS
GIS are a class of software that integrates spatial and other data with map-based visualization. GIS applications are especially useful for creating thematic maps and inter
-active maps that display the data behind the images on the screen.
There are about 20 proprietary desktop and server-based GIS software packages and eight open-source GIS packages. However, one software company currently dominates the GIS market; among the 46% of DOTs using GIS software, only one is using another vendor’s software.
The image in Figure 14 illustrates a typical GIS geotech-nical application. The colored overlays identify a landslide zone and specific landslides or debris flow events on a bluff above a major commuter and freight railroad. Each red sym-bol is the location of an investigation of a prior landslide or debris flow event. In the center of Figure 14 is a box pro-viding a photograph and additional information about the event, which can be retrieved by clicking on one of the event location symbols.
INSTRUMENTATION SOFTWARE
Instrumentation software includes programs to schedule, col-lect, process, and visualize data from an array of field-installed instruments. Some instrumentation software serves a specific instrument type; for example, inclinometer software is often