410 ISSN (print): 0031-9465 www.fupress.com/pm
Corresponding author: F. Calzarano E-mail: fcalzarano@unite.it
RESEARCH PAPERS
Patterns of phytoalexins in the grapevine leaf stripe disease (esca
complex)/grapevine pathosystem
Francesco CALZARANO1, Vincenzo D’AGOSTINO1, alessia PEPE1, Fabio OSTI2, FlaVio DELLA PELLE1, Mirko DE ROSSO3, riccardo FLAMINI3 and steFano DI MARCO2
1 Università degli Studi di Teramo, Facoltà di BioScienze e Tecnologie Agro-Alimentari ed Ambientali, Via Renato Balzarini, 1,
64100 Teramo, Italy
2 CNR, IBIMET, Via Gobetti 101, 40129 Bologna, Italy
3 CREA-VIT, Viale XXVIII Aprile 26, 31015 Conegliano (TV), Italy
Summary. Vineyards containing vines affected with grapevine leaf stripe disease (GLSD), one of the diseases of the esca complex, suffer losses in grape yield and quality every growing season. To examine the relation between GLSD foliar symptoms and levels of phytoalexins in grapevine, phytoalexin levels were monitored in the leaves of symptomatic, asymptomatic/diseased, and healthy grapevine leaves, at various growth stages, in two vineyards in Italy, over four growing seasons. At the same time, the leaf symptoms of the vines at some of those growth stages were recorded in each vineyard and in each growing season. The compounds extracted and identified were:
trans-resveratrol, trans-pterostilbene, trans-ε-viniferin and trans-δ-viniferin. The most common phytoalexin found
was resveratrol. Amounts of all the phytoalexins were generally greater in symptomatic leaves than in asympto-matic/diseased or healthy leaves. In symptomatic leaves, resveratrol levels were greatest at pre-bunch closure, and peaks in pterostilbene occurred at the same time. Leaves of each category (symptomatic, asymptomatic/ diseased, healthy) had lower amounts of these compounds at veraison and generally higher amounts at the stages of harvesting and/or the softening of berries. It seems therefore that the formation and pattern over time of the phytoalexins was linked to the growth stage of the vines. Leaf symptoms never occurred before pre-bunch closure, but became much more common from veraison to harvest. This study provides evidence of a relationship between the levels of phytoalexins, grapevine growth stage, and the seasonal pattern of development of GLSD symptoms.
Key words: phytoalexins, GLSD, leaf symptoms.
Introduction
Grapevine leaf stripe disease (GLSD) is one of the grapevine wood diseases that form part of the esca disease complex. GLSD is widespread in European vine-growing areas and causes losses in grape yield
and quality (Calzarano et al., 2001, 2004). GLSD is a trachaeomycosis caused by Phaeoacremonium aleophi-lum (Pal), [P. minimum sensu Gramaje et al. (2015),] and Phaeomoniella chlamydospora (Pch). This disease is also known as “young esca” and in combination
with the disease caused by the white rot fungus Fo-mitiporia mediterranea (Fmed) gives rise to the dis-ease termed “esca proper” (Surico, 2009). Pal and Pch colonise the vine wood, causing dark streaks and brown or reddish-brown necroses (Marchi et al., 2001; Surico, 2009). During colonization, these path-ogens produce toxins, toxic metabolites and wood degradation products (Evidente et al., 2000; Tabacchi et al., 2000) which find their way to the vine crown through the xylem vessels. These are thought to ac-tivate a defence response that results in the
develop-ment of leaf symptoms (Andolfi et al., 2011; Bertsch et al., 2013; Calzarano et al., 2013). However the precise physiological mechanisms which cause leaf symptoms have not been fully elucidated. In some
vines symptom severity decreases markedly over
one or a few growing seasons and this fluctuation is affected by environmental factors. In particular,
large amounts of rainfall early in the growing sea-son, increases the incidence of leaf symptoms in the
subsequent months (Marchi et al., 2006; Calzarano and Di Marco, 2007). That heavy rainfall increases
symptom severity was confirmed by an experiment
in which 20-year-old diseased vines grown in pots
were overwatered; this led to a significant increase
in the leaf symptoms (Surico et al., 2010). However, since vines heavily infected with Pal and Pch some-times remain completely asymptomatic in a growing season and, conversely, vines that are only slightly infected with these fungi may exhibit serious leaf symptoms, other factors are also likely to cause leaf symptoms (Calzarano et al., 2001, 2004; Calzarano and Di Marco, 2007).
GLSD symptoms initially consist in irregular chlorotic interveinal spots, which then coalesce, leaving only narrow lines of still green tissue along
the veins. Subsequently the chlorotic spots become
necrotic and assume a characteristic appearance re-sembling tiger stripes. The leaf symptoms are usual-ly accompanied by localised shrivelling of the shoots and a more or less extensive withering of the grape-bunches, which may also display typical black mea-sles (Mugnai et al., 1999). The factors causing these symptoms are complex, deriving both from the plant itself and from the environment. This probably
ex-plains why trials designed to artificially reproduce
the symptoms have never been entirely successful (Sparapano et al., 2001; Feliciano et al., 2004).
Since the damage caused by the disease is relat-ed to the severity of the leaf symptoms (Calzarano et al., 2001, 2004; Bertsch et al., 2013), tests have also been carried out to investigate why symptoms fail to appear in some growing seasons. By varying the mix of nutrients given to the vines it has been shown that nutrients have direct roles in the infection pro-cess (Osti and Di Marco, 2010). Nutrients may also
have indirect roles, since they affect the physiology of grapevines at different growth stages (Di Marco et
al., 2001; Calzarano et al., 2009). Moreover, in studies
on the nutritional status of vines suffering from esca
proper (sensu Surico, 2009), and on how leaf
fertilisa-tion affected leaf symptom expression, it was found
that calcium concentration was greater in diseased/ asymptomatic vine leaves than in symptomatic leaves. Thus calcium may have a role in limiting
symptom expression (Calzarano et al., 2009). These
findings have led to the development of a nutrient
mix that reduces the incidence and severity of leaf symptoms. This mix is based on calcium, magne-sium and extracts of algae, and is given during the plant growth period, when it is presumed that the mechanisms that will cause symptoms later in the season are primed (Calzarano et al., 2014).
Knowing how vines responds to infection by Pal and Pch is fundamental to understand how the dis-ease will progress during the rest of the growing
sea-son, and hence to design more effective methods of
management. In the Vitaceae the most common and characteristic response of plants to fungal infections is production of increased amounts of phytoalexins.
These are secondary metabolites produced aspecifi -cally in response to general growth constraints. In grapevine the phytoalexins are produced constitu-tively or in response to stress, either biotic or abiotic. (Dufour et al., 2013; Saigne-Soulard et al., 2015).
In Vitis vinifera the principal stress response phy-toalexins are stilbenes, the foremost component of which is resveratrol (trans-3,4΄.5-trihydroxy-stilbene). Resveratrol gives rise to the other phytoalexin stil-benes, such as pterostilbene
(trans-3,5-dimethoxi-4΄-hydroxy-stilbene), and the viniferins (Cichewicz
and Kouzi, 2002; Jeandet et al., 2002). Earlier studies reported the constitutive presence of resveratrol in the wood of grapevine and not in healthy leaves, so it was thought that resveratrol only accumulated in leaves in response to stress (Borie et al., 2004). More recent studies have shown that resveratrol is also a constituent of healthy leaves (Calzarano et al., 2004; 2013; Wang et al., 2010).
In the context of the esca complex, the levels of
phytoalexins in the organs of affected vines, or in vines at different growth stages, have been little studied. It is known that resveratrol and ε-viniferin levels rise significantly in grape wood colonised by the esca-complex pathogens (Amalfitano et al., 2000), and that pterostilbene inhibits the growth of Pch in vitro (Mazzullo et al., 2000). More recent studies have reported that the levels of resveratrol and other phe-nolic compounds increase in asymptomatic
GLSD-affected vine leaves after the leaf symptoms start to
appear (Lambert et al., 2013; Fontaine et al., 2016). Other studies have reported the expression of the genes of phenylalanine ammonia-lysase (PAL) and stilbene-synthase STS, which catalyse the formation of resveratrol and other related compounds, in the
vine leaves before and after the onset of symptoms (Magnin-Robert et al., 2011). This is correlated with the cultivar susceptibility to GLSD (Lambert et al., 2013). Preliminary studies have also examined the occurrence of resveratrol in leaves and berries of
GLSD-affected vines, but there are no reports on
the levels of phytoalexins accumulated in the
epi-geal portion of GLSD-affected vine plants over time
and at various growth stages (Calzarano et al., 2004, 2008).
The aims of the research reported here were i) to determine the levels and variations over time of phytoalexins during the growing season in leaves of
vines affected with GLSD, and in leaves of healthy
vines; ii) to record the incidence and severity of the foliar symptoms of GLSD at various plant growth stages over a number of growing seasons. The over-all aim was to determine whether there was any correlation between phytoalexin levels and GLSD
symptoms. A second objective was to assess effects of various vine growth stages on the seasonal fluc -tuations in phytoalexin levels, and on the leaf symp-toms that appeared.
Materials and methods
Optimising the extraction and clean-up of trans
-resveratrol and its derivatives in symptomatic leaves of GLSD-affected vines
The extraction and clean-up procedure was opti-mised using trans-resveratrol and trans-pterostilbene as target compounds, in order to maximise the ex-traction of all targeted stilbenic compounds. Trans-resveratrol and trans-pterostilbene were selected be-cause they are commercially available as standards
and can be considered model analytes for the other stilbene derivatives known as viniferins (dimers of resveratrol), since they exhibit similar chemical/ physical characteristics.
Sample preparation
Five hundred g of tiger-striped (GLSD-affected)
leaves taken from 20 symptomatic vines were
sub-jected to flash freezing by dipping them in liquid ni
-trogen for 90 s. The leaves were then finely ground (<
5 mm) in a blender (Moulinex, model A 505) at room temperature for 30 s. The powder obtained was
im-mediately subjected to two solid-liquid extraction
procedures (E1 and E2; below). Solid-liquid extraction (E1)
Fifty g of leaf powder was mixed with 150 mL of methanol and stirred for 20 min in an orbital shaker (300 rpm) in the dark. The sample was centrifuged for 5 min at 4800 rpm and 50 mL of supernatant was collected. The extract obtained (E1) was stored at –20°C in the dark. All the instruments used were pre-cooled, and the whole procedure was run in the dark.
Solid-liquid extraction (E2)
Three g of leaf powder was mixed with 15 mL of ethanol/water (80:20, v/v) and homogenised for 1 min with an ultra-turrax. The sample was centrifuged for 3 min at 4800 rpm, and the
super-natant transferred to a 50 mL capacity falcon flask
(Calzarano et al., 2008). The leaf residues were sub-jected to another extraction with 15 mL of ethanol/ water (80:20, v/v) following the procedure described above. The extracts obtained (E2) were collected in a
50 mL capacity falcon flask and stored at –20°C in the
dark. All the instruments used were pre-cooled and the whole procedure was run in the dark.
Liquid-liquid and solid phase extraction clean-up steps (LLE, SPE1 and SPE2)
The grapevine leaf extracts obtained with the
solid-liquid extraction procedures (E1 and E2) were
naturally rich in pigments (particularly chlorophylls) and other compounds. To remove these potentially interfering compounds from E1 and E2, three ex-traction/clean-up procedures were compared: one
liquid-liquid extraction and two solid phase extrac -tions (LLE, SPE1 and SPE2). Figure 1 shows the com-bination of the extraction and clean-up procedures that were carried out.
LLE procedure
Extracts E1 and E2 were each mixed with ethyl acetate (ethyl acetate/extract 1:1, v/v) and stirred for 5 min in an orbital shaker (300 rpm) in the dark. Each sample was then centrifuged for 5 min at 4800
rpm and the supernatant isolated. Subsequently, the
supernatant was washed with ethyl acetate, and the phases were separated as reported in the previous step. One mL of the alcoholic (E1) / hydro-alcoholic (E2) fraction obtained was collected (E1-LLE and E2-LLE) for analyses.
SPE1 procedure
Commercially available octadecyl C18 cartridges (1 g, 6 mL) (International Sorbent Technology) were used for the clean-up extraction step, as follows. Ex-tracts E1 and E2 were each diluted with H2O (1:4, v/v); 20 mL of the solution obtained was loaded (10 × 2 mL) onto a column conditioned with 2 × 5 mL of acetonitrile and 2 × 5 mL of distilled H2O, and kept in the dark. To eliminate hydrophilic interference, the column was subjected to a washing step with 2 × 5 mL of distilled H2O. The column was eluted with 4 × 0.5 mL of acetonitrile, and each aliquot was collected
separately. SPE2 procedure
Lab-made cartridges each containing 5 g of C18 sorbent phase (International Sorbent Technology) were used for the clean-up extraction step. In order to concentrate the analytes, three of each extract (E1
and E2) were combined up to reach a final volume of
150 mL. The extract was loaded (10 × 15 mL) onto a column conditioned with 15 × 5 mL of distilled H2O
and kept in the dark. The washing step was carried out with 1.5 mL of acetonitrile, followed by 5 × 15 mL of distilled H2O. Different combinations of sol -vents were tested to optimise the elution step. The column was eluted with acetonitrile-ethyl acetate gradients as follows: 2 × 4 mL of acetonitrile: ethyl acetate (100:0, v:v), 2 × 4 mL of acetonitrile: ethyl ace-tate (90:10, v:v), 2 × 4 mL of acetonitrile: ethyl aceace-tate (70:30, v:v), and 2 × 4 mL of acetonitrile: ethyl acetate
(50:50, v:v). Each aliquot was collected separately. The elution finally chosen was 6 mL of
acetonitrile-ethyl acetate (70:30, v:v) in one step.
Evaluation of grapevine leaf extraction and clean up Leaf extracts from the different extraction/clean
up procedures were compared using a
high-perfor-mance liquid chromatograph (Perkin Elmer Series 200 System) equipped with an auto-sampler and a
UV–Vis-diode-array detector (DAD), following the method of Pezet et al. (2003). This was to determine the levels of trans-resveratrol and trans-pterostilbene.
Each combination of extraction and purification was
performed in triplicate. In this HPLC method, a 250 mm C18 Lichrospher column was used (Merck
Millipore), diam. 4.6 mm, particle diam. 5 μm. The column was equipped with a Security Guard Car -tridge C18 security guard column (Phenomenex). The gradient elution was carried out using the fol-lowing mobile phases: mobile phase A, consisting of acetonitrile; mobile phase B, consisting of water. The binary elution gradient used was as follows: 1 min at 20:80 (A:B, v:v), linear gradient at 75:25 (A:B, v:v) for 30 min, and at 100:0 (A:B, v:v) for 2 min. The column was kept for 3 min at 100:0 (A:B, v:v), and then switched back to the initial 20:80 (A:B, v:v) for
4 min. The flow rate was set at 1 mL min-1 and the UV-Vis-diode array detector was set at 307 nm (Pezet et al., 2003).
Determination of stilbene compounds by ultra-high performance liquid chromatography/high resolution mass spectrometry (UHPLC/QTOF-MS)
Chromatographic analyses of the different frac -tions, including analysis of the unknown chromato-graphic peaks (resulting from compounds without commercially available standards) were performed
using an Agilent UHPLC 1290 Infinity (Agilent Technologies) equipped with Agilent 1290 Infin -ity autosampler (G4226A) coupled to Agilent 6540
accurate-mass Q-TOF mass spectrometer (nominal resolution 40,000) and Dual Agilent Jet Stream Ioni-sation source. Three tiger-striped vine leaf samples (ten leaves per sample) were processed with the
ex-traction technique selected (E2), and assayed with
the HPLC/QTOF-MS procedure.
Chromatographic separation was performed fol-lowing the method of Pezet et al. (2003) with a
modi-fied gradient elution: phase A) acetonitrile; phase B) water acidified with 0.2% (v:v) acetic acid; flow rate
0.6 mL min-1; sample injection 10 μL. Q-TOF condi -tions: negative ionisation mode; sheath gas: nitro-gen 10 L min-1 at 400°C; dehydration gas 8 L min-1 at 350°C; nebuliser pressure 60 psi, nozzle voltage 0 kV, capillary voltage 3.5 kV. Signals recorded were in the m/z 100-1700 range. Negative mass calibration was performed with standard mix G1969-85000 (Supelco Inc.) with residual error ± 0.2 ppm for the expected masses. Lock masses were TFA anion at m/z 112.9856 and HP-0921 (+ formate) at m/z 966.0007 in negative-ion mode.
Description of the vineyards examined, methods of sampling and calculation of dry weights
The study was carried out in two vineyards in the Province of Teramo, Region of Abruzzo, Italy. The vineyards had the same climatic conditions.
The vineyard of Controguerra was established 38 years previously and was trained to the Geneva Dou-ble Curtain (GDC) system. It comprised 740 vines on 5,984 m-2 with a vine spacing of 2 m within rows and 4 m between rows, and with an average yield of 13 kg per vine stock, and up to 16.5 kg in peak years. The vineyard of Giulianova was of the same age and was trained to the Tendone system. It had 1,296 vines in an area of 11,016 m-2, with a vine spacing of 3 m × 3 m and producing an average annual yield of 20 kg per vine stock. Both vineyards were grown with the cv. Trebbiano d’Abruzzo on 420A rootstock. The soil of the vineyards had a calcareous and high clay content structure. Trebbiano d’Abruzzo is a very vig-orous cultivar, and the training systems used formed large trunks that grew vertically for 2–2.2 m, with two permanent long cordons (GDC), or four large branches (Tendone).
The two vineyards have been under observation for GLSD foliar symptoms for more than 20 years. These multi-year inspections have made it pos-sible to distinguish between asymptomatic vines
that certainly had GLSD (because in one or more previous inspection years they exhibited the GLSD symptoms, but were asymptomatic in the season of the experiment) and vines that were healthy, be-cause in all the inspection years they never exhib-ited any GLSD symptoms. Hence the concentrations of the various phytoalexins were determined on: 1. leaves of diseased/symptomatic vines (i.e. vines exhibiting tiger-striped leaves in the sampling year) on which the stripes had reached their greatest
ex-tent, covering 65% of the laminae; 2. leaves of vines
known from previous inspections to be diseased, but asymptomatic in the sampling year; and 3. leaves of vines that in all previous inspections had never been symptomatic and were thus assumed to be healthy.
In both vineyards, and in each year of study, six vines were selected from each category (healthy, asymptomatic/diseased, or symptomatic). Twelve leaf laminae per vine were collected from the mid-dle portion of grape-bearing shoots, and opposite a grape bunch. Each sample collection therefore com-prised six sub-samples, each comprising 12 leaves, for each of the three categories of vines under study, and each sample consisted of leaves from a single
vine. Each vine was identified at the time of the first
sampling of each growing season, by its row number and its plant number within the row. In this way it was possible to follow each of these six vines in each category throughout the growing season, and to re-cord any variations in phytoalexin concentrations in each vine. During successive growing seasons the
leaves were sampled at different vine growth stages, described following the BBCH classification scheme
(Lorenz et al., 1995) as: ‘fruit set’ (71); ‘berries pea-sized’ (75); ‘berries beginning to touch’ (77); ‘berries developing colour’ (83); ‘softening of berries’ (85); and ‘berries ripe for harvest’ (89).
In 2006 and 2007 the vines in both vineyards were sampled at growth stages 77, 83, 85 and 89; in 2012 and 2013 vines were sampled only in the Controguer-ra vineyard, at growth stages 71, 75, 77, 83, 85, and 89. In all the study years, in both vineyards, vine leaves from all three categories of plants were sam-pled to determine their water contents, so that the concentrations of the various compounds extracted from the dry weight of the leaves could be calcu-lated. Twenty-four leaves were sampled, represent-ing six replicates of four leaves each, for each vine category. Sampling was carried out at growth stage 77, and repeated at growth stage 89. Each sample of
four leaves was weighed when fresh, after which the leaves were kept in an oven at 75°C for 24 h and then weighed again to determine their dry weights. The percentage of water in the various categories of leaves was calculated using the formula [(fresh weight – dry weight)/fresh weight] × 100. The
con-centrations of the different phytoalexins in the leaves
was then expressed on a leaf dry weight basis.
Statistical analyses
In each of the years under study, the data were analysed separately for each compound and at each vine growth stage, comparing the concentrations of each of the compounds in the leaves of each of the three categories of vines (six repetitions per vine group, corresponding to the concentrations of six
in-dividual vines) using Tukey’s honest significant dif -ference (HSD) test at P=0.05. Statistical analyses were carried out using SAS version 9.3 (SAS Institute Inc.).
Detection of leaf symptoms
In each of the test years, 2006, 2007, 2012, and 2013, the incidence and severity of GLSD leaf symp-toms were measured in both vineyards, in vines at four successive BBCH growth stages: 75; 77; 83; and 89. These four measurements were made in both vineyards on July 10, July 28, August 24, and 20 Sep-tember 2006, and on 9 July, 31 July, 24 August, and 19 September 2007. In the Controguerra vineyard these measurements were also made on 12 July, 31 July, 24 August and 21 September 2012, and on 11 July, 29 July, 26 August and 20 September, 2013.
The incidence of GLSD leaf symptoms in each vineyard was calculated by dividing the number of vines with leaf symptoms by the total number of dis-eased (asymptomatic/disdis-eased and symptomatic) vines, and multiplying by 100. Percentage severity of symptom expression was calculated using the for-mula SN × 100/(Y × Z), where SN = the sum of the symptom severity values; Y = the number of vines observed (asymptomatic/diseased and symptomat-ic); and Z = maximum symptom severity value (Mc-Kinney, 1923). Leaf symptom severity of a vine (as a
percentage of the vine crown affected) was recorded
on a disease rating scale of 0 to 5, where 0 = no leaf
symptom; 1 = 1–10% of the vine crown symptomatic for GLSD; 2 = 11–30%; 3 = 31–50%; 4 = 51–70%; and 5 = 71–100% symptomatic.
Results
Optimising extraction and clean-up of trans
-resveratrol and derivatives in symptomatic leaves of GLSD-affected vines
To identify the best procedure for the
prepara-tion, extraction and purification of GLSD- sympto
-matic leaves, different combinations of treatments
of leaf samples were tested (Table 1). The optimal procedure was determined using the HPLC/UV-Vis-DAD method according to Pezet et al. (2003).
Sample pre-treatment played an important role
in optimising extraction efficiency. A brief but effec -tive homogenisation of extract E2 enabled greater amounts of trans-resveratrol and trans-pterostilbene to be extracted. Extracts E1 and E2 were each
subject-ed to a clean up step, obtaining different treatment/
clean-up combinations: E1-SPE1, E1-SPE2, E2-SPE1, E2-SPE2, E1-LLE and E2-LLE. The clean up obtained with the SPE1 and SPE2 procedures gave high trans-resveratrol and trans-pterostilbene recovery (> 80%),
but these procedures did not quantitatively remove
the chlorophylls. On the other hand, the LLE
proce-dure quantitatively removed the chlorophylls, but led to a significantly lower recovery of both trans -resveratrol and trans-pterostilbene (≈ 50%). For this
reason, leaf samples were extracted with the E2 liq -uid-solid extraction without additional treatments to Table 1. Trans-resveratrol and trans-pterostilbene concen-trations (fresh weight values) in samples of tiger-striped
grapevine leaves obtained with different extraction/puri
-fication techniques. The values shown in the Table are the
averages of three replicates.
Treatment trans(mg kg-resveratrol-1) trans-pterostilbene(mg kg-1)
E1 12.6 ± 0.8 2.3 ± 0.1 E2 15.4 ± 0.7 4.4 ± 0.3 E1-SPE1 10.1 ± 1.0 1.7 ± 0.1 E1-SPE2 9.5 ± 0.8 1.6 ± 0.2 E2-SPE1 12.6 ± 1.1 2.1 ± 0.1 E2-SPE2 12.0 ± 0.9 1.5 ± 0.2 E1-LLE 6.5 ± 0.5 0.5 ± 0.1 E2-LLE 8.7 ± 0.7 0.8 ± 0.2
remove the chlorophylls; only a C18 guard column (Phenomenex) was used to safeguard the HPLC ap-paratus. In studies of this nature a high recovery of trans-resveratrol and trans-pterostilbene is essential since this provides more sensitive indication of any
differences in the amounts of phytoalexins detected.
Determination of stilbene compounds by ultra-high performance liquid chromatography/high resolution mass spectrometry (UHPLC/QTOF-MS)
To identify unknown phytoalexins, a HPLC/ QTOF-MS analysis was performed. The three grape-vine tiger-striped leaf samples were subjected to the selected extraction procedure, followed by the chro-matographic analysis selected (E2 coupled with the procedure of Pezet et al., 2003). In these samples
dif-ferent trans and cis stilbenes were identified, such
as trans-resveratrol, cis and ε-viniferin,
trans-δ-viniferin, and trans-pterostilbene. These are listed in Table 2 with their respective mass and retention times. Figure 2 shows a LC-MS chromatogram of a symptomatic grapevine leaf extract.
The compounds were identified using the stand -ards commercially available (trans-resveratrol and trans-pterostilbene), on the accurate masses meas-ured, and by performing multiple mass spectrometry (MS/MS) analyses as previously described (Flamini et al., 2013) (Table 2).
The retention time of each compound was used to identify the corresponding stilbene derivative in the grapevine leaf samples assayed by HPLC. Thus, con-sidering the analytical data, the whole set of data of
the field experiment was obtained using extraction
procedure E2 coupled to HPLC (Pezet et al., 2003).
Levels and patterns over time of phytoalexins extracted from GLSD-affected vine leaves.
The water levels determined in all the investigat-ed years, in the vine leaves studiinvestigat-ed were usinvestigat-ed to cal-culate the concentrations of phytoalexins on the basis of the leaf dry weight. These yielded uniform data in the replicates of all three categories of leaves, in both growth stages studied. Phytoalexin concentrations had to be calculated on the dry weight of the leaves
to adjust for differences due to different water con -centrations in symptomatic leaves on the one hand, and asymptomatic/diseased and healthy leaves on the other. The water concentration was on average of
65% in symptomatic (tiger-striped) leaves, and 72%
in both healthy and asymptomatic/diseased leaves, at both growth stages and in both vineyards. Analy-sis of the leaves of healthy and diseased vines in the years of study revealed higher levels of trans-resver-atrol and lower levels of trans-pterostilbene, trans-ε-viniferin, and trans-δ-trans-ε-viniferin, (in what follows, the
prefix trans- is omitted). In the growing seasons un-der study, resveratrol levels in the three categories of vines ranged between the minimum and maximum values shown in Table 3. The other compounds were not detected in asymptomatic/diseased and healthy
vine leaves in different growth stages, particularly at
stage 71 and at stage 75.
The seasonal peaks resveratrol levels in sympto-matic leaves were reached at stage 77 in both
vine-Table 2. Chromatographic retention times, and theoretical and experimental masses of pseudo-molecular ions of trans
-res-veratrol and stilbene derivatives identified in a symptomatic grapevine leaf extract prepared using the procedure selected
(E2; see text).
Peak minRT Compound Theoretical mass[M-H]-
m/z Experimental mass [M-H] -m/z Δ ppm 1 5.64 trans-resveratrol 227.0714 227.0712 -0.88 2 8.36 cis-ε-viniferin 453.1344 453.1349 1.10 3 9.00 trans-ε-viniferin 453.1344 453.1348 0.88 4 10.68 trans-δ-viniferin 453.1344 453.1346 0.44 5 16.51 trans-pterostilbene 255.1027 255.1029 0.78
yards, and in all the investigated years, with mean concentrations of 50.49 mg kg-1 d wt at Controguerra, and 46.96 mg kg-1 d wt at Giulianova in 2006, and 23.40 mg kg-1 d wt (Controguerra) and 21.62 mg kg-1 d wt (Giulianova) in 2007, and with concentrations of 22.70 mg kg-1 d wt in 2012, and 22.10 mg kg-1 d wt in
2013, in the Controguerra vineyard. At stage 77,
res-veratrol levels were slightly, though not significantly,
higher in asymptomatic/diseased vine leaves than in healthy vine leaves in 2006 and 2012, and were signif-icantly higher in the Controguerra vineyard in 2013 (Figure 3). In all categories of vine plants, resveratrol
Figure 2. UHPLC/QTOF - Extract ion chromatogram of a symptomatic grapevine leaf extract prepared using the procedure selected (E2).
Figure 2. UHPLC/QTOF - Extract ion chromatogram of a symptomatic grapevine leaf extract prepared using the procedure selected (E2; see text). 1, trans-resveratrol; 2, cis-ε-viniferin; 3, trans-ε-viniferin; 4, trans-δ-viniferin; 5, trans-pterostilbene. Table 3. Ranges of average concentrations of phytoalexins extracted from the leaves of different categories of grapevine plants growing in the Controguerra and Giulianova vineyards, during the growing seasons studied.
Category of leaves Level trans-resveratrol transmg kg-pterostilbene-1 d wt trans-ε-viniferin trans-δ-viniferin
Healthy min 1.38 0.00 0.00 0.00 max 13.38 2.41 2.67 1.92 Asymptomatic min 2.57 0.00 0.00 0.00 max 25.26 3.00 4.11 1.63 Symptomatic min 3.75 0.31 0.36 0.37 max 50.49 5.41 8.75 3.23
concentrations decreased at stage 83, and the differ -ences in resveratrol concentrations between
leaf-cate-gories also decreased, though the differences between
symptomatic and other (asymptomatic/diseased,
healthy) leaves still remained significant in some cas -es (Giulianova in 2006 and 2007, and Controguerra in 2013). At later growth stages, resveratrol levels in-creased again in all categories of leaves, and the dif-ferences in resveratrol levels between the categories
of leaves also increased. These differences reached statistical significance at growth stage 85 and/or at
stage 89. At these stages, the tiger-striped leaves in
particular differed significantly from the other leaves,
while the asymptomatic/diseased leaves had
inter-mediate resveratrol levels between symptomatic and
healthy leaves, but did not always differ significantly
from healthy leaves (Figure 3).
In tiger-striped leaves, whenever resveratrol levels peaked at stage 77, pterostilbene levels also peaked. Mean amounts of pterostilbene were 4.24 mg kg-1 d wt at Controguerra, and 4.17 mg kg-1 d wt at Giulianova in 2006, 1.82 mg kg-1 d wt at Controguerra and 2.06 mg kg-1 d wt at Giulianova in 2007, and 4.90 and 5.41 mg kg-1 d wt in 2012 and 2013 at Contro-guerra (Figure 4). At this growth stage, pterostilbene
levels were significantly higher in tiger-striped leaves
than in asymptomatic/diseased or healthy leaves. In tiger-striped leaves, pterostilbene levels then always
Figure 3. Levels of trans-resveratrol in the leaves of vines affected with GLSD and in leaves of healthy grapevines at various growth stages in the 2006, 2007, 2012 and 2013 growing seasons in the Controguerra and Giulianova vineyards. Statistical
anal-yses were performed according to Tukey’s honest significant difference (HSD) test. Each grapevine category (symptomatic,
asymptomatic and healthy) comprised six replications of leaf data (one replication = one grapevine plant) in each growth stage,
decreased considerably at growth stage 83, but after this they tended to increase again in the last growth
stages. This again increased the difference between
symptomatic and healthy leaves, and sometimes also between symptomatic and asymptomatic/diseased leaves. Pterostilbene levels in healthy and asympto-matic/diseased leaves were similar in all vine growth stages and in both vineyards in 2006, and also in the
first four growth stages of 2012 and 2013, when this compound was quite lacking in these two categories
of leaves. In 2007, in all growth stages and in both
vineyards, pterostilbene levels were often signifi -cantly higher in asymptomatic/diseased leaves than in healthy leaves, and were similar to pterostilbene
levels in tiger-striped leaves. This was also the case at growth stage 85 at the Controguerra vineyard in 2012 and 2013 (Figure 4).
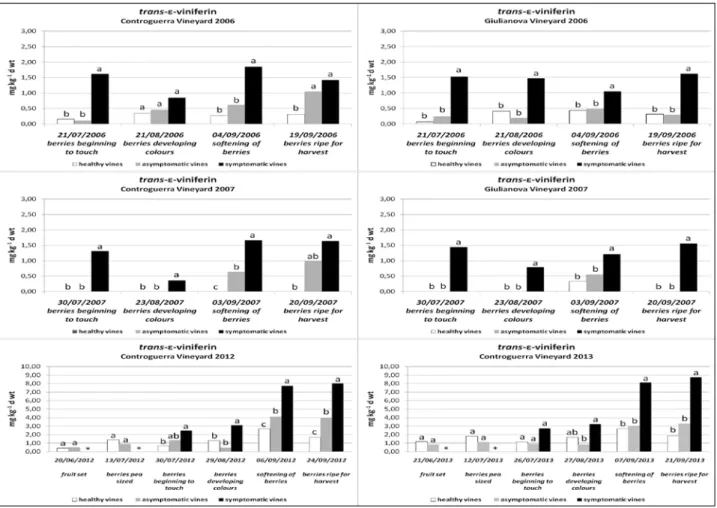
As regards ε-viniferin levels, in the Controguer -ra vineyard in 2006, and in both vineyards in 2007, tiger-striped leaves exhibited reductions at growth
stage 83, but then ε-viniferin levels increased again
at stages 85 and 89, to higher levels very similar to those seen earlier at stage 77. In the Giulianova
vine-yard in 2006, on the other hand, ε-viniferin levels of tiger-striped leaves did not differ much between any
of the growth stages examined. In any case, in 2006
and 2007 mean ε-viniferin amounts did not exceed
1.85 mg kg-1 d wt, which was much less than the
Figure 4. Levels oftrans-pterostilbene in the leaves of vines affected with GLSD and in leaves of healthy vines at various growth stages in the 2006, 2007, 2012 and 2013 growing seasons in the Controguerra and Giulianova vineyards. Statistical analysis was performed according to Tukey’s honest significant difference (HSD) test. Each grapevine category (symptomatic, asymptomatic and healthy) comprised 6 replications of leaf data (1 replication = 1 vine) in each growth stage, in each year and in each vineyard. Different letters represent significant differences atP= 0.05. *= no symptomatic vines found;
Figure 4. Levels of trans-pterostilbene in the leaves of vines affected with GLSD and in leaves of healthy grapevines at various growth stages in the 2006, 2007, 2012 and 2013 growing seasons in the Controguerra and Giulianova vineyards. Statistical
anal-yses were performed according to Tukey’s honest significant difference (HSD) test. Each grapevine category (symptomatic,
asymptomatic and healthy) comprised six replications of leaf data (one replication = one grapevine plant) in each growth stage,
ε-viniferin levels found in 2012 and 2013 at Contro -guerra. In this vineyard during those years, levels in tiger-striped leaves were much higher at stages 85 and 89 than at stage 77. At stage 85 and 89, mean
amounts of ε-viniferin were similar, ranging be -tween 7.72 and 8.75 mg kg-1 d wt, with significant differences between the three categories of leaves. In the asymptomatic/diseased leaves ε-viniferin lev -els were low in both vineyards in 2006, and nil in 2007, until growth stage 83. They then increased in the last two growth stages, often to a level interme-diate between the levels found in tiger-striped and healthy leaves. At the last two growth stages (85 and
89), ε-viniferin levels of asymptomatic leaves were
sometimes higher at stage 85, as they were in 2006 and 2007 at Giulianova, and sometimes also higher at stage 89, as in 2006 and 2007 at Controguerra. Otherwise, they always remained very similar, as in 2012 and 2013 at Controguerra. In healthy leaves,
ε-viniferin levels were low or nil in both vineyards
in 2006 and 2007, but in 2012 and 2013 in the Contro-guerra vineyard they tended to increase in the last two growth stages, as they did in the other categories
of leaves. In 2007, ε-viniferin was hardly ever found
in healthy leaves in either vineyard (Figure 5).
In 2006 and 2007, patterns of δ-viniferin amounts
in tiger-striped leaves at the growth stages studied were very similar to the resveratrol patterns, in both
Figure 5. Levels oftrans-ε-viniferin in the leaves of vines affected with GLSD and in leaves of healthy vines at various growth stages in the 2006, 2007, 2012 and 2013 growing seasons in the Controguerra and Giulianova vineyards. Statistical analysis was performed according to Tukey’s honest significant difference (HSD) test. Each grapevine category (symptomatic, asymptomatic and healthy) comprised 6 replications of leaf data (1 replication = 1 vine) in each growth stage, in each year and in each vineyard. Different letters represent significant differences atP= 0.05. *= no symptomatic vines found; Figure 5. Levels of trans-ε-viniferin in the leaves of vines affected with GLSD and in leaves of healthy vines at various growth stages in the 2006, 2007, 2012 and 2013 growing seasons in the Controguerra and Giulianova vineyards. Statistical analyses
were performed according to Tukey’s honest significant difference (HSD) test. Each grapevine category (symptomatic, asymp
-tomatic and healthy) comprised six replications of leaf data (one replication = one grapevine plant) in each growth stage, in
vineyards. The δ-viniferin levels went up at stage
77, and went down again at stage 83. There was a tendency towards higher levels at growth stages
83 or 89. Mean amounts of δ-viniferin were similar to, or only slightly below, ε-viniferin levels in the
same leaves, and ranged from 0.37 to 1.87 mg kg-1 d wt (Figure 6). In 2012 and 2013, in the tiger-striped leaves from the Controguerra vineyard, the highest
δ-viniferin levels were found at stage 85; they then
decreased at stage 89 though still remaining higher than they had been at stages 77 and 83. In 2006 and
2007 δ-viniferin levels in asymptomatic/diseased
and healthy leaves were low, and often similar, and this compound was mostly completely lacking in
2007. In 2012 and 2013, no δ-viniferin was recorded in asymptomatic and in healthy leaves, in the first two growth stages in 2012 and in the first four growth stages in 2013. In all subsequent stages, however, the levels of δ-viniferin increased, particularly at stages
85 and 89. Mean amounts were never greater than 1.87 mg kg-1 d wt, recorded in healthy leaves, and with no significant differences between healthy and
asymptomatic leaves (Figure 6).
In 2012 and 2013, in the two growth stages 71 and 75, before stage 77, no leaf symptoms were found, so all vines were asymptomatic diseased or healthy. In the leaves of these last two categories of vines, levels of the various compounds under study were
Figure 6. Levels oftrans-δ-viniferin in the leaves of vines affected with GLSD and in leaves of healthy vines at various growth stages in the 2006, 2007, 2012 and 2013 growing seasons in the Controguerra and Giulianova vineyards. Statistical analysis was performed according to Tukey’s honest significant difference (HSD) test. Each grapevine category (symptomatic, asymptomatic and healthy) comprised 6 replications of leaf data (1 replication = 1 vine) in each growth stage, in each year and in each vineyard. Different letters represent significant differences atP= 0.05.*= no symptomatic vines found; Figure 6. Levels of trans-δ-viniferin in the leaves of vines affected with GLSD and in leaves of healthy vines at various growth stages in the 2006, 2007, 2012 and 2013 growing seasons in the Controguerra and Giulianova vineyards. Statistical analyses
were performed according to Tukey’s honest significant difference (HSD) test. Each grapevine category (symptomatic, asymp
-tomatic and healthy) comprised six replications of leaf data (one replication = one grapevine plant) in each growth stage, in
uniformly low and not dissimilar, or they were nil. Maximum mean resveratrol amounts were 5.29 mg kg-1 d wt, ε-viniferin amounts were 1.79 mg kg-1 d wt, and there was a complete lack of pterostilbene
and δ-viniferin (Figures 3, 4, 5 and 6).
Detection of leaf symptoms
The leaf symptoms, recorded in the two vine-yards in the same growing seasons in which the phytoalexins were measured, exhibited similar pat-terns in each growing season and in each vineyard. Leaf symptoms were absent at growth stage 75, and both the incidence and severity of symptoms were still limited at stage 77 (Figure 6). From stage 77 until stage 83, symptoms increased only moderately, but from stages 83 to 89 symptom expression increased markedly, to reach a peak at the time of harvesting (Figure 7).
Discussion
In this study, leaves generally showed higher lev-els of resveratrol than other stilbenes, independently of the presence or absence of the symptoms of GLSD. In particular, symptomatic leaves showed greater increases of resveratrol compared with increases of pterostilbene and viniferins. In the absence of biotic pathogenic agents in the leaves, as for GLSD, this
finding is consistent with that of Pezet et al. (2004). This supports the view that the esca leaf symptoms on grapevines are primarily formed in response to
toxic metabolites produced in the wood by patho-gens that do not occur in the leaves (Mugnai et al., 1999; Evidente et al., 2000; Tabacchi et al., 2000; Su-rico, 2009). On the other hand, pterostilbene and the viniferins are mainly produced in the plant tissues that harbour the pathogens, because these com-pounds possess greater antimicrobial activity (Lang-cake and McCarthy, 1979; Jeandet et al., 2002; Pezet et al., 2004).
The levels of resveratrol and other phytoalexins
at various growth stages in different growing sea -sons revealed that amounts of these compounds varied during vegetative growth and ripening both
in leaves of GLSD-affected vines and healthy vines. All the phytoalexins occurred at significantly high -er levels in symptomatic than in asymptomatic/
diseased and healthy leaves. This confirms earlier
preliminary studies on resveratrol, carried out by our team (Calzarano et al., 2013). In those studies, the greatest amounts of resveratrol in symptomatic vines occurred at growth stage 77 (berries beginning to touch) or at stage 89, (berries ripe for harvest), and
these levels differed significantly between the three
categories of leaves. In most cases, however, lev-els then became much attenuated by stage 83 (ber-ries developing colour), when resveratrol amounts tended to decrease overall. In the present study, in asymptomatic/diseased leaves, in some cases, some phytoalexins occurred at stage 77 (berries beginning to touch) at concentrations intermediate between the concentrations in the other two categories of leaves. In all the other cases, however, asymptomatic/dis-Figure 7. Incidence and severity of GLSD leaf symptoms in four growth stages in the 2006, 2007 (a, b), 2012 and 2013 (c) growing seasons in the Controguerra and Giulianova vineyards.
Figure 7. Incidence and severity of GLSD leaf symptoms in four growth stages in the 2006, 2007 (a, b), 2012 and 2013 (c) growing seasons, in the Controguerra and Giulianova vineyards
eased leaves exhibited similar amounts of these com-pounds as healthy leaves, in which the phytoalexins occurred only sporadically and at low levels in the
initial growth stages, to increase in the final growth
stages, during ripening.
All categories of leaves exhibited uniformly lower levels of all phytoalexins at stage 83 (berries developing colour) and generally higher levels dur-ing ripendur-ing, at stages 85 (softendur-ing of berries) and
89 (berries ripe for harvest). Despite the differences mentioned between the different categories of leaves at different growth stages, which were separated by
at least 2 week intervals, the phytoalexins detected increased or decreased in uniform patterns. These variations in compound concentrations were con-sistent with previous results, where the phytoalexins are formed out of resveratrol, and that the process of formation takes place within a few days (Keller et al., 2000; Commun et al., 2003; Slaughter et al., 2008).
The patterns of the phytoalexins over time in symptomatic leaves were similar in all the growing seasons studied, irrespective of considerable varia-tions in the phytoalexin levels and in the incidence and severity of the leaf symptoms from one year to the next. In years when symptoms were more severe (2006, 2012, and 2013), phytoalexin concentrations also increased, especially resveratrol in 2006, and
ε-viniferin in 2012 and 2013. The same factors that determined symptom severity therefore also affected
the amount of phytoalexins produced, but not their variations over the growing season. Variations were more closely linked to the plant growth stage. In both vineyards, variations in the extent of leaf symp-toms, and in the amount of phytoalexins produced, were very similar among years. This emphasises the importance of environmental variables (Marchi et al., 2006) for such variations, since the vineyards were lo-cated in an area that had the same weather/climate. The links between the amounts of phytoalexins pro-duced and the severity of foliar symptoms are also shown by fact that variations in phytoalexin levels
reflected variations in the extent of foliar symptoms
within each growing season.
Variations in carbohydrate reserves in vinewood
during the growing season may affect the amount of
toxins released by the pathogenic fungi and hence the expression of GLSD symptoms. In the measure-ments taken over time in this study, GLSD symptoms
were first recorded at the growth stage 77 (berries
beginning to touch), when carbohydrate reserves
were also at their lowest. This may have stimulated release of toxins by the pathogenic fungi in the vine-wood (Sumarah et al., 2005; Eaton et al., 2015). From the stage 77 (berries beginning to touch) onwards the leaves produced carbohydrates, which were translo-cated to the wood to reconstitute the carbohydrate reserves, and this process ended shortly before stage 83 (berries developing colour) (Lebon et al., 2008). It is likely, therefore, that in the interval between these two growth stages the fungi were less stimulated to produce toxins. Between stages 77 and 83, the inci-dence and severity of the leaf symptoms recorded did not greatly increase. However, after the carbo-hydrate reserves had been reconstituted, from stage 83 until stage 89 (berries ripe for harvest), other fac-tors again increased the extent of GLSD symptoms, such as the prolonged susceptibility of pruning wounds (Serra et al., 2008; Rolshausen et al., 2010). These increased the probability of new infections in the course of the growing season, probably leading to greater amounts of toxins being produced by the fungi colonising the vinewood near the shoots and leaves (Mugnai et al., data unpublished). At growth stage 89 (berries ripe for harvest), increases of leaf symptoms were concomitant with increases of phy-toalexins in symptomatic vines, compared to the previous stage 83 (berries developing colour). This increase of phytoalexins was observed in the leaves of all the types of vines, but in symptomatic vines the increases were more consistent compared to those observed in the leaves of the other two types of
vines. At stage 89, symptomatic vines, significantly differentiated again from the other type of vines, as
observed at stage 77 (berries beginning to touch).
The same factors that affect variations in the leaf symptoms may also affect the phytoalexin levels re -corded during the various growth stages, but the ex-tent to which these factors cause the leaf symptoms and produce higher levels of phytoalexins remains
to be clarified.
In the present study, low levels of trans-resvera-trol and other phytoalexins were found in
asympto-matic/diseased vines in the first two growth stages
monitored in 2012 and 2013: stage 71 (fruit set) and stage 75 (berries pea-sized). In both these stages, no GLSD symptoms were detected, and the levels of phytoalexins in asymptomatic/diseased leaves were
low and did not differ from those in healthy leaves.
In the next stage monitored, 77 (berries beginning to touch), GLSD symptoms began to appear and at the
same time that levels of some of these compounds (trans-resveratrol in 2012 and 2013, and δ-viniferin in 2012), began to increase, in asymptomatic/dis-eased leaves more greatly than in healthy leaves.
These findings were consistent with previous studies
which reported that resveratrol and other phenolic compounds increased in asymptomatic/diseased leaves once symptoms began to appear (Magnin-Robert et al., 2011; Valtaud et al., 2011; Lambert et al., 2013). In other studies no alterations in photosyn-thesis in completely asymptomatic vine-shoots were detected, but they were found by Christen (2006) in asymptomatic leaves of vine-shoots bearing
symp-toms. These findings, together with those reported
in the present study, on asymptomatic/diseased vines at growth stages 71 (fruit set) and 75 (berries pea-sized), justify the conclusion that phytoalexins are not involved in inhibiting the leaf symptoms that occur until stage 77 (berries beginning to touch). Rather, from the 77 growth stage, the higher levels of resveratrol and the other phytoalexins in tiger-striped than in asymptomatic/diseased leaves, in-dicate that these compounds only form in response to already existing lesions. These compounds prob-ably do not prevent lesions that are in the process of being formed by toxic metabolites produced by wood-colonising fungi, and which are translocated to the leaves, similar to any biotic or abiotic stress factor that injures leaves (Smith, 1996; Bavaresco and Fregoni, 2001). The expression of the PAL and STS genes, which is induced in esca-diseased vine leaves even before symptoms appear, was suppressed in the green portions of the leaves, after the chlorotic/ necrotic lesions appeared. Expression began only in the chlorotic areas, indicating that the host defence responses were low immediately before or during the onset of the symptoms (Magnin-Robert et al., 2011). This shows that the phytoalexins found in the present study were synthesised after the onset of the leaf lesions, and not before. These lesions therefore
resemble a hypersensitivity reaction, confirming
what is reported in the literature about the synthesis of antimicrobial compounds after such lesions have formed (Heath, 2000).
Measurement of the phytoalexins in the present study made it possible to ascertain the pattern of their concentration over time, in diseased vines. This pattern was uniform from one growing season to the next, independently of the extent of symptoms that occurred, or variations in the amount of the
phyto-alexins extracted, which varied from one season to the next. The fact that phytoalexin levels were great-er at growth stages 77 (bgreat-erries beginning to touch) and 89 (berries ripe for harvest) in symptomatic leaves than they were in healthy leaves, indicates that host plant defence responses depend more on the particular physiological condition of the plant at those stages than on the translocation of toxins from pathogen-colonised wood. Plant growth variations, in particular the synthesis of carbohydrates, changes in the rate of carbohydrate translocation at the dif-ferent growth stages, and the onset of new infections
during the growing season, may affect the produc -tion of toxins released by the pathogens, the onset of symptoms, and the synthesis of stilbenes as a plant defence response. The stilbenes are produced as a defence response at higher concentrations in symp-tomatic leaves, and after the onset of symptoms, but
their production is not sufficient to limit the severity
of the symptoms. This would be consistent with the conclusions of Magnin-Robert et al. (2011) and Spag-nolo et al. (2012), who reported that the anti-oxidant system of diseased vines was unable to cope with the oxidative stress produced by the onset of the leaf symptoms.
Literature cited
Amalfitano C., A. Evidente, G. Surico, S. Tegli, E. Bertelli and L. Mugnai, 2000. Phenols and stilbene polyphenols in the wood of esca-diseased grapevine. Phytopathologia Mediter-ranea 39, 178–183.
Andolfi A., L. Mugnai, J. Luque, G. Surico, A. Cimmino and A. Evidente, 2011. Phytotoxins produced by fungi associated with grapevine trunk diseases. Toxins 3, 12, 1569–1605. Bavaresco L. and C. Fregoni, 2001: Physiological role and
mo-lecular aspects of grapevine stilbenic compounds. In: Mo-lecular Biology and Biotecnology of the grapevine (K.A. Roub-elakis-Angelakis Ed.), Kluwer Acad. Publ., Dordrecht, The Netherlands, 153–182.
Bertsch C., M. Ramírez-Suero, M. Magnin-Robert, P. Larignon, J. Chong, E. Abou-Mansour, A. Spagnolo, C. Clèment and F. Fontaine, 2013. Grapevine trunk diseases: complex and still poorly understood. Plant Pathology 62, 2, 243–265. Borie B., P. Jeandet, A. Parize, R. Bessis and M. Adrian, 2004.
Resveratrol and Stilbene Synthase mRNA Production in Grapevine Leaves Treated with Biotic and Abiotic Phyto-alexin Elicitors. American Journal of Enology and Viticulture
55, 1, 60–64.
Calzarano F., A. Cichelli and M. Odoardi, 2001. Preliminary evaluation of variations in composition induced by esca on cv. Trebbiano D’Abruzzo grapes and wines. Phytopatho-logia Mediterranea 40, Supplement, S443–S448.
Effect of esca on the quality of berries, musts and wines.
Phytopathologia Mediterranea 43, 125–135.
Calzarano F. and Di Marco S., 2007. Wood discoloration and decay in grapevines with esca proper and their relation-ship with foliar symptoms. Phytopathologia Mediterranea, 46, 96–101.
Calzarano F., V. D’Agostino and M. Del Carlo, 2008. Trans-res-veratrol extraction from grapevine: application to berries and leaves from vines affected by esca proper. Analytical
Letters 41, 1–13.
Calzarano F., C. Amalfitano, L. Seghetti, and V. Cozzolino, 2009. Nutritional status of vines affected with esca proper.
Phytopathologia Mediterranea 48, 20–31.
Calzarano F., V. D’Agostino, F. Osti and S. Di Marco, 2013. Levels of trans-resveratrol in leaves of vines affected with
“esca”. In: Protection and Production in Viticulture, IOBC/ WPRS Bulletin Vol. 85, 129–136.
Calzarano F., S. Di Marco, V. D’Agostino, S. Schiff and L. Mug -nai, 2014. Grapevine leaf stripe disease (esca complex) are reduced by a nutrients and seaweed mixture. Phytopatho-logia Mediterranea 53, 3, 543–558.
Christen D., 2006. Towards an Integrative Management of Eu-typa Dieback and Esca Disease of Grapevine. Thesis of the Swiss Federal Institute of Technology, Zurich, Switzer-land.
Cichewicz R.H. and S.A. Kouzi, 2002. Resveratrol oligomers: structure, chemistry, and biological activity. In: Studies in Natural Products Chemistry, Atta-ur-Rahman (Ed), Elsevier Science B.V., 26, 507–579.
Commun K., M.C. Mauro, Y. Chupeau, M. Boulay, M. Burrus, and P. Jeandet, 2003. Phytoalexin production in grapevine protoplasts during isolation and culture. Plant Physiologi-cal Biochemistry 41, 317–323.
Di Marco S., F. Osti, A. Mazzullo and A. Cesari, 2001. How iron could be involved in esca fungi development. Phyto-pathologia. Mediterranea 40, S449–S452.
Dufour M.C., C. Lambert, J. Bouscaut, J.M. Mérillon and M.F. Corio-Costet, 2013. Benzothiadiazole-primed defence re-sponses and enhanced differential expression of defence genes in Vitis vinifera infected with biotrophic pathogens
Erysiphe necator and Plasmopara viticola. Plant Pathology 62, 370–382.
Eaton C. J., P. Y. Dupont, P. Solomon, W. Clyton, B. Scott, and M. P. Cox, 2015. A core gene set describes the molecular basis of mutualism and antagonism in Epichloë spp. Mo-lecular Plant-Microbe Interactions. 28(3), 218–231.
Evidente A., L. Sparapano, A. Andolfi and G. Bruno, 2000. Two naphthalenone pentaketides from liquid cultures of
Phaeoacremonium aleophilum, a fungus associated with esca of grapevine. Phytopathologia Mediterranea 39, 162–168. Feliciano A.J., A. Eskalen, and W.D. Gubler, 2004. Differential
susceptibility of three grapevine cultivars to Phaeomon-iella chlamydospora in California. Phytopathologia Mediter-ranea 43, 66–69.
Flamini R., M. De Rosso, F. De Marchi, A. Dalla Vedova, A. Panighel, M. Gardiman, I. Maoz and L. Bavaresco, 2013. An innovative approach to grape metabolomics: stilbene profiling by suspect screening analysis. Metabolomics, 9, 1243–1253.
Fontaine F., C. Pinto, J. Vallet, C. Clément, A. C. Gomes, and A. Spagnolo, 2016. The effects of grapevine trunk diseases (GTDs) on vine physiology. European Journal of Plant Pa-thology, 144(4), 707–721.
Gramaje D., L. Mostert, J. Z. Groenewald, and P. W. Crous, 2015. Phaeoacremonium: from esca disease to phaeohypho-mycosis. Fungal biology, 119(9), 759–783.
Heath M.C., 2000. Hypersensitive response-related death.
Plant Molecular Biology 44, 321–334.
Jeandet P., A. C. Douillet-Breuil, R. Bressis, S. Debord, M. Spa-ghi, and M. Adrian, 2002. Phytoalexins from the Vitaceae: Biosynthesis, phytoalexin gene expression in transgenic plants, antifungal activity, and metabolism. Journal of Ag-ricultural and Food Chemistry 50, 2731–2741.
Keller M., C.C. Steel and G.L. Creasy, 2000. Stilbene accumu-lation in grapevine tissues: developmental and environ-mental effects. Acta Horticolturae 514, 275–286.
Lambert C., I.L.K. Khiook, S. Lucas, N. Télef-Micoleau, J.M. Mérillon and S. Cluzet, 2013. A faster and stronger defense response: one of the key elements in grapevine explain-ing its lower susceptibility to esca? Phytopathology, 103(10), 1028−1034.
Langcake P. and W.V. McCarty, 1979. The relationship of res-veratrol production to infection of grapevine leaves by
Botrytis cinerea. Vitis 18, 244–253.
Lebon G., G. Wojnarowiez, B. Holzapfel, F. Fontaine, N. Vail-lant-Gaveau, and C. Clément, 2008. Sugars and flowering in the grapevine (Vitis vinifera L.). Journal of Experimental Botany 59(10), 2565–2578.
Lorenz D.H., K.W. Eichhorn, H. Bleiholder, R. Close, U. Meier and E. Weber, 1995. Phenological growth stages of the grapevine (Vitis vinifera L. ssp. vinifera). Encoding and de-scription of the phenological stages of the grapevine ac-cording to the extended BBCH scheme. Australian Journal of Grape and Wine Research 1(2), 100–103.
Magnin-Robert M., P. Letousey, A. Spagnolo, F. Rabenoelina, L. Jacquens, L. Mercier, C. Clément and F. Fontaine, 2011. Leaf stripe form of esca induces alteration of photosynthe-sis and defence reactions in presymptomatic leaves. Func-tional Plant Biology 38, 856–866.
Marchi G., I.G. Pascoe and J. Edwards, 2001. Young esca in Australia. Phytopathologia Mediterranea 40 (3), 303-310. Marchi G., F. Peduto, L. Mugnai, S. Di Marco, F. Calzarano and
G. Surico, 2006. Some observations on the relationship on manifest and hidden esca to rainfall. Phytopathologia Medi-terranea 45, 117–126.
Mazzullo A., S. Di Marco, F. Osti and A. Cesari, 2000. Bioas-says on the activity of resveratrol, pterostilbene and phos-phorous acid towards fungi associated with esca of grape-vine. Phytopathologia Mediterranea 23(3), 357–365.
McKinney H.H., 1923. Influence of soil temperature and mois -ture on infection of wheat seedlings by Helminthosporium sativum.Journal of Agricultural Research 26, 195‒218.
Mugnai L., A. Graniti and G. Surico, 1999. Esca (black mea-sles) and brown wood streaking: two old and elusive dis-eases of grapevines. Plant Disease 83, 5, 404-418.
Osti F. and S. Di Marco, 2010. Iron-dependent, non-enzymatic processes promoted by Phaeomoniella chlamydospora and
Physiological and Molecular Plant Pathology 74, 309–316. Pezet R., C. Perret, J.B. Jean-Denis, R. Tabacchi, K. Gindro and
Viret O., 2003. δ-Viniferin, a resveratrol dehydrodimer: one of the major stilbenes synthesized by stressed grape-vine leaves. Journal of Agricultural and Food Chemistry 51, 18, 5488–5492.
Pezet R., K. Gindro, O. Viret and H. Richter, 2004. Effects of resveratrol, viniferins and pterostilbene on Plasmopara viti-cola zoospore mobility and disease development. Vitis 43, 145–148.
Rolshausen P.E., J.R. Úrbez-Torres, S. Rooney-Latham, A. Eskalen, R.J. Smith, and W.D. Gubler, 2010. Evaluation of pruning wound susceptibility and protection against fungi associated with grapevine trunk diseases. American Journal of Enology and Viticulture, 61, 113–119.
Saigne-Soulard C., A. Abdelli-Belhadj, M. Télef-Micouleau, J. Bouscaut, S. Cluzet, M.F. Corio-Costet, and J. M. Mérillon, 2015. Oligosaccharides from Botrytis cinerea and elicitation of grapevine defense. Polysaccharides: Bioactivity and Bio-technology 939–958.
Serra S., M.A. Mannoni and V. Ligios, 2008. Studies on the susceptibility of pruning wounds to infection by fungi in-volved in grapevine wood diseases in Italy. Phytopatholo-gia Mediterranea 47, 234–246.
Slaughter A.R., M. Md. Hamiduzzaman, K. Gindro, J.M. Neu-haus and B. Mauch-Mani, 2008. Beta-aminobutyric acid-induced resistance in grapevine against downy mildew: involvement of pterostilbene. European Journal of Plant Pa-thology 122, 185–195.
Smith C.J. 1996; Tansley review No. 86. Accumulation of phy-toalexins: defence mechanism and stimulus response sys-tem. New Phytologist 132, 1–45.
Spagnolo A., M. Magnin-Robert, T.D. Alayi, C. Cilindre, L. Mercier, C. Schaeffer-Reiss and F. Fontaine, 2012. Physi
-ological changes in green stems of Vitis vinifera L. cv. Char-donnay in response to esca proper and apoplexy revealed by proteomic and transcriptomic analyses. Journal of Pro-teome Research, 11(1), 461–475, doi:10.1021/pr200892g. Sparapano L., G. Bruno and A. Graniti, 2001. Three-year
ob-servation of grapevines cross-inoculated with esca-associ-ated fungi. Phytopathologia Mediterranea 40, 376–386. Sumarah M.W., J.D. Miller and B.A. Blackwell, 2005. Isolation
and metabolite production by Penicillium roqueforti, P. pa-neum and P. crustosum isolated in Canada. Mycopathologia, 159(4), 571–577.
Surico G., 2009. Towards a redefinition of the diseases within the esca complex. Phytopathologia Mediterranea 48, 5–10. Surico G., G. Marchi, L. Mugnai and F. Peduto, 2010.
Es-pressione dei sintomi fogliari dell’esca in funzione della disponibilità di acqua nel suolo e germogliamento delle gemme. In: Il Mal dell’Esca della Vite: Interventi di Ricerca e Sperimentazione per il Contenimento della Malattia.Progetto MesVit. (Surico G., Mugnai L., ed.), Arsia Regione Toscana, Firenze, Italy, 276–291.
Tabacchi R., A. Fkyerat, C. Poliart and G. Dubin, 2000. Phy-totoxins from fungi of esca of grapevine. Phytopathologia Mediterranea 39, 156–161.
Valtaud C., F. Thibault, P. Larignon, C. Berstch, P. Fleurat-Les-sard and A. Bourbouloux, 2011. Systemic damage in leaf metabolism caused by esca infection in grapevines. Aus-tralian Journal of Grape and Wine Research 17(1), 101–110, doi:10.1111/j.1755-0238.2010.00122.x.
Wang W., K. Tang, H.R. Yang, P.F. Wen, P. Zhang, H.L. Wang, 2010. Distribution of resveratrol and stilbene synthase in young grape plants (Vitis vinifera L. cv. Cabernet Sauvi-gnon) and the effect of UV-C on its accumulation. Plant
Physiology and Biochemistry 48, 142–152.
Accepted for publication: October 19, 2016 Published online: January 9, 2017