Workforce Strategic Plan: 2013-2017
Workforce Investment San Francisco
Table of Contents
1. Vision ...1
1.1 The San Francisco Context ... 1
1.2. Laying the Foundation: The 2009 WISF Workforce Strategic Plan ... 2
1.2.1. Vision ... 2
1.2.2. Mission ... 2
1.3. Sustained Success: The 2013-2017 WISF Workforce Strategic Plan ... 3
1.3.1. A Robust Sector Strategy ... 3
1.3.2. Access Points ... 4
1.3.3. Engaged Workforce Institutions ... 5
1.3.4. Regional Collaboration ... 5
2. Economic and Workforce Analysis ...6
2.1. How the Economic and Workforce Analysis is Organized ... 6
2.2. San Francisco Economy Overview ... 7
2.3. Regional Economy Overview ... 8
2.4. Local Growth ... 8
2.5. Regional Growth ... 10
2.6. Characteristics of the Local Population ... 12
2.6.1. Educational Disparity ... 12
2.6.2. Immigrant Workforce ... 12
2.6.3. Wealth Disparity ... 13
2.6.4. Digital Divide ... 14
2.7. Employment Needs of the Local Area Population ... 14
2.8. Construction Industry Overview ... 15
2.8.1. Construction Industry Composition and Growth ... 15
2.8.2. Construction Occupations Overview ... 17
2.8.3. Wages: Economic Security and Self-Sufficiency ... 19
2.8.4. Required Workforce Skills: Employer Needs and Challenges ... 19
2.8.5. Education and Training Landscape ... 20
2.8.6. Strategies for Meeting Employer Needs and Closing Skills Gaps ... 20
2.9. Health Care Industry Overview ... 20
2.9.1. Health Care Industry Composition and Growth ... 20
2.9.2. Health Care Occupations Overview ... 22
2.9.3. Wages: Economic Security and Self-Sufficiency ... 25
2.9.4. Required Workforce Skills: Employer Needs and Challenges ... 25
2.9.5. Education and Training Landscape ... 25
2.9.6. Strategies for Meeting Employer Needs and Closing Skills Gaps ... 26
2.10. Hospitality Industry Overview ... 26
2.10.1. Hospitality Industry Composition and Growth ... 26
2.10.2. Hospitality Occupations Overview ... 28
2.10.3. Wages: Economic Security and Self-Sufficiency ... 30
2.10.4. Required Workforce Skills: Employer Needs and Challenges ... 30
2.10.5. Education and Training Landscape ... 31
2.11. Information and Communications Technology (ICT) Industry Overview ... 31
2.11.1. ICT Industry Composition and Growth ... 31
2.11.2. Information and Communications Technologies (ICT) Occupations Overview ... 33
2.11.3. Wages: Economic Security and Self-Sufficiency ... 35
2.11.4. Required Workforce Skills: Employer Needs and Challenges ... 35
2.11.5. Education and Training Landscape ... 36
2.11.6. Strategies for Meeting Employer Needs and Closing Skills Gaps ... 37
3. Business Service Plan... 37
3.1. WISF Services to Local Businesses ... 38
3.2. Business Services Strategies and Action Steps ... 39
3.2.1. Sector Strategies: Barriers, Skill Gaps, and Priority Sectors ... 40
3.2.2. Innovative Training and Partnership Strategies ... 40
3.2.3. The Workforce Innovation Partnership ... 41
3.2.4. Apprenticeship Strategy ... 42
3.2.5. Rapid Response Strategies ... 42
3.2.6. Performance Metrics ... 43
4. Adult Strategies... 43
4.1. Comprehensive Access Point Strategy ... 44
4.2. Adult Basic Education and Transition to Postsecondary Education ... 44
4.2.1. The Comprehensive Access Point - Assessment and Education Services Coordinator ... 44
4.2.2. Sector Bridge Programs ... 45
4.2.3. Sector Access Points – Career Pathway Programs in Demand Industries ... 46
4.2.4. Sector Access Points Strategies ... 48
4.2.5. Neighborhood Access Points ... 51
4.2.6. Workforce Service Delivery Modules ... 52
4.3. Layoff Aversion Strategy ... 52
4.4. “Earn & Learn” Models ... 53
4.4.1. Apprenticeships and Paid Work Experience ... 54
4.4.2. On the Job Training ... 54
4.4.3. Other Training Services, including Individual Training Accounts and Customized Training .... 55
5. Youth Strategies ... 55
5.1. Overview of San Francisco’s Youth ... 55
5.2. WISF’s Vision for Serving Youth ... 56
5.3. Policy Strategies ... 57
5.3.1. Bridge to Success ... 57
5.3.2. Transitional Aged Youth Task Force ... 57
5.3.3. Youth Council ... 58
5.3.4. WISF ... 58
5.4. Program Strategies ... 58
5.4.1. CTE Partnership ... 58
5.4.2. Young Adult WorkLink ... 59
6.4.3. RAMP-SF ... 61
5.4.4. Sector Bridge ... 63
6.1. System Alignment and Accountability ... 64
6.2. The Regional Training and Education Pipeline ... 65
6.3. Engaging Key Stakeholders ... 65
6.4. The WISF Public Comment Process ... 66
6.5. Disbursement of Grant Funds ... 67
6.6. San Francisco’s One-Stop System ... 67
6.7. San Francisco’s Designation and Certification of One-Stop Operators ... 68
6.8. One Stop Services ... 68
6.9. Accessibility of Services ... 71
6.10. The WISF and Small Businesses ... 72
6.11. Training in Priority Sectors ... 73
6.12. Resource Leveraging ... 73
6.13. The Continuous Improvement of Training Providers ... 73
6.14. Serving UI Claimants and TAA Service Recipients ... 74
6.15. Preparing Workers for Green Jobs ... 74
6.16. Apprenticeship Program and Job Corps Integration ... 74
6.17. WISF Bylaws ... 74
6.18. Local Plan Updates ... 75
6.19. Integrated Service Delivery ... 75
7. Memorandum of Understanding ... 75
8. Local WIA Common Measure Performance Goals ... 76
Tables & Figures:
Table 1: Local, Regional, and State Unemployment Rate and Labor Force ... 8Table 2: Top 30 Projected Jobs - San Francisco County, 2018 ... 10
Table 3: Top 10 Local and Regional Industries ... 11
Table 4: Job Listings by San Francisco-Oakland-Fremont MSA (01/14/13 to 05/13/13) ... 11
Table 5: Job Listings by Major Occupations San Francisco-Oakland-Fremont MSA (01/13-05/13) ... 11
Table 6: Local, Regional, State and National Demographics ... 13
Table 7: Income Demographics for San Francisco City & County ... 13
Table 8: Construction Growth, San Francisco, San Mateo and Marin Counties ... 18
Table 9: Health Care Clusters and Growth, San Francisco, San Mateo and Marin Counties ... 23
Table 10: Hospitality Clusters and Growth, San Francisco, San Mateo and Marin Counties ... 29
Table 11: 10 Year ICT Employment by County, State, Nation ... 33
Table 12: ICT Clusters and Growth, San Francisco, San Mateo and Marin Counties ... 34
Figure 1: Structure of San Francisco’s Private Sector (Ted Egan, December 2012)... 7
Figure 2: Private Sector Employment in San Francisco (2010 & 2020) ... 8
Figure 3: Bay Area Region Industry Clusters of Opportunity ... 10
Figure 4: San Francisco Construction Industry Employment ... 16
Figure 5: Regional Construction Industry, 2008-2018 ... 16
Figure 7: All Construction Employment (excluding Administrative) - 2008-2018 ... 19
Figure 8: Hiring Scale for Construction Occupations in the San Francisco MSA ... 19
Figure 9: San Francisco Health Care Sector Employment (2013) ... 21
Figure 10: Regional Health Care Industry ... 21
Figure 11: Health Care Industry San Francisco Businesses ... 22
Figure 12: All Health Care Employment - 2008-2018 ... 24
Figure 13: Hiring Scale for Health Care Occupations in the San Francisco MSA... 25
Figure 14: Health Care Credential Attainment and Health Care Job Openings ... 26
Figure 15: San Francisco Hospitality Industry Employment (2013) ... 27
Figure 16: Regional Hospitality Industry ... 27
Figure 17: Hospitality Industry San Francisco Businesses ... 28
Figure 18: All Hospitality Employment - 2008-2018 ... 30
Figure 19: San Francisco ICT Industry Employment ... 32
Figure 20: Regional ICT Industry ... 32
Figure 21: ICT Industry San Francisco Businesses ... 33
Figure 22: All ICT Employment - 2008-2018 ... 35
Figure 23: Difficulties in Recruitment for ICT Occupations ... 36
Figure 24: Hiring Scale for ICT Occupations in the San Francisco MSA ... 36
1. Vision
San Francisco is the innovation capital of the world. The way the world buys and listens to music, how we use our cellphones, what we wear, even the kind of food we eat – all have been changed by ideas that got their start in San Francisco.
Mayor Edwin M. Lee, the Chief Local Elected Official, and Workforce Investment San Francisco (WISF), the city’s Workforce Investment Board, envision a workforce system that leverages San Francisco’s innovation economy on behalf of the city’s residents and workforce. The City & County of San Francisco will implement this vision by building upon its successful sector strategy, a strategy that aligns the city’s workforce programs around the needs of local and regional industry growth sectors, and through its “access points” strategy that creates training and employment pathways for disadvantaged San Franciscans.
1.1 The San Francisco Context
San Francisco’s economy has rebounded strongly from the nationwide recession. As of April 2013, the city’s unemployment rate (5.4 percent) was the third lowest among California’s 58 counties. Major sectors of San Francisco’s economy – tech, hospitality, health care, and construction – are leading the way:
• An influx of technology firms has pushed the number of tech jobs in San Francisco to
approximately 40,000, its highest mark ever. The strength of this sector is particularly significant because of its “multiplier effect” in the local economy, with research suggesting that as many as five local jobs are created for each tech job. In all, over 1,700 technology firms, including anchor companies such as Twitter, Yelp, Zynga, and Salesforce.com, call San Francisco home.
• The city’s hospitality industry is stronger than ever: within the past year, the city’s hotel industry saw its highest ever occupancy and room rates, while San Francisco International Airport
welcomed over 43 million total passengers in 2012, making it the seventh busiest airport in North America.
• The health care sector is projected to grow by 13% by 2020, solidifying its role as a vital San Francisco industry. This role will be further enhanced by the completion of major public and private hospital projects, including the recently completed rebuild of Laguna Honda Hospital, the current rebuild of San Francisco General Hospital, and California Pacific Medical Center’s proposed construction of two San Francisco hospitals.
• Construction cranes dot the San Francisco skyline, reflecting a construction boom unseen in decades. According to the San Francisco Planning Department, the total cost of construction associated with building permits in 2011 was $3.4 billion, exceeding the average of the previous nine years by a billion dollars. And the construction boom is projected to continue. For example, over 4,200 units of residential housing began construction in 2012, twenty times the number of housing units built in 2011.
Mayor Lee is committed to ensuring that San Francisco’s economic boom includes all residents seeking work, including residents with multiple barriers to entering/re-entering the workforce. In line with the
City’s sector strategy, the Mayor’s 17-point jobs plan calls for a comprehensive approach to sustained economic and job growth, including forging a partnership with local technology companies to create more apprenticeship programs for students exiting the city’s high schools and colleges (tech sector), expanding the Moscone Convention Center (hospitality sector), and aggressive implementing of San Francisco’s landmark Local Hire Ordinance (construction sector).
1.2. Laying the Foundation: The 2009 WISF Workforce Strategic Plan
In 2009 the WISF adopted its initial Workforce Strategic Plan, setting San Francisco on a clear path to meeting the workforce needs of its residents. The Plan established a vision and mission for the city’s workforce system:
1.2.1. Vision
San Francisco will have a talented workforce that attracts, retains, and expands competitive industries and enhances the standard of living for all of the City’s residents.
1.2.2. Mission
The mission of the Workforce Development Division of the Office of Economic and Workforce Development is to build public-private partnerships that create and guide a continuum of workforce services that improve the economic vitality for people and businesses.
Further, the Plan established five goals to implement this vision and mission:
1. Goal One: Improve the responsiveness of the workforce system to meet the demands of sustainable and growing industries, providing employers with skilled workers and expanding employment opportunity for San Francisco residents.
2. Goal Two: Re-engage youth disconnected from the education system and labor market to achieve academic credentials, transition to post-secondary education, and/or secure living wage employment.
3. Goal Three: Increase access to workforce services for populations underserved by the workforce system.
4. Goal Four: Improve the quality of services available to businesses through the workforce system to promote hiring San Francisco job seekers.
5. Goal Five: Streamline and align policy and administration across multiple funding sources. Since 2009, the San Francisco Office of Economic & Workforce Development (OEWD), staff and partner to the WISF, has aggressively implemented strategies to achieve these vital workforce goals. Of
particular note:
• The integration of current Labor Market Information (LMI) data and real-time information on hiring trends from local and regional employers to inform workforce development strategies; • The creation of sector academies that integrate skill development, support services, and job
development that prepare and place low-to-high skilled individuals for a range of jobs within a targeted industry (technology, hospitality, health care, construction). San Francisco’s sector academies are rooted in evidence based practice and a national movement to sector-specific training;
• The launching of “on ramp” and “sector bridge” programs for youth – programs that assist low-skilled youth to meet the skills and education requirements for entry into post-secondary education and/or existing vocational training programs who would otherwise not meet the prerequisites;
• The expansion of One Stop services into high need neighborhoods through a network of “Neighborhood Access Points,” each tailored to the specific needs of the community in which it operates; and,
• The enhancement of employer engagement programs that utilize business feedback to effectively screen candidates, appropriately match qualified candidates with available employment opportunities, and provide efficient referrals to employer partners. 1.3. Sustained Success: The 2013-2017 WISF Workforce Strategic Plan
Mayor Lee and the WISF reaffirm the vision, mission, and goals established in the 2009 WISF Workforce Strategic Plan. Yet with an eye to new challenges and opportunities, this iteration of San Francisco’s strategic plan has been expanded to include the following goals:
6. Goal Six: Strengthen policy and programmatic coordination between the workforce system and the city’s educational institutions, specifically the San Francisco Unified School District and City College of San Francisco.
7. Goal Seven: Work collaboratively across City departments to implement effective workforce strategies – such as subsidized employment and “earn while you learn” programming – tailored to the needs of targeted populations, including public housing residents, persons who are homeless, ex-offenders, transitional age youth (TAY), and English language learners.
8. Goal Eight: Equipped with the most current labor market analysis, meet the workforce needs of growth sectors within the local and regional economy.
9. Goal Nine: Support local government and private sector succession planning efforts through targeted skill building programs aligned with job vacancy projections.
The 2013-2017 WISF Workforce Strategic Plan is firmly aligned with the goals and strategies of
California’s Strategic Workforce Development Plan – including, at its core, a proven and effective sector strategy.
1.3.1. A Robust Sector Strategy
San Francisco’s proven sector strategy for workforce development is rooted in detailed economic analysis and forecasting performed by both the San Francisco Office of Economic Analysis (OEA) and the California Employment Development Department (EDD).
The latest data published by OEA (December 2012) found that both the “creative” (e.g. IT services, internet media, software) and “experience” (e.g. restaurants, nightlife, accommodations) industries led the city’s economy out of recession. According to OEA data, creative industries grew at over 4% per year over the past business cycle (2004-2010), and San Francisco’s concentration is 70% more than the national average. Experience industries grew at 1.5% per year during that period and are 40% more concentrated than the U.S. average.
Private sector health care jobs grew more slowly than the creative and experience sectors, but still grew at 1% from 2004 to 2010 – and public and private health care represents a significant employment sector. Meanwhile, San Francisco’s construction sector, which saw a decline in employment over this time period due to the national collapse of the housing market, has rebounded since the end of the recession. According to the EDD, the number of construction industry jobs in San Francisco has increased by over 9% from March 2012 to March 2013.
Accordingly, San Francisco has established “sector academies” that provide postsecondary training in the following fields: technology, health care, hospitality, and construction. These sector academies braid vocational training in a growing field with supportive services and, ultimately, employment services and post-placement support.
San Francisco’s sector academy approach also provides the opportunity for participants to sequence credentials within a field. For example, the health care academy offers training from personal care giver and certified home health aide to certified nursing assistant.
San Francisco will continue to match the most current Labor Market Information (LMI) data with real-time information on hiring trends from local and regional employers to inform its sector academy approach to workforce development, adjusting its training as needed based on employment projections and employer feedback. The WISF will not only evaluate the effectiveness of current efforts but will also determine if additional sector academies would be beneficial to its efforts.
1.3.2. Access Points
The WISF recognizes that it must pair its program of vocational training, primarily achieved through its sector academies, with genuine career pathways for disadvantaged and at-risk populations. There must be a focus on foundational skills as well as advanced training – and a clear connection between the two. To that end, the WISF recently reoriented its funding of San Francisco’s workforce system to create a series of “access points” through which services and outreach are aligned to meet neighborhood-specific and population-neighborhood-specific needs.
In addition to funding its four sector academies and youth sector bridge programs, in its upcoming funding cycle the WISF will fund access points for youth and for eleven high-need neighborhoods. The WISF will also continue to fund a comprehensive citywide access point and a “reentry navigator” to work specifically with ex-offenders. Each of these programs is designed to provide easy access for San
Francisco residents into the workforce system, helping clients obtain training and/or employment in growing sectors of the local and regional economy.
It is worth noting that for the first time WISF will fund an Assessment and Education Coordinator to coordinate the delivery of academic assessment and skill-building services across the network of access points. This position is evidence of San Francisco’s commitment to ensure consistent academic
San Francisco’s access points strategy was developed through an extensive and inclusive stakeholder process, one that included meetings with industry employers, community-based organizations, citizen advisory bodies (the Youth Council and Workforce Investment Community Advisory Council), and the WISF, which served to formally approve the strategy and funding allocation. These advisory bodies are described in greater detail below.
1.3.3. Engaged Workforce Institutions
San Francisco’s workforce strategies, specifically the sector academies and access points, are guided by the diverse, engaged WISF and its sector sub-committees (technology, hospitality, health care,
construction). The WISF invests approximately $13 million per year to support the San Francisco workforce system, leveraging local funds to supplement WIA and CDBG workforce dollars.
The majority of WISF members are employers, representing a broad cross-section of economic sectors including those for which San Francisco has established sector academies as well as leading financial institutions, energy firms, and media companies. Also represented on the WISF are labor unions, community-based organizations, economic development specialists, two members of the San Francisco Board of Supervisors, and representatives of both the San Francisco Unified School District and City College of San Francisco.
Two additional important bodies through which workforce policy is formed and tested are San Francisco’s Youth Council and Workforce Investment Community Advisory Committee (WiCAC), an advisory group comprised of representatives from diverse community-based organizations. These committees – comprised of leading nonprofit service providers and relevant governmental agencies, such as San Francisco Unified School District, City College of San Francisco, and the Department of Children, Youth, and Their Families – offer additional opportunity for input from valued community-based and public sector stakeholders.
In all, Mayor Lee has formed strong, diverse workforce institutions, with a primary focus on including stakeholders affiliated with growing sectors of the San Francisco and Bay Area economies. Through these institutions (WISF, Youth Council, WiCAC, sector subcommittees), stakeholders representing priority industry sectors, labor organizations, education partners, relevant City departments, and community-based organizations representing target populations of job-seekers were invited to provide input in the development of this strategic plan.
1.3.4. Regional Collaboration
San Francisco City & County, located at the heart of the Bay Area, has identified the following industry sectors as the focus of regional planning efforts:
• Construction • Health Care • Hospitality
• Information and Communications Technology (ICT)
San Francisco has identified these four industry clusters based on multiple sources of labor market information, including government data, sector analyses, regional economic reports, academic studies,
employer associations, collaborations with education, labor and employer organizations, and input from sector-based industry advisory groups.
Mayor Lee and the WISF will continue to actively support the development of regional workforce and economic development networks. To that end, San Francisco will partner with the following workforce investment boards (WIBs) to ensure that a regional workforce is trained and prepared for employment within priority sectors and in replacement jobs: San Mateo County, Santa Cruz County, NOVA
(representing a consortium composed of seven northern Santa Clara County cities), and work2future (San Jose and southern Santa Clara County).
Under the terms of this partnership, the WIBs will unite to select priority sectors within the region, with each WIB taking on a leadership role to collect and disseminate labor market information for a specific sector. Collectively, the WIBs will share industry and occupational forecasts, skill gaps, employer demand, training opportunities and training gaps using a variety of sources, methodologies, and tools appropriate for the sector.
2. Economic and Workforce Analysis
The San Francisco Office of Economic and Workforce Development invested in considerable research to develop a strategy grounded in local and regional demographic and economic data. We looked to a variety of sources to identify county and regional issues for both economic and workforce development, including those noted below. Through an ongoing analysis of economic and industry trends as well as program performance and outcomes, we will ensure that our strategies, sectors and occupations are the most appropriate for the populations and industries we serve.
• Government and Non-Government Data Sources (see appendix for complete list) • Input from industry advisory committees
• Individual interviews with employers, hiring managers, and industry associations • Individual interviews with education and training providers
• Individual interviews with leaders from local community based organizations • Input from regional workforce investment board collaboration
• San Francisco City and County Economic Analyses • Regional Studies (see appendix for complete list)
2.1. How the Economic and Workforce Analysis is Organized
The economic and workforce analysis gives a broad overview of the county and region and then delves deeper into the needs of the local population. In the overview, we provide an analysis of the San Francisco and regional economies, looking at growth for the county and the region. Following the overview, we provide a detailed analysis of our four priority sectors:
• Sector composition and growth, locally and regionally
• Overview of occupations within the sector, anticipated growth locally and regionally • Wages and opportunities for economic security and self-sufficiency
• Required workforce skills, needs and challenges • Education and training landscape
2.2. San Francisco Economy: Overview
San Francisco’s private sector economy is made up of three clusters: creative industries, financial and professional services, and experience industries (see Figure 1). According to Chief Economist, Ted Egan:
• Creative industries (69,000 jobs), grew at over 4% per year over the past business cycle (2004-2010), and San Francisco's concentration is 70% more than the national average. Information Technology services is both the largest industry and its most successful major component. Over the last business cycle, covering the Great Recession, the industry grew over 10% per year. Consulting and private-sector education are also major sources of employment in this cluster. • Financial and professional service industries (107,000 jobs) remain concentrated but lost jobs
during the last business cycle. Financial services was hard-hit across the country during the past recession, but the decline in San Francisco is a function of a longer-term trend of differentiation among industry sub-clusters.The cluster is split between the relatively healthy growth of
corporate headquarter establishments and traditional professional and business services such as law and accounting, and the decline of banking and insurance.
• Experience industries (78,000 jobs) grew at 1.5% per year during that period and are 40% more concentrated than the U.S. average. Restaurants and bars make up the bulk of the city's
experience industry cluster, and that industry's growth was a healthy 2.3% annually between 2004 and 2010. The growth in the city's museums and recreation businesses offset declines in performing arts and accommodations.
2.3. Regional Economy: Overview
The economy in the Silicon Valley region has five characteristics that are different in varying degrees from other regional economies, each of which is addressed in this plan:
• The Silicon Valley region, including San Francisco, has the highest concentration of technology related jobs of any area in California or the nation.
• The area economy is recovering from the recession faster than most areas and has both higher current job growth and lower unemployment rates as a result (see Table 1).
• The local service area and region as a whole has a substantial and ongoing number of dislocated workers, as high rates of job creation and destruction are a characteristic of economies with large shares of technology jobs and startups.
• At the same time, firms in the service area have large numbers of job openings that they are trying to fill with workers who have the appropriate skills.
• As a result of the nature of our local economy and patterns of long-distance, cross-county commuting among Silicon Valley workforce investment areas, strengthening regional
partnerships to develop strategies that are complementary and not duplicative is an especially important part of the San Francisco strategic plan.
Table 1: Local, Regional, and State Unemployment Rate and Labor Force
Demographics San Francisco
City &County Region* California
Labor Force 480,900 1,803,300 18,557,700
No. of Employed 452,100 1,686,100 16,817,200
No. of Unemployed 28,900 117,400 1,740,500
Unemployment Rate 6.0% 6.30% 9.40%
* Region refers to San Francisco, San Mateo and Santa Clara Counties. Source: EDD, Labor Market Information Division, Unemployment Rate and Labor Force
2.4. Local Growth
For this analysis, we looked at the Top 10 private-sector industries with the highest levels of employment in 2010 and projected 2020 employment as shown in Figure 2.
Figure 2: Private Sector Employment in San Francisco (2010 & 2020)
Source: QCEW Employees - EMSI 2013.2 Class of Worker
2.84% 3.23% 21.02% 5.74% 5.84% 7.00% 7.26% 12.35% 0.00% 5.00% 10.00% 15.00% 20.00% 25.00% Construction Educational Services (Private) Information & Communications Technology Finance and Insurance Administrative and Support and Waste…
Health Care and Social Assistance Retail Trade Accommodation and Food Services
• Construction jobs will see a 32% increase in employment opportunities in San Francisco, reflecting the overall economy’s growth as cranes are seen throughout the city. Construction will create over 4,000 jobs and continue to be an entrée into the workforce and into well-paying careers for low skilled San Franciscans.
• Health care jobs continue to grow at a healthy rate in the city and this sector is projected to grow by 13% by 2020. The percentage it contributes to overall employment does not increase, however, due to the large number of jobs created in ICT.
• Hospitality (seen here as accommodation and food services) is the next largest industry employer which will account for 12% of the jobs in the local area. This is a 25% increase over 2010 employment.
• The Information and Communications Technology Sector iis expected to make the most dramatic increases in employment compared to all other sectors. According to EDD data, ICT is projected to increase by 52% in the ten years ending in 2020. If these projections come to pass, the ICT industry will account for 21% of all jobs in the city.
• The Retail sector is projected to provide 7% of the jobs. OEWD addresses this sector through customer service training through the hospitality initiative.
• Administrative and Finance/Insurance are both areas that are experiencing decreases in employment in the local area. Finance is projected to lose almost 2,000 jobs. The increase in administrative/waste support industry is primarily through waste management jobs, but is not a significant portion of the San Francisco workforce.
• Private education services is an industry that is growing in the region. This industry requires high levels of education and/or experience.
Analysis of the local occupation growth shows similar patterns. Table 2 identifies the top 30 jobs projected for San Francisco County in 2018. Of these top 30 occupations, our sector strategy currently provides training and support for 12 (highlighted in red). The occupations that we train for and those analyzed throughout this document were selected based on:
• Their projected high growth;
• Accessibility to our target populations; and
• Our potential to build partnerships and leverage resources to meet the sector’s workforce needs.
Table 2: Top 30 Projected Jobs - San Francisco County, 2018
1. Combined Food Preparation & Serving Workers, including Fast Food
2. Janitors, Maids & Housekeepers
3. Secretaries and Administrative Assistants
4. Software Developers and Programmers
5. Waiters and Waitresses
6. Retail Salespersons
7. Construction Trades
8. Registered Nurses
9. Office Clerks, General 10. Postsecondary Teachers
11. Cashiers
12. General and Operations Managers 13. Miscellaneous Business Operations
Specialists
14. Accountants and Auditors 15. Childcare Workers
16. Bookkeeping, Accounting, and Auditing Clerks
17. Customer Service Representatives 18. Lawyers and Judicial Law Clerks 19. Nursing, Psychiatric, and Home
Health Aides
20. Security Guards
21. Financial Analysts and Advisors 22. Laborers and Material Movers,
Hand
23. First-Line Supervisors of Office and Administrative Support Workers 24. Personal Care Aides
25. Management Analysts 26. Market Research Analysts and
Marketing Specialists 27. Computer and Information
Analysts
28. Marketing, Advertising and Sales Managers
29. Miscellaneous Sales Representatives, Services
Source: EMSI QCEW Class of Worker - 2013.2
2.5. Regional Growth
The City and County of San Francisco’s economy is not isolated, but exists within an ecosystem of the Bay Area. Figure 3, prepared by EDD’s Labor Market Information Division for NOVA, illustrate the
regional economy. According to this analysis, the Information and Communication Technologies industry cluster has an employment concentration double that of California as a whole and has experienced significant growth. Health Services, and Arts, Entertainment, and Tourism are two other clusters that show significant growth both locally and regionally.
Figure 3: Bay Area Region Industry Clusters of Opportunity
Table 3 ranks the top 10 growth industries both locally and regionally. While Professional, Scientific, and Technical Services; Health Care, Social Assistance & Education; and Accommodation and Food Services are drivers of both the local and regional economy, San Francisco differs from the region in that we have experienced a decline in manufacturing. While manufacturing is a focus for the Silicon Valley region and an important consideration for their workforce, it is not a focus for San Francisco.
Table 3: Top 10 Local and Regional Industries Description Local 2010 Jobs Local 2020 Jobs Local Rank Region* 2010 Jobs Region* 2020 Jobs Region* Rank
Information & Communications Tech. 90,837 138,090 1 295,098 411,952 1
Health Care, Social Assistance & Education 56,524 67,192 4 194,888 238,990 2
Government 97,066 98,735 2 213,600 210,909 3
Accommodation and Food Services 65,038 81,132 3 155,652 197,060 4
Manufacturing 8,802 8,676 14 185,726 191,520 5
Retail Trade 39,969 47,703 6 149,530 173,700 6
Administrative, Support, Waste Mgmt 33,738 38,346 7 97,904 121,004 7
Other Services 38,881 47,709 5 83,607 103,170 8
Construction 14,127 18,622 9 57,975 79,091 9
Finance and Insurance 39,344 37,727 8 70,450 76,388 10
* Region includes San Francisco, San Mateo and Santa Clara Counties Source: QCEW Employees - EMSI 2013.2 Class of Worker
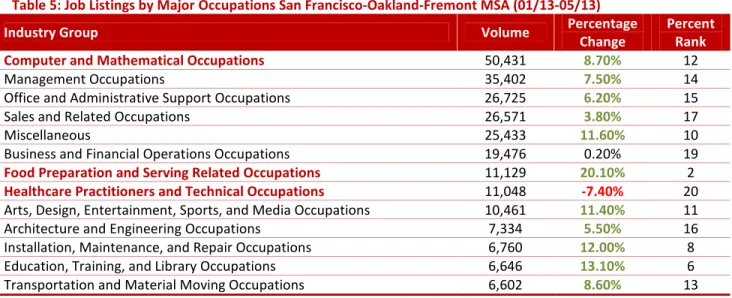
Government labor market information gives us one view of the local and regional economies, but looking at job ads provides a time-sensitive snapshot of employer demand. The overall pattern of job growth in the local area and region is evident in the job ads shown in WANTED Analytics (Tables 4 and 5). There has been an overall increase in job listings in the region, but particularly in San Francisco. Computer jobs are the most advertised occupations, with management occupations also in high demand. Food preparation and construction are areas that have seen strong recent growth, reflecting an increase in demand for both of these industries.
Table 4: Job Listings by San Francisco-Oakland-Fremont MSA (01/14/13 to 05/13/13)
Source: WANTED Analytics, Hiring Demand
Table 5: Job Listings by Major Occupations San Francisco-Oakland-Fremont MSA (01/13-05/13)
Industry Group Volume Percentage
Change
Percent Rank
Computer and Mathematical Occupations 50,431 8.70% 12
Management Occupations 35,402 7.50% 14
Office and Administrative Support Occupations 26,725 6.20% 15
Sales and Related Occupations 26,571 3.80% 17
Miscellaneous 25,433 11.60% 10
Business and Financial Operations Occupations 19,476 0.20% 19
Food Preparation and Serving Related Occupations 11,129 20.10% 2
Healthcare Practitioners and Technical Occupations 11,048 -7.40% 20
Arts, Design, Entertainment, Sports, and Media Occupations 10,461 11.40% 11
Architecture and Engineering Occupations 7,334 5.50% 16
Installation, Maintenance, and Repair Occupations 6,760 12.00% 8
Education, Training, and Library Occupations 6,646 13.10% 6
Personal Care and Service Occupations 6,023 17.30% 4
Construction and Extraction Occupations 4,738 20.80% 1
Life, Physical, and Social Science Occupations 4,569 11.90% 9
Community and Social Services Occupations 4,498 15.40% 5
Building and Grounds Cleaning and Maintenance Occupations 3,954 12.50% 7
Production Occupations 3,899 18.30% 3
Healthcare Support Occupations 3,834 3.60% 18
Source: WANTED Analytics, Hiring Demand
The four industry clusters that comprise San Francisco City & County’s sector strategy – Construction, Health Care, Hospitality and Information and Communications Technology – drive the local economy and are major influences on the region. In our work with the other local areas, including NOVA and work2future, we have identified these as core focus areas. ICT, in particular, is an area of projected growth, and San Francisco is projected to be a major influence on the sector. It is a vital component in both the regional and local economies.
2.6. Characteristics of the Local Population
OEWD is committed to providing services designed to meet the needs of local residents and has identified the following features that will drive our program strategy, design and implementation:
• Educational Disparity • Immigrant Workforce • Wealth Disparity
• Skills Gap & Digital Divide 2.6.1. Educational Disparity
Educational attainment (Table 6) in San Francisco is notably higher than other areas in the state and country. 51% of San Francisco residents have a Bachelor’s degree or higher as compared to 47% for the region, 30% for the state and 28% in the nation. Despite this high concentration of educated residents, a large share of the city’s residents – 14% – do not have a high school diploma or its equivalent. This is a full percent point higher than the region as a whole. While this statistic is not significantly different than the state or national averages, the knowledge-based economy in San Francisco and in the region indicates that these individuals will need specialized workforce services to help them be competitive in the labor market. As San Francisco’s Chief Economist, Ted Egan, noted “Living-wage job opportunities requiring short- or medium-term on-the-job training, a post-secondary vocational certificate, or Associates degree, are growing in San Francisco.”
2.6.2. Immigrant Workforce
San Francisco and the Silicon Valley Region have a higher than average number of foreign-born individuals, 36% of the population (Table 6). This immigrant workforce is growing faster than the US-born workforce in San Francisco, at every level of income. Growth trends by income for immigrant and US-born workers are identical, with nearly all growth occurring at the upper and lower ends of the income spectrum. We will work to meet the needs of this growing group, both in terms of vocational skills and English language attainment. San Francisco is an international city, a hub of both tourism and industry. As such our San Francisco immigrant workforce is crucial to the health of the local and regional economies. As the human resources director of a large hotel chain said recently, “Someone who can
communicate effectively in English will double their earning potential and have even greater value to us if he or she is bilingual.”
Table 6: Local, Regional, State and National Demographics
Demographics San Francisco
City &County Region* California United States Population (2012) Total Population 825,863 3,402,678 38,041,430 313,914,040 Percent Change (2010-2012) 2.60% 2.86% 2.10% 1.70% Age (2011) Under 18 13.50% 21.00% 24.60% 23.70% 18 to 64 72.70% 66.60% 63.70% 63.00% 65 and over 13.80% 12.40% 11.70% 13.30%
Ethnicity & Language (2007-2011)
Foreign-born 35.60% 35.98% 27.20% 12.80%
Language other than English spoken at home 45.30% 48.02% 43.20% 20.30%
Educational Attainment (persons 25+ 2007-2011)
No high school diploma or GED 14.30% 13.28% 19.20% 14.60%
High school graduate/GED or higher 85.70% 86.72% 80.80% 85.40%
Bachelor's degree or higher 51.40% 46.58% 30.20% 28.20%
* Region refers to San Francisco, San Mateo and Santa Clara Counties. Source: US Census Bureau State & County QuickFacts
2.6.3. Wealth Disparity
San Francisco is perceived as a wealthy area with an average household income of $105,753 (Table 7). However, 12% of residents live below the poverty level. According to Chief Economist, Ted Egan, between 1990 and 2010, the population living in Extremely Low / Very Low income households (those earning less than 50% of Area Median Income) has grown the most. Growth has also been seen in households earning over 150% of area median income, and, to a lesser extent, in those earning 120-150% of AMI. The low income population (50-80% of AMI) has seen very slight growth, and the moderate income population (80-120%) experienced a decline in absolute numbers.
The cost of housing in San Francisco exacerbates the wealth disparity. Local housing costs not only exceed the national average but, thanks to a housing market crash that affected San Francisco less than other places, the city now has the most expensive housing in the region.
OEWD has implemented evidence-based sector academies and programs that provide access to employment opportunities for our priority populations, those most affected by wealth disparity. Our sectors – healthcare, construction, information and communications technology, and hospitality – were selected because of their high growth potential, entry-level employment opportunities, and more importantly, because of their pathways to self-sufficiency and economic security.
Table 7: Income Demographics for San Francisco City & County
Demographics of San Francisco Residents Estimate Percent Percent of Individuals below the Poverty Level
All people (X) 12.3%
Under 18 years (X) 12.7%
18 years and over (X) 12.2%
18 to 64 years (X) 12.2%
Income & Benefits Total households 338,366 Less than $10,000 21,561 6.4% $10,000 to $14,999 20,258 6.0% $15,000 to $24,999 28,152 8.3% $25,000 to $34,999 23,862 7.1% $35,000 to $49,999 31,665 9.4% $50,000 to $74,999 47,260 14.0% $75,000 to $99,999 37,965 11.2% $100,000 to $149,999 55,237 16.3% $150,000 to $199,999 29,848 8.8% $200,000 or more 42,558 12.6%
Median household income (dollars) 72,947 Mean household income (dollars) 105,753
Source: U.S. Census Bureau, 2007-2011 American Community Survey
2.6.4. Digital Divide
According to a recent study by the Public Policy Institute of California, 78% of San Francisco Bay Area adult residents have broadband access, an increase of 18 percentage points from 2008 (Public Policy Institute of California, 2012). However, statewide data indicate that there is disparity between groups; access to broadband and internet usage is highest among educated, U.S. born individuals, whites and blacks. While specific data could not be identified on digital literacy in the county, employers point out that all jobs, “high-tech” or not, require digital literacy.
A draft study released by the Mid-Pacific ICT Center and Centers of Excellence on March 18, 2013 found that over 85% of California employers surveyed agreed that digital literacy should be considered a basic skill. More than 76% also agree that non-technical skills (soft, workplace, or employability) are at least as important as technical skills (COE & MPICT, 2013). This was echoed recently by hospitality employers who said that technology and communication skills were critical to the success of their businesses. Not only are restaurants and hotels moving to computer-based tools for accomplishing their work, but they are introducing more computer-based training and application systems. A lack of digital literacy will be a barrier to applying to jobs, to doing the actual work, and to progressing in one’s field. As part of our strategy over the next five years, OEWD will integrate digital literacy into all of our programming, including access point services and sector bridge programs. In addition, we will work with employers to identify their sector’s workforce technology needs in order to proactively prepare the workforce of tomorrow.
2.7. Employment Needs of the Local Area Population
Based on the local area population trends and specific industry analyses that follow, implementing strategies and identifying opportunities that will promote entry into the workforce, pathways to a career, and self-sufficiency will continue to be our primary objective. An approach that focuses on building skills aligned with DOL’s competency model and ongoing employer engagement will be the anchor of all our programming. Based on our own best-practices and the evidence base in the field, we have identified the following program elements for success:
• Recruitment, screening, and intake processes to ensure a good match between the applicant, the program, and the target occupation.
• Job readiness, basic skills, including digital literacy skills and hands-on technical skills training offered through the lens of specific industries and occupations.
• Individualized services to support training completion, industry- and occupation-specific job search, and success on the job.
• A strong link to local and regional employers that results in an evolving and responsive understanding of the target industries, occupations and connections to jobs that provide self-sufficiency pathways.
In the industry analyses that follow, we include the following:
• Overview of specific required workforce skills and knowledge
• Listing of occupations that can provide economic security or self-sufficiency • Proposed strategies for meeting employer needs while closing skills gaps 2.8. Construction Industry: Overview
2.8.1. Construction Industry Composition and Growth
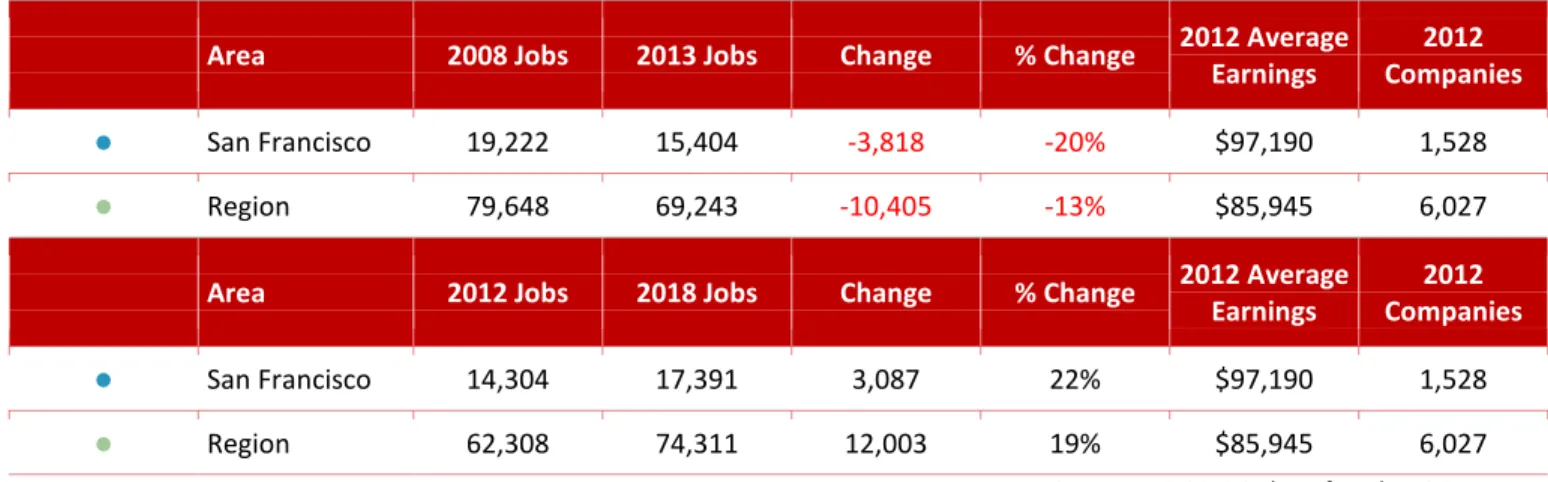
San Francisco City and County is home to approximately 1,528 construction organizations of all sizes, employing 15,404 individuals. It is one of the biggest sectors in the area, as noted in the overview of the economy, above. Construction is both a driver of the local economy as well as a beneficiary of economic growth. Regional construction employment peaked in 2008 as did local construction employment and then began experiencing reductions during the recession. Construction employment both locally and regionally has experienced consistent growth since 2011 which is anticipated to continue for the next five years and beyond.
In December of 2010, the San Francisco Board of Supervisors formally adopted the San Francisco Local Hiring Policy for Construction, becoming one of the strongest pieces of legislation in the country to promote the utilization of local residents on locally sponsored projects. In the first year of the Local Hire Policy, the mandatory local hiring requirement was 20% by trade. In the second year, this increased to 25% and in the third year (beginning March 2013), 30%.
In addition to implementing the Policy in 2011 and overseeing the Policy since, OEWD created the CityBuild Academy in 2006. CityBuild’s goals are to prepare local residents for entry into the construction industry through a pre-apprenticeship and construction administration training, assist contractors meet their local hire requirements, and provide construction employers with skilled workers. As of March 2013, 604 residents have successfully completed the CityBuild Academy training and, of those, 519 or 86% have entered union Department of Industrial Relations (DRI) apprenticeship programs in various trades. (OEWD, 2013)
This analysis includes the following five industries as representative of the construction sector (listed by NAICS code).
• 2361: Residential Building Construction • 2362: Nonresidential Building Construction • 237: Heavy and Civil Engineering Construction • 238: Specialty Trade Contractors
Figure 4: San Francisco Construction Industry Employment
Source: QCEW Employees - EMSI 2013.2 Class of Worker
According to EMSI data (Figure 5), construction employment is not anticipated to return to
pre-recession levels for many years, perhaps not until 2020. However, this pessimistic view is not shared by all. According to the Urban Land Institute’s 2013 study, San Francisco won designation as the top market for the investment, development and housing categories (Urban Land Institute, 2013). According to the study, “San Francisco is driven by growth and a strong jobs outlook, led by technology and a structural change away from suburban and toward downtown.” 28,000 new residential units have been approved by the San Francisco Planning Department, applications for another 6,000 units have been filed for review, and there are currently 3,900 units under construction. In addition, there are 16.4 million square feet of commercial development in the pipeline (San Francisco Planning Department, San Francisco Pipeline Report, 2013). Many of these projects are fully entitled at Park Merced, Treasure Island and Bayview/Hunters Point/Candlestick, whose construction will span several development cycles. According to our industry advisors, this trend in increased construction projects and expenditures on major projects will continue for the foreseeable future.
In addition, the San Francisco construction workforce is aging and it is anticipated that a large number of workers will retire in the next ten years. 40% of the San Francisco construction workers in 2012 were 45 years old or older; 13% were 55 or older. (L. Luster & Associates, 2013). Replacement workers will need to be recruited and trained in order for the local construction sector to support the economy’s growth and respond to the projected increase in housing and development.
Figure 5: Regional Construction Industry, 2008-2018
Residential Building Construction 25% Nonresidential Building Construction 19% Heavy and Civil
Engineering Construction 10% Specialty Trade Contractors 46%
Area 2008 Jobs 2013 Jobs Change % Change 2012 Average Earnings 2012 Companies ● San Francisco 19,222 15,404 -3,818 -20% $97,190 1,528 ● Region 79,648 69,243 -10,405 -13% $85,945 6,027
Area 2012 Jobs 2018 Jobs Change % Change 2012 Average Earnings
2012 Companies
● San Francisco 14,304 17,391 3,087 22% $97,190 1,528
● Region 62,308 74,311 12,003 19% $85,945 6,027
Source: EMSI 2013.2 Class of Worker, QCEW
2.8.1.i. San Francisco Construction Industry Businesses
According to EMSI and Equifax data, there are 1,528 construction employers located in San Francisco City and County. 78% of the businesses have between 1 and 10 local employees. Approximately half of those have 5 or fewer employees. This is consistent with the industry profile, which is comprised mainly of specialty trade contractors, small business that provide a specific trade such as plumbing, painting, flooring, etc.
Figure 6: San Francisco Construction Industry Businesses
Source: EMSI, Equifax (http://www.equifax.com/commercial/)
2.8.2. Construction Occupations
There are many occupations within the construction sector, from unskilled to skilled trades,
administrative and supervisorial/managerial roles in professional occupations, such as architect and engineer. OEWD has focused our work and the following analysis on the occupations shown below because they provide access to opportunities for our priority populations, a sustainable wage at entry, career pathway to advancement, and are growing and/or in demand in the area.
• Construction Trades
o All other Construction (47-4790)
o Carpenters (47-2030)
o Carpet, Floor, and Tile Installers and Finishers (47-2040)
o Cement Masons, Concrete Finishers, and Terrazzo Workers (47-2050)
o Construction Equipment Operators (47-2070) All Businesses 1-10 11-20 21-30 31-40 41+ 1-10 Employees 1 2 3 4 5 6 7 8
o Construction Laborers (47-2060)
o Drywall Installers, Ceiling Tile Installers, and Tapers (47-2080)
o Electricians (47-2110)
o Glazier (47-2120)
o Helpers, Construction Trades (47-3010)
o Painters & Paperhangers (47-2140)
o Plasterers and Stucco Masons (47-2160)
o Plumbers and Pipelayers (47-2150)
o Roofers (47-2180)
o Sheet Metal Workers (47-2210) • Construction Administrative
o General Office Clerks (43-9060)
o Secretaries and Administrative Assistants (43-6010)
Table 8 presents construction occupations outlining projections from EDD for the San Francisco region. For all occupations, there is positive growth projected for the region with 1,171 total jobs available per year. There is significant growth projected for all of the unskilled trades and most of the skilled trades. It is evident from the data that there will be entry-level openings as well as career growth available in the regional construction sector.
Regional data for administrative roles within in the construction industry is not available, but EMSI analysis shows 38% growth for office clerks and 33% growth for secretaries and administrative assistants between 2010 and 2020. In addition, OEWD’s CityBuild staff will explore opportunities for entry-level administrative employment opportunities through construction professional services contracts with the City & County of San Francisco.
Table 8: Construction Growth, San Francisco, San Mateo and Marin Counties
Employment Annual Average 2012
Occupational Title 2010-2020 Difference
Percent
Increase New Jobs
Replace-
ment Jobs Total Jobs
Median Hourly
Carpenters 1,450 19.2% 145 160 305 $31.61
Cement Masons and Concrete
Finishers 190 25.0% 19 12 31 $25.36
Construction Equipment Operators 180 22.0% 19 19 38 $33.66
Construction Laborers 990 17.2% 99 46 145 $25.12
Drywall and Ceiling Tile Installers 160 19.0% 16 23 39 $18.69
Electricians 460 18.5% 46 67 113 $34.42
Glaziers 80 40.0% 8 8 16 $22.84
Helpers, Construction Trades 260 31.0% 27 22 49 $19.34
Other Construction and Related
Workers 450 22.7% 45 58 103 $22.06
Painters and Paperhangers 490 10.5% 49 96 145 $24.35
Plasterers and Stucco Masons 10 7.1% 1 3 4 $20.29
Plumbers and Pipelayers 530 20.9% 51 73 124 $27.68
Roofers 110 10.0% 10 23 33 $24.19
Sheet Metal Workers 50 12.5% 6 7 13 $38.86
Tile and Marble Setters 60 19.4% 6 7 13 $24.57
Source: California Employment Development Department, Labor Market Information Division
2.8.2.i. Construction Occupational Growth in San Francisco
Figure 7 shows all construction occupations during the same time period with a consistent pattern of growth since 2011. For all clusters and occupations, growth is projected for the next five years. However, there is some disagreement about the level of growth. According to EMSI analysis and EDD data, growth will be modest, but according to our industry advisors as well as the San Francisco Planning Department and the Urban Land Institute studies cited earlier, we are currently experiencing the
beginning of a construction boom which will continue for the foreseeable future.
Figure 7: All Construction Employment (excluding Administrative) - 2008-2018
Source: EMSI Complete Employment - 2013.2
2.8.3. Wages: Economic Security and Self-Sufficiency
The lowest paid construction worker, according to EDD data, earns almost $20/hour. This wage is almost twice the local minimum wage. Construction provides a clear pathway to earnings, health benefits, and retirement provisions, especially for those with minimal education. The average hourly wage of San Francisco construction workers who had not attended college was $24.50 in 2012 (L. Luster &
Associates, 2013). However, workers in the specialty trades make much more than this wage depending on the trade. San Francisco focuses on providing training and support for entry-level roles and skilled workers. We collaborate with local union halls and training programs in order to ensure that jobseekers can enter the construction sector and identify pathways to specialized trades, including apprenticeships. 2.8.4. Required Workforce Skills: Employer Needs and Challenges
According to input from our construction industry advisory committee, employers continue to be challenged to recruit qualified, skilled workers with varying severity depending on the trade. This is supported by analysis done with Wanted Analytics which ranks the San Francisco Metro Statistical Area (San Francisco, Oakland and Fremont) as more difficult than the national average.
Figure 8: Hiring Scale for Construction Occupations in the San Francisco MSA
2008 2009 2010 2011 2012 2013 2014 2015 2016 2017 2018 Total 13,376 11,163 10,309 10,007 10,454 11,095 11,193 11,351 11,559 11,790 12,111 0 2,000 4,000 6,000 8,000 10,000 12,000 14,000 16,000
2.8.5. Education and Training Landscape
Outside of the professional occupations in construction, there is very little training and education for construction occupations. City College of San Francisco (CCSF) is the only official educational institution that offers construction training, outside of the offerings by union halls for specific trades. Through our collaboration with CCSF, OEWD’s City Build offers a hands-on pre-apprentice construction program that prepares candidates to enter construction trade DIR apprenticeships with union employers. The
Construction Administration Training Program (CATP) prepares candidates to perform back office functions on construction sites or home base offices.
2.8.6. Strategies for Meeting Employer Needs and Closing Skills Gaps
OEWD’s CityBuild initiative provides training and job placement assistance to local jobseekers and construction employers. We work closely with contractors, contractor associations, labor unions, apprenticeship programs, and education and training providers to strengthen and expand partnerships and to provide relevant services. For example, CityBuild has offered laborers excavation and shoring training to accommodate the sewer system and water system improvement programs (SSIP and WSIP). CityBuild is also working with San Francisco Municipal Transportation Agency to provide tunneling training in order to ensure a trained workforce for the Central Subway and Transbay Terminal projects. Through a responsive and proactive approach to workforce and collaborative partnerships, CityBuild devises strategies for moving San Franciscans into the crafts pipeline and helping employers meet their hiring needs.
2.9. Health Care Industry: Overview
2.9.1. Health Care Industry Composition and Growth
The San Francisco City and County health care sector includes approximately 2,073 organizations of varying sizes, employing 29,771 individuals. It is one of the biggest sectors in the area, as noted in the overview of the economy, above. As the Centers of Excellence found, “demographic, political, and economic trends will lead to significant long-term growth of healthcare occupations across the country” (Centers of Excellence, 2010).
Health care in San Francisco is different than the other sectors in that there are a few extremely large employers, including UCSF Medical Center which employs almost 5,000 people locally. UCSF is the second largest employer in San Francisco after the City and County itself. The other large health care employers are the Veterans Affairs Medical Center, the Public Health Department, Moffitt Hospital, St. Luke’s Hospital, St. Francis Memorial Hospital. Large hospitals account for 33% of all health care employment, but the ambulatory health care services – physician, dentist, chiropractor offices, etc. – actually employ far more people, 47% of the total (Figure 9). Forty percent of ambulatory health care services employees work in physicians’ offices.
This analysis includes the following three industries as representative of the healthcare sector (listed by NAICS code).
• 621: Ambulatory Health Care Services • 622: Hospitals
Figure 9: San Francisco Health Care Sector Employment (2013)
Source: QCEW Employees - EMSI 2013.2 Class of Worker
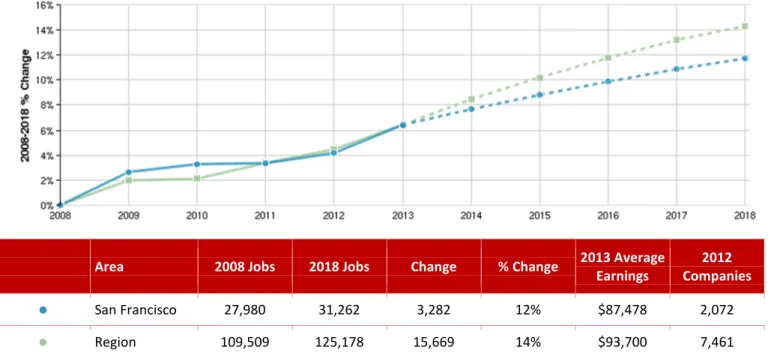
The health care sector fared relatively well during the recent economic downturn because medical services are perceived as an essential item. From 2005 to 2010, employment increased 8-15%,
depending on the region. Estimates in 2010 indicated growth would continue, but at a slower rate, 6.7-9.9% (Centers of Excellence, 2010). Projections through 2018 show 12% growth locally and 14%
regionally.
Figure 10: Regional Health Care Industry
Area 2008 Jobs 2018 Jobs Change % Change 2013 Average
Earnings
2012 Companies
● San Francisco 27,980 31,262 3,282 12% $87,478 2,072
● Region 109,509 125,178 15,669 14% $93,700 7,461
Source: EMSI 2013.2 Class of Worker, QCEW
2.9.1.i. San Francisco Health Care Industry Businesses
According to EMSI and Equifax data, there are 2,073 health care employers located in San Francisco City and County. Seventy-two percent of these businesses have between 3 and 10 local employees, 99%
47%
33% 20%
All Health Care Employers
Ambulatory Health Care Services Hospitals Nursing and Residential Care Facilities 40% 22% 36% 2%
Ambulatory Health Care Services Offices of Physicians Offices of Dentists Other Outpatient Care Centers Medical and Diagnostic Laboratories
have fewer than 100. This reflects the unique nature of the local healthcare sector that is made up of a few large employers, primarily hospitals, and hundreds of small ambulatory service providers.
Figure 11: Number of Employees in San Francisco Health Care Industry Businesses
Source: EMSI, Equifax (http://www.equifax.com/commercial/)
2.9.2. Health Care Occupations
Through our work with our health care employer advisory committee, we have identified the following four occupational clusters in healthcare listed with the specific occupations (listed with SOC code). These occupations were selected for analysis based on their projected high growth, accessibility to our target populations, and our potential to build partnerships and leverage resources to meet the sector’s workforce needs.
• Healthcare Practitioners
o Licensed Vocational Nurses (29-2061)
o Registered Nurses (29-1111)
o Respiratory Therapists (29-1126)
o Speech-Language Pathologists (29-1127) • Technicians & Technologists
o Dental Hygienists (29-2021)
o Emergency Medical Technicians and Paramedics (29-2041)
o Medical and Clinical Laboratory Technicians (29-2012)
o Medical and Clinical Laboratory Technologists (29-2011)
o Pharmacy Technicians (29-2052)
o Radiologic Technologists and Technicians (29-2037)
o Surgical Technologists (29-2055) • Administrative
o Medical Records and Health Information Technicians (29-2071)
o Medical Secretaries (43-6013) 1-10 11-20 21-30 31-40 41-50 51-60 61-70 70-80 81-90 91-100
• Healthcare Support
o Dental Assistants (31-9091)
o Home Health Aides (31-1011)
o Massage Therapists (31-9011)
o Medical Assistants (31-9092)
o Nursing Aides, Orderlies, and Attendants (31-1012)
o Pharmacy Aides (31-9095)
The five clusters represent a variety of occupations primarily within the healthcare industries. Growth for all occupations is expected to increase both locally and regionally. Table 9 shows growth percentages for the San Francisco Metro Region, which includes three local counties. According to EDD employment data, it is expected that there will be approximately 2,003 openings per year in the region for these occupations, including both new and replacement jobs.
Table 9: Health Care Clusters and Growth, San Francisco, San Mateo and Marin Counties
Employment Annual Average 2012
Occupational Title 2010-2020 Difference
Percent
Increase New Jobs
Replace-ment Jobs Total Jobs
Median Hourly Healthcare Practitioners Registered Nurses 2,700 14.8% 270 329 599 $54.23 Respiratory Therapists 180 21.2% 18 16 34 $38.76 Speech-Language Pathologists 110 16.2% 10 13 23 $40.42
Licensed Vocational Nurses 330 10.5% 32 84 116 $30.06
TOTAL: 3,320 14.5% 330 442 772 $40.87
Technicians & Technologists
Dental Hygienists 180 17.5% 18 21 39 $52.56
Emergency Medical Technicians and
Paramedics 130 22.0% 13 12 25 $21.87
Medical and Clinical Laboratory
Technicians 80 7.6% 8 20 28 $26.95
Medical and Clinical Laboratory
Technologists 30 4.2% 3 14 17 $41.56
Pharmacy Technicians 550 35.5% 55 27 82 $19.80
Radiologic Technologists and
Technicians 190 17.9% 19 16 35 $40.04
Surgical Technologists 50 10.0% 5 9 14 $29.36
TOTAL: 1,210 18.6% 121 119 240 $33.16
Administrative
Medical Records and Health
Information Technicians 100 12.7% 10 16 26 $22.57
Medical Secretaries 1,030 23.6% 104 58 162 $20.39
Occupational Title 2010-2020 Difference
Percent
Increase New Jobs
Replace-ment Jobs Total Jobs
Median Hourly Healthcare Support Occupations
Dental Assistants 320 12.5% 31 54 85 $23.13
Home Health Aides 2,250 52.2% 225 56 281 $11.62
Massage Therapists 800 25.5% 80 51 131 $14.10
Medical Assistants 520 13.3% 52 60 112 $19.83
Nursing Aides, Orderlies, and
Attendants 810 13.2% 81 79 160 $17.48
Pharmacy Aides 260 42.6% 25 9 34 $11.66
TOTAL: 4,960 24.0% 494 309 803 $16.30
ALL HEALTH CARE OCCUPATIONS 10,620 19.24% 1,059 944 2,003 $28.23
Source: California Employment Development Department, Labor Market Information Division
2.9.2.i. Health Care Occupational Growth in San Francisco
Figure 12 shows all Health Care occupations during the same time period, with a consistent pattern of growth even throughout the recession. While growth is projected for all clusters and occupations for the next five years, there are a few occupations that are projected to have above-average growth between 2013 and 2018:
• Pharmacy workers will increase by 283 for both pharmacy technicians (220 jobs representing 22.4% growth) and pharmacy aides (63 jobs representing 18.69% growth). While the percentage of growth for these roles is higher than the average for health care, the number of jobs will most likely not create a large impact on the local region.
• On the other hand, entry-level patient care jobs are projected to increase less dramatically but with more overall positions created. Home health aide jobs will increase by 467 (17.5%) and nursing aides by 363 (8.9%)
• It is projected that there will be a continued need for registered nurses entering the workforce, with 296 new jobs created by 2018 (2.51% growth).
Figure 12: All Health Care Employment - 2008-2018
Source: QCEW Employees - EMSI 2013.2 Class of Worker
2008 2009 2010 2011 2012 2013 2014 2015 2016 2017 2018 Series1 29,817 30,597 30,907 31,330 31,942 32,617 33,099 33,546 33,964 34,367 34,727 27,000 28,000 29,000 30,000 31,000 32,000 33,000 34,000 35,000 36,000