Civil society and the state:
The interplay between cooperation and minimum wage
regulation
1Philippe Aghion2, Yann Algan3, and Pierre Cahuc4
April 3, 2009
1The authors thank for their very useful comments Daron Acemoglu, Marios Angeletos, Philippe Askenazy, Olivier Blanchard, Daniel Cohen, Jean-Michel Grandmont, Guy Laroque, Etienne Lehmann, Torsten Persson, Thomas Piketty, Guido Tabellini and Andrei Shleifer. We have bene…ted from many helpful comments from seminar participants at Bocconi, Boston College, CREST, Hebrew University, Mannheim University, MIT, Paris School of Economics, University of Florida and the IOG (Institution, Organization and Growth) group at the Canadian Institute for Advanced Research.
2Harvard University, paghion@fas.harvard.edu
3Sciences Po, yann.algan@sciences-po.org. Corresponding author: 197 bv Saint-Germain, 75007 Paris, France.
Abstract
In a cross-section of countries, the stringency of state regulation of minimum wages is strongly negatively correlated with union density and with the quality of labor relations. In this paper, we argue that these facts re‡ect di¤erent ways to regulate labor markets, either through the state or through the civil society, depending on the degree of cooperation in the economy. We rationalize these facts with a model of learning of the quality of labor relations. Distrustful labor relations lead to low unionization and high demand for direct state regulation of wages. In turn, state regulation crowds out the possibility for workers to experiment negotiation and learn about the potential cooperative nature of labor relations. This crowding out e¤ect can give rise to multiple equilibria: a “good” equilibrium characterized by cooperative labor relations and high union density, leading to low state regulation; and a “bad” equilibrium, characterized by distrustful labor relations, low union density and strong state regulation of the minimum wage.
JEL Classi…cation: J30, J50, K00.
1
Introduction
In a cross-section of countries, the stringency of government regulation of minimum wages is strongly negatively correlated with union density and with the quality of labor relations. Figure 1 illustrates the negative correlation between the stringency of minimum wage regulation and the quality of labor relations. The index of state regulation of minimum wages combines information on the level of the wage ‡oors, and the existence of a legal statutory minimum wage along with the number of derogations from the law, in 2000.1 The index of the quality of labor relations is constructed using the 1999 Global Competitiveness Reports, a survey sent out to thousands of executives with the following question: “Do you think that labor/employer relations are generally cooperative”. Figure 1 shows that pessimistic beliefs in cooperation are associated with stringent regulation of wages at the country level.2 In contrast, Figure 2 shows the strong positive
correlation between unionization rates and executives’beliefs in cooperative labor relations. In this paper, we argue that these facts re‡ect di¤erent ways to regulate labor markets: either through the state or through the civil society. These di¤erent regulations are associated with di¤erent qualities of labor relations. In Scandinavian countries, the degree of state regulation of labor market is low. Labor relations are higly cooperative and union density is high. Wage ‡oors are directly negotiated between unions and no statutory legal minimum wage exists. At the other extreme, state regulation is high in countries (in particular, France) where labor relations are distrustful and union density is low. This interpretation directly contradicts a common wisdom whereby anything that strengthens employees’ bargaining power, in particular higher rates of unionization, should be negatively perceived by employers and therefore deteriorate labor relations. Countries with low union density, such as France, are characterized by distrustful labor relations, whereas Nordic countries with their high unionization rates show widespread beliefs in cooperative labor relations.
Our paper documents, and tries to explain, these di¤erent labor market regulations and their relations with the quality of labor relations. We develop a model where trade unions might im-prove productivity by fosteringvoice rather thanexit in labor relations. The distinction between voice and exit, …rst proposed by Hirshman (1970) and then applied to trade unions by Freeman and Medo¤ (1984), stresses that people involved in a relation have essentially two possible re-sponses when they perceive that the relation is not working: they can exit (withdraw from the
1
This index of state regulation of minimum wages and data on union density are presented more precisely in section 3.
2
Evidence about the perceptions of the quality of labor relations across OECD countries are given each year by the Global Competitiveness Reports. Responses may vary from 1 for strong disagreement to 7 for strong agreement.The same pattern of correlation holds when we focus on workers’ perception of the quality of labor relations. This index is presented more precisely in Section 4.
relation), or they can voice (attempt to repair or improve the relation through communication). When productivity is increased by voice, employers and trade unions can bargain higher wages. Voice needs speci…c investments in the quality of labor relations to have a chance of success.3 One might think of these investments as the degree of workplace presence of unions to gather and transmit information between workers and managers, and to produce services. But the return of such investment is uncertain. It depends on the cooperative nature of the economy. Upon deciding whether to invest or not in the quality of labor relations, individuals do not know whether they live in a cooperative economy, where the investment will indeed improve the quality of labor relations, or if they live in a non-cooperative economy where such investment is pointless. In other word, the investment decision can be seen as a costly experimentation to improve labor relations and discover the true cooperative nature of the economy.4
In this framework, workers have less incentives to unionize and to pay the experimentation cost when they can rely on state regulation rather than on union’s strenght to get high wages (Checchi and Lucifora, 2002). Accordingly, the legal minimum wage reduces the incentives to learn about the scope for cooperation.5 Our model thus predicts that more stringent legal minimum wages increase the probability that the economy will fall in a low quality of labor relations and low unionization trap. The model also accounts for the reverse impact of the quality of labor relations and unionization rates on state regulation of minimum wages. When beliefs in cooperation are too low to sustain involvement in trade unions, there is a strong demand for direct state regulation of minimum wage, which in turn results in a higher minimum wage being set by the government in equilibrium. This interplay between state regulation and beliefs can lead to multiple-equilibria. The negative relation between state regulation of wages and cooperative beliefs can explain that countries can be stuck in an equilibrium with high minimum wage and low union density. At the other extreme, in countries where beliefs about cooperation are optimistic enough to sustain unions and negotiations, the demand for the legal minimum wage is lower. The low stringency of the minimum wage legislation provides incentives to experiment social dialogue by joining unions and thereby learning to implement cooperative labor relations. This experimentation in turn makes it possible for such countries to converge towards an equilibrium with low minimum wage, cooperative labor relations and high union
3
Addison and Bel…eld (2004) provide a survey on the empirical and theoretical literature on voice in labor relations. They conclude that improvements in productivity are not automatic, “these may be observed given an appropriate concatenation of circumstances: the expression of e¤ective voice, a constructive institutional response, and a cooperative industrial relations environment.”
4
Our model builds on seminal contributions by Piketty (1995), Benabou and Tirole (2006) and Alesina and Angeletos (2005) who use a Bayesian setting to explore the interactions between public policies and beliefs.
5
The e¤ects of state regulation of minimum wages on distrustful labor relationships in our model are similar to those identi…ed by the political science literature on centralized rules regulating the civil society (Ostrom, 2005).
density.
Although our paper highlights new interactions between state regulation and cooperation in the civil society, it follows a large literature. First, our representation of the building-up of cooperation as resulting from experimentation in collective action can explain the high degree of persistence in cooperative values found by Putnam (1993) and con…rmed by Guiso et al. (2007a). This explanation is complementary to the one proposed by Tabellini (2007b) where parents rationally choose which values to transmit to their o¤spring, and this choice is in turn in‡uenced by the quality of external enforcement of values. In Tabellini’s framework, values evolve gradually over time and if the quality of external enforcement is chosen under major-ity rule, there is hysteresis in the dynamics of values: adverse initial conditions, with weak enforcement, may lead to an equilibrium path where external enforcement remains weak and individual values discourage cooperation.6 This paper has also some connections with the liter-ature stressing the coevolution of policies and beliefs, along the lines of Piketty (1995), Alesina and Angeletos (2005) and Benabou and Tirole (2006). In Piketty (1995), multiple equilibria in beliefs and redistributive policies can originate from the heterogeneity in initial beliefs and the di¢ culty for individuals to learn the true cost and bene…ts of redistribution. Benabou and Tirole (2006) suggest that agents can deliberately bias their own perception of the truth. In Alesina and Angeletos (2005), multiplicity originates in the preference for fair economic outcomes.
Our paper is distinguished from this research in two central ways. First, we provide a framework that allows us to analyze the interplay between investment in cooperation within the civil society and state regulation. This framework allows us to explain why citizens with low level of cooperation within the civil society demand more state regulation, leading in turn to a crowding out of investment in cooperation within the civil society. Second we propose to illustrate this interaction with new empirical facts on state regulation of minimum wages, unionization behavior and the quality of labor relations.
The paper is organized as follows. Section 2 documents the relations between state regula-tion of minimum wages, union density and the quality of labor relaregula-tions across countries. This section also provides information about the in‡uence of history on beliefs in the quality of la-bor relations, which is the core element of our explanation of cross country di¤erences in lala-bor market regulations. Section 3 presents the model. Section 4 concludes.
6
See also Bisin and Verdier (2000), Lindbeck and Nyberg (2006) and Guiso et al. (2007b) for alternative formulation of transmission of beliefs and norms from parents to children.
Aus Aut Bg Cd Dk Fin Fra Ger Gre Ire Ita Jp Nth Nw Pt Sp Swd UkUsa 0 .2 .4 .6 St ate reg ul atio n o f m in imu m w ag e 3 4 5 6 7
Cooperative Labor Relations: Executives
R²=0.46
Figure 1: Correlation between State regulation of minimum wages and Executives’ beliefs in Cooperative labor relations. Source: ILO and OECD 1980-2003, and GRC 1999.
Aus Aut Bg Cd Dk Fin Fra Ger Gre Ire Ita Jp Nw Pt Sp Swd Uk Usa 0 20 40 60 80 Un io n de ns ity 3 4 5 6 7
Cooperative Labor Relations: Executives
R²=0.34
Figure 2: Correlation between union density and Executives’ beliefs in cooperative labor rela-tions. Source: OECD 1980-2003 and GRC 1999 database.
2
Basic facts on the quality of labor relations, unionization and
state regulation of wages
This section documents the existence of a negative relation between state regulation of minimum wages and union density across countries. We also show that this cross country heterogeneity in labor market regulation is associated with di¤erent beliefs in the quality of labor relations. Countries with distrustful labor relations tend to rely more on the state than on unions to regulate the labor market. We then document how beliefs in the quality of labor relations are in‡uenced by history and are associated with the demand for state regulation.
2.1 Cross-country correlations between cooperation and regulation of
mini-mum wages
2.1.1 Data
Our cross-country analysis is based on 22 OECD countries: Australia, Austria, Belgium, Canada, Czech Republic, Denmark, Finland, France, Germany, Greece, Hungary, Italy, Japan, Mexico, Netherlands, Norway, Poland, Portugal, Spain, Sweden, United Kingdom and the United States. The data covers the period 1980-2000.
State regulation of minimum wage
We measure the stringency of state regulation of minimum wages through a composite index. A …rst component of this index is the stringency of the minimum wage legislation, including the existence of legal minimum wages and the extent of potential derogations. A second component is the level of the minimum wage. Data are borrowed from the International Labor Organization (ILO) and from the OECD database. The ILO database provides detailed description of the di¤erent legal procedures to set minimum wages. The OECD database provides information concerning the level of real minimum wages and the ratio of minimum wages relatively to av-erage wages and median wages. The indicators are brie‡y described below, the full description being reported in Appendix C. The overall regulation index is simply the product of these two components.
Minimum wage legislation
We start by looking at the stringency of minimum wage legislations. This is measured by two main indicators: i ) minwage_legal measures the existence of a legal statutory minimum wage, and if not, the degree of coverage of the minimum wage set by collective bargaining;2 )
quali…-cations, regions, sectors or occupations. We scale each of these two indicators between zero and one, a higher value indicating more stringent law enforcement.
Figure 3 shows the …rst indicator, minwage_legal, which captures the existence of a legal statutory minimum wage and the extent to which minimum wages negotiated in collective bar-gaining are extended to all workers. The indicator minwage_legal equal to 1 if a statutory minimum wage exists, 0.5 if instead the wage ‡oor is directly bargained over by unions and then extended, and 0 otherwise. We report the average value of this indicator for the period 1980-2003. A high degree of cross-country variation shows up along this dimension. A …rst group of countries, namely Scandinavian countries, do not have any legal minimum wage, and no legal automatic extension of the negotiated wage ‡oors. Wage ‡oors are determined as part of the collective agreements between unions, and then they apply to workers covered by these collective agreements only. A similar group of countries, made up of Austria, Germany and Italy, do not have any legal statutory minimum wages. But legal dispositions stipulate to what extent the negotiated wage ‡oors should be extended to all other workers. Lastly, a legal statu-tory minimum wage is implemented by most Mediterranean and Anglo-Saxon countries. In the United States, this tradition dates back at least to the 1938 Fair Act while it is more recent in United Kingdom which established a legal minimum wage in 1999.
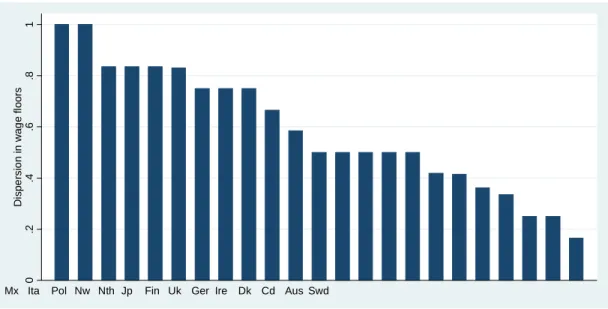
Figure 4 shows the indicator minwage_dispersion which measures the extent of dispersion and derogations in minimum wage setting. Minimum wage can di¤er by ages, quali…cations, regions, sectors or occupations. A more constraining minimum wage legislation is one that leaves little room for derogations and dispersion. We measure this characteristic by constructing two sub-indexes for age dispersion and other kind of derogations. The sub-indexes are ranked between 0 and 1, a higher score indicating that the country provides little derogation. The sub-index of dispersion across ages is constructed as follows. The score is equal to 1 if there is no provision at all for sub-minimum wages. It is equal to 0.5 if derogations are restricted to workers younger than 18 years old or if the derogation is less than half the o¢ cial minimum wage. And it takes on the value 0 if the derogations can be extended to people older than 18 years or/and if the sub-minimum wages are lower than half the standard wage ‡oor. The sub-index for other derogations equal 0 if the minimum wage is allowed to di¤er along at least the three dimensions of regions, sectors and occupations, 0.33 if there are two types of distinctions, 0.67 for one type of distinction, and 1 if no dispersion at all is allowed. The indicatorminwage_dispersion is the average of these two sub-indexes.
Figure 4 shows a great deal of cross-country heterogeneity in theminwage_dispersion indi-cator over the period 1980-2003. Countries like France leaves no scope for derogations based on age, occupation, or industry. Other countries allow for subminimum wages. Thus, special wage
0 .2 .4 .6 .8 1 Le ga l vers u s n eg oci ated wa ge flo ors
Usa Sp Pt Pol Nth Mx Jp Hg Gre Fra Czr Cd Aus Ita Ger Bg Aut Uk Ire Swd Nw Fin Dk
Figure 3: Legal statutory minimum wages or the degree of extension of negotiated wage ‡oors. Period: 1980-2003.
‡oors extend up to age 24 in Sweden and to age 22 years in the Netherlands. The Netherlands accepts a reduction up to 40 percent of standard minimum wage at 17 years old. Nordic coun-tries let unions negotiate the wage ‡oor at the industry level, without any automatic extension to other parts of the economy.
Henceforth, we measure the stringency of the overall minimum wage legislation using the composite indicator minwage_legislation, obtained by multiplying the indicator of legal de-termination of the minimum wage, minwage_legal, by the indicator of potential dispersion, minwage_dispersion.
Minimum wage levels
We measure the minimum wage level by the indexminwage_level de…ned as the ratio of the minimum wage over the median wage in the economy. Minimum wage levels are provided by the OECD database for all years since the mid-1970s. The OECD only reports countries which have a legal statutory minimum wage. We thus complete these data by using Neumark and Wascher (2004)’s indicators for other countries. These data cover two time periods, the late 1970s and the 2000s. The exact de…nition of the minimum wage variables used to calculate the real value of national minimum wages, is reported in the Appendix. As mentioned above, minimum wage levels display some degree of dispersion within most countries. The OECD database and Neumark and Washer reports the average value for full-time minimum wage workers who are
0 .2 .4 .6 .8 1 Di spe rs io n in wag e fl oors
Hg Fra Pt Gre Aut Usa Sp Czr Bg Mx Ita Pol Nw Nth Jp Fin Uk Ger Ire Dk Cd Aus Swd
Figure 4: Degree of dispersion in wage ‡oors by ages, quali…cations, regions, sectors or occupa-tions. Period 1980-2003.
not subject to any derogations, as a percentage of average wages of full-time workers in the corresponding sector (see Immervoll, 2007, and Neumark and Washer, 2004).
The overall measure of minimum wage regulation used in the following tables and …gures, denoted byminwage, is simply the productminwage_legislation*minwage_level.
Data on cooperation: union density and the quality of labor relations
We measure the perceived level of cooperation in the labor market by the quality of the relation between workers and managers. We …rst use the Global Competitiveness Reports, a survey sent out to thousands of executives each year across more than 50 countries. Among other questions, executives are asked to respond to the following statement: “Labor/employer relations are generally cooperative”. Responses may vary from 1 for strong disagreement to 7 for strong agreement. One may of course worry about this only re‡ecting the perception of executives. We thus use additional information from the International Social Survey program 1999 (ISSP), which asks similar questions but for all categories of citizens. The question is the following: “In all countries there are di¤ erences or even con‡icts between di¤ erent social groups. In your opinion, how much con‡ict is there between management and workers in your country?”Responses are equal to 1 for “very strong con‡ict”, 2 for “strong con‡ict”, 3 for “not very strong con‡ict”, and 4 for “no con‡ict at all”. We construct a variable equal to 1 if the
respondent chooses answer 3 or answer 4, and zero otherwise, to capture the share of workers who believe in cooperative labor relations in each country.
We measure workers’involvement in unions by using the unionization data provided by the OECD at a yearly frequency since the 1960s. We also use data from Boeri et al. (2003) to track back the evolution of unionization rates since the early 1950s. We should be clear at this point that our primary focus is on workers’ propensity to cooperate and to group into associations rather than rely on state intervention to guarantee their wage. In this regard, union density appears to be a more relevant indicator than union coverage rates. Obviously, the coverage indicator provides information regarding the bargaining power of unions, and as a matter of fact the role of unions in regulating wages becomes fairly high in some countries due to the automatic extension of negotiated wages to all sectors, even if the union density rate is really low. However the coverage indicator also captures the extent of state intervention in setting wages, since negotiated wages are extended by law to the di¤erent sectors of the economy. Thus this indicator does not truly re‡ect workers’ preference for direct negotiations over the alternative of relying on state intervention.
2.1.2 Correlation between state regulation of minimum wage and union density Figure 5 depicts the cross-country correlation between workers’involvement in unions and the degree of state regulation of wage ‡oors in OECD countries on average over the period 1980-2003. The vertical axis shows the average union densities by country over that period. Nordic countries display the highest unionization rates over that period, with a 82 percent rate in Sweden and a 77 percent rate in Denmark. Countries such as Austria and Germany fall in the middle part of the picture with union density rates at around 40 percent. Anglo-Saxon countries like United-Kingdom or Canada, belong to the same middle group. And Mediterranean countries show the lowest unionization rates, with less than 10 % in France or Spain. Note that Italy is a clear outlier, with a unionization rate close to 40 %.
The horizontal axis shows the compositeminwage index measuring state regulation of min-imum wage. As we can see on Figure 5, the correlation between the composite index of wage regulation and unionization rates is strongly negative. Nordic countries which have very high unionization rates also display the weakest state regulations. There is no legal minimum wage in these countries: wage ‡oors are negotiated at industry level, and there is a substantial amount of dispersion in wage ‡oors across regions, industries, quali…cations and ages. The same pic-ture holds for Continental countries like Austria and Germany, which combine relatively high union density rates and the absence of statutory minimum wage. In contrast, Mediterranean countries display the highest level of state intervention to set minimum wages. Countries like
Aut Bg Cd Czr Dk Fin Fra Ger Gre Hg Ire Ita Jp Mx Nth Nw Pol Pt Sp Swd Uk Usa -20 0 20 40 60 80 Un io ni zat io n r ate (% ) 0 .2 .4 .6
State regulation of minimum wages
R²=0.55
Figure 5: Union density and the index of state regulation of minimum wage. The index includes the stringency of the legislation and of the level of minimum wages. Period 1980-2003. Source: OECD and ILO.
France not only set minimum wages by law but they also limit the scope for derogations and for direct negotiations by social partners. The one clear exception among Mediterranean countries is Italy. This country does not have a statutory minimum wage, hence its lower ranking in terms of our index of state regulation. However, in Italy, wage ‡oors negotiated at the industry level are automatically extended to other industries. Finally, we see noticeable di¤erences within the group of Anglo-Saxon countries. Those with high index of state regulation like the United States are also characterized by low union densities. In contrast, Great-Britain appears to have a relatively high union density and a lower index of state regulation, which in turn results both, from unions being so powerful prior to the 1980s and the fact that wage ‡oors were negotiated by wage councils before 1993.
We explore this correlation pattern further by running OLS regressions between unionization rates and our index of state regulation of the minimum wage. To maximize the number of observations, we run this estimation over three time periods, computing the average of the
composite index respectively over the periods 1980-84, 1990-94 and 2000-2003. We also look at the correlation between unionization rates and the two sub-indexes which capture respectively the existence of a legal statutory minimum wage and the degree of dispersion in minimum wages. We evaluate the correlations between unionization and the two sub-indexes taken separately, and between unionization and the interaction terms between these sub-indexes and the indicator measuring the level of minimum wages.
Table 1- Column (1) reports the cross-country estimated correlation between unionization rates and the extent of state regulation of minimum wage over the three period 1980, 1990 and 2003. The sample is unbalanced, with fewer 8 observations for the period 1980. This correlation is negative, and statistically signi…cant at the 1 percent level. Almost 45 percent of the cross-country variation observed in the state regulation index is associated with di¤erences in unionization rates. Table 1- Columns (2)-(5) show that the same negative correlation pattern holds when we look at the two sub-indexes, or when we combine these sub-indexes with the level of minimum wage. Overall, this …rst table suggests a strong negative correlation between unionization rates and the extent to which the state strictly regulates minimum wage.
The negative correlation between union density and state regulation of minimum wage also appears to hold over the time period 1980-2003 within countries. Countries which have experi-enced the sharpest decline in union densities are also those that have tightened state regulation of wage ‡oors the most. A striking example is the United Kingdom where wage ‡oors used to be set by unions before the country embraced a statutory minimum wage in 1999 to o¤set the decline of union bargaining power. What happened is that the unionization rate had fallen from 50 % in 1980 to less than 30% in the late 1990’s, in part as a result of Margaret Thatcher’s crackdown on strikes in 1982. Meanwhile, the political pressure from the workers to get a legal minimum wage has gained momentum, leading Tony Blair to introduce a statutory minimum wage. Of course the negative relation can run both ways. It might be the case that union densities have mainly increased in countries where statutory minimum wages are absent, like Scandinavian countries, because workers cannot rely on state regulation and have strong incen-tives to coordinate themselves to defend their wages. Conversely, the decline in union densities could have triggered changes in minimum wage legislations.
Table 2 reports the within correlation between the evolution of the composite index of state regulation of minimum wages and the evolution of union density. We focus on two time periods, the early 1980s and the early 2000s, to allow for enough time variation. We focus on the same set of countries for the period 1980 and 2000, leading to select 18 countries for each period (data are missing for Cezch Republic, Hungary, Poland and Ireland in 1980). The regressions control for country …xed e¤ects and linear time trends.
Table 2 - Column (1) reports the within correlation between contemporaneous values of unionization rate and state regulation of minimum wage. A strong negative correlation shows up, the e¤ect being statistically signi…cant at the one percent level. Table 2 - Column (2) reports the correlation between the index of state regulation of minimum wage and the lagged value of union density. When looking at state regulation in the early 1980’s, we use union density in the early 1970s (1970-74). The estimated coe¢ cient is strongly negative and statistically signi…cant at one percent level. Lower unions rates during the 70’s are associated with more stringent minimum wage regulation by the state a decade or two later. This result might account for the rising political support in favor of an increase in statutory minimum wages in countries where the bargaining power of unions is declining.
Table 1: Cross-country correlation between state regulation of minimum wage and union density: OECD countries 1980-2003. OLS.
Dependent variable State regulation of minimum wages
Composite index (1) Legal (2) Dispersion (3) Legal *Level (4) Dispersion *Level (5) Union density -.518 *** (.083) -1.568*** (.156) -.587*** (.134) -.606*** (.099) -.214*** (.099) R2 .441 .658 .262 .442 .102 Observations 58 58 58 58 58
Table 2: Time variations in unionization rates and state regulation of minimum wages. OECD countries: 1980-2003. OLS
Dependent variable State regulation of minimum wages (Composite index) (1) (3) Union density -1.089 *** (.312) Union density (-1) -0.528 ** (.262)
Country …xed e¤ects Yes*** Yes***
Time dummies Yes*** Yes***
Observations 36 36
2.1.3 State regulation of minimum wages and the quality of labor relations
The negative relation between state regulation and union density is associated with di¤erent beliefs in the quality of labor relations. Figure 1 illustrates the negative correlation between the stringency of minimum wage regulations and executives’beliefs in cooperative labor
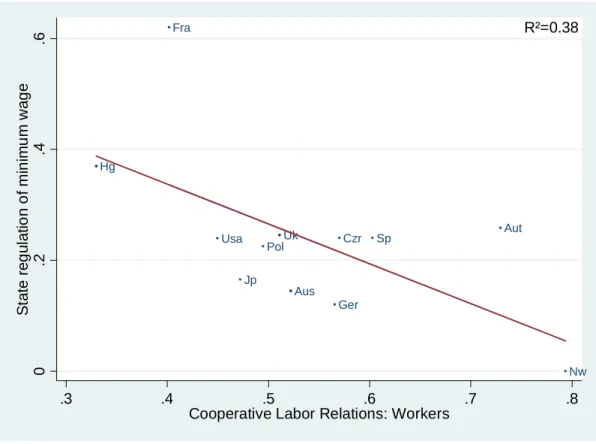
rela-tions. The index of perceived cooperation on the labor market is constructed using the 1999 Global Competitiveness Reports, a survey sent out to thousands of executives each year with the following question: “Do you think that labor/employer relations are generally cooperative”. Responses may vary from 1 for strong disagreement to 7 for strong agreement. State interven-tion is then measured by the state’s propensity to directly regulate minimum wages instead of letting wage ‡oors be negotiated between employers and employees’unions. Figure 6 shows that the same correlation pattern holds when we look at the ISSP index of workers’perceived quality of labor relations.
Figure 1, 6 and 2 show that Scandinavian countries are characterized by a low level of state intervention in the regulation of minimum wage. Wage ‡oors are directly negotiated between unions and no statutory legal minimum wage exists. This characteristic is associated with highly cooperative labor relations. At the other extreme, state intervention is high in countries (in particular, France) where labor relations are distrustful. Another interesting fact about labor markets comes out of Figure 2. Indeed this …gure reports a strong positive correlation between the executives’ beliefs in cooperative labor relations and union membership. This directly contradicts a common wisdom whereby anything that strengthens employees’bargaining power in …rms, in particular higher rates of unionization, should be negatively perceived by employers and therefore increase their distrust vis-a-vis workers. Countries with low union density, such as France, are characterized by distrustful labor relations, whereas Nordic countries with their high unionization rates show widespread beliefs in cooperative labor relations.
Table 3 presents the results of the associated OLS regression. Column 1 reports the positive correlation between the quality of labor relation and union density in 2000. We measure the degree of cooperation by the GCR index which provides more observations, even if the correlation pattern is lower than that obtained with the ISSP index. Column 1 shows that the R2 is 0.33, and union density is statistically signi…cant at the one percent level. The second column shows that the correlation between the quality of labor relation and union density remains statistically signi…cant at the …ve percent level when one controls for the unemployment rate and traditional labor market institutions taken from Nickell et al. (2001). Columns 3 and 4 report the strong negative correlation between the GCR index of the quality of labor relation and our index of state regulation of the minimum wage in the 2000s. The negative correlation is highly statistically signi…cant at the one percent level even when one controls for the unemployment rate and other labor market institutions in Column 4, none of which appear to be statistically signi…cant.
Aus Aut Czr Fra Ger Hg Jp Nw PolUk Sp Usa 0 .2 .4 .6 St ate reg ul atio n o f m in imu m w ag e .3 .4 .5 .6 .7 .8
Cooperative Labor Relations: Workers
R²=0.38
Figure 6: Correlation between state regulation of minimum wages and workers’beliefs in coop-erative labor relations. Source: ILO, OECD, and ISSP 1999 database.
Table 3: Quality of labor relations in OECD countries: 2000s. OLS estimates
Dependent variable Quality of labor relation
(1) (2) (3) (4) Union density 2.091 *** (.716) 2.140** (.912) State regulation of minimum wages -3.339*** (.876) -2.821*** (.827) Unemployment rate -7.301 * (3.802) -12.625** (4.170) Replacement rate .555 (.941) .422 (.860) Bene…t duration -.466 (.570) .235 (.437) Employment protection -.098 (.289) .152 (.259) Tax wedge -1.810 (1.682) -.366 (1.052) R2 .34 .56 .46 .74 Observations 18 18 18 18
2.2 Beliefs in the quality of labor relations and the demand for state
regula-tion of wages
The correlation between distrustful labor relations and the extent of state regulation of wages holds not only in the aggregate, but also in individual attitudes. We …rst document that beliefs in cooperation are in‡uenced by past history. We then show how these beliefs are associated with the demand for state regulation of the labor market.
2.2.1 Beliefs in cooperative labor relations
We document how beliefs in cooperative labor relations are shaped by past history. To analyze this time-dependence of beliefs we focus on the attitudes of US-born immigrants. We look at the correlation between their beliefs in the quality of labor relations and the features of their country of origin likely to shape their beliefs. We use the General Social Survey which provides information on both attitudes towards the quality of labor relations and the country of origin of the ancestors. The GSS covers the period 1972-2004 and provides information on the birth place and the country of origin of the respondent’s forebears since 1977. The GSS variable for the country of origin reads as follows: “From what countries or part of the world did your ancestors come?”. Origins cover nearly all European countries. We focus on US-born immigrants and
select country of origins with at least 15 observations.7 Beliefs in cooperative labor relations of US immigrants are measured by two main questions. The …rst one reads : “There will always be con‡ict between management and workers because they are really on opposite sides”. The answers ranges from 1: “Strongly agree”, 2: “Agree”, 3: “Disagree”, 4: “Strongly disagree”. We order the answers to provide an index ofDistrustful labor relations. The second question, more general, deals with the level of con…dence in business: “Would you say you have a great deal of con…dence, only some con…dence, or hardly any con…dence at all in companies?”. The answers range from 1: “A great deal”, 2: “Only some” to 3: “Hardly any”. This question provides an index ofDistrust in companies
Figures 7 and 9 show the correlation between beliefs in cooperation of US-immigrants and the quality of labor relations in the home country. We measure the conditional average of US-immigrants’beliefs by running individual ordered probit regressions controlling for age, edu-cation, employment status, gender, level of income and country of origin …xed e¤ects. Denmark is considered as the reference country of origin. Standard errors are clustered at the country of origin level. The two Figures show a substantial heterogeneity in the beliefs in cooperative labor relations depending on the country of origin. Relative to US-immigrants with Danish origins, immigrants from Africa, Latin America, Mediterranean countries and most Eastern European countries have a much higher level of distrust in cooperative labor relations. The gap in distrust is lower among immigrants form other Nordic countries and from UK or Austria. These beliefs are fairly persistent. All the coe¢ cient associated with the country of origins are statistically signi…cant at the 1 percent level (not reported here). Besides these beliefs are strongly correlated with the quality of labor relations in the home country. Between 40 percent and 50 percent of the heterogeneity in US-immigrants’beliefs is associated with di¤erences in the quality of labor relations in the home country.
Table 4 - Row I reports the corresponding ordered probit estimates when we replace the country of origin dummies by the index of the quality of labor relations in the source country. We still control for age, education, employment status, gender, level of income. Standard errors are clustered at the country of origin level. The correlation between US-immigrant beliefs in the quality of labor relations of the US-born immigrants and the quality of labor relations in the home country is statistically signi…cant at the one percent. This correlations suggests a strong inertia of beliefs, in‡uenced by a common history.
Table 4 - Row II explores further the impact of past regulation in the home country on 7
This leaves us with a a maximum of 16 country of origins depending on the GSS question: Austria, Belgium, Canada, Czech Republic, Denmark, France, Germany, Ireland, Italy, Mexico, Netherlands, Norway, Poland, Spain, Sweden and United Kingdom
contemporaneous beliefs of US-immigrants. Since minimum wage legislation and the extension of organized labor might be too recent to be related to the attitudes of US-born immigrants, we focus on broader historical variables on state regulation and industrial relations. We rely on Crouch’s analysis of the attitudes of the states towards unions in Europe during the 19th century.8 Crouch documents the evolution of distrustful labor relation depending on the original attitudes of the state towards unions to settle dispute and regulate labor markets.9 Crouch clas-si…es states in three categories. The …rst category comprises states that were most hostile to the development of unions and consequently more prone to directly regulate labor market and settle disputes through centralized decisions. This group includes the main catholic strongholds in Eu-rope, namely France, Italy, Spain and Portugal. Crouch account for this fact by stressing that in these countries the central government needed to assert its authority over the Catholic church and to confront all forms of organized interests, including worker organizations. The second category comprises …ve countries where the state was rather neutral vis-a-vis labor organization and would consequently let them directly with …rms. This is the case of Belgium, Denmark, Norway, Sweden, Finland, UK and Ireland. Finally, the third category consists of countries where the State would encourage union involvement in the regulation of labor markets. This category includes Austria, Germany, Netherlands, Switzerland. In particular, the Austrian and German governments were …rst to set up elected workers commissions to run pensions and social insurance schemes as of the 1880s.
Table 4 - Row II shows that the probability to distrust companies, or to think that managers and workers will always be in con‡ict, decreases when US-immigrants come from country with neutral or supportive state in favor of unions. Relative to hostile state, the e¤ect is statistically signi…cant at the one (ten) percent when individuals come from country which used to have supportive (neutral) state in favor of unions at the end of the 19th century.
8Blanchard and Philippon (2006) show that these initial attitudes of the states towards union might also
explain current unemployment rates.
9Crouch stressed that labor relations were fairly hostile in Denmark in the 19th century, and the Great
Lock-Out of 1898 is probably the single biggest industrial dispute in Europe over the 19th century. However this dispute led to a social pact between organized labor and …rms, whereby unions would recognize the private property of …rms by capitalists, and in exchange, capitalists and workers unions would negotiate wages directly on a bilateral basis, without any state intervention. Ever since, the unionization rate has steadily risen in Denmark and this country displays one of the highest quality of labor relation in the 2000s. The same picture holds for Belgium, Austria, Germany, United Kingdom and Sweden. According to Crouch, labor relations in these countries used to be highly con‡ictual. But precisely this encouraged employers and the state to design institutions aimed at involving unions in the regulation of labor markets in order to contain social disruption. This evolution pattern departs from that of France where central governments, whether from the right or from the left, have remained traditionally suspicious vis-a-vis unions and have therefore privileged centralized negotiations at the government level, for example during the Front Populaire in 1936 or more recently with the Grenelles Agreement in the aftermath of May 1968.
Cd Czr Dk Fra Ger Ire Ita Mx Nth Nw Rus Sp Swd Uk -.5 0 .5 Man ag ers an d Wo rk ers wi ll al wa ys b e in con fl ict : US 4 5 6
Quality of labor relationship in source country
R²=0.40
Figure 7: Correlation between US-immigrants’beliefs in labor con‡icts and the quality of labor relationships in the home country. Source: GSS 1977-2006 and GCR 1999.
Cd Czr Dk Fra Ger Ire Ita Mx Nth Nw Sp Swd Uk -.5 0 .5 Man ag ers an d Wo rk ers wi ll al wa ys b e in con fl ict : US 3 4 5 6 7
Quality of labor relationship in source country
R²=0.51
Figure 8: Correlation between US-immigrants’beliefs in labor con‡icts and the quality of labor relationships in the home country. Source: GSS 1977-2006 and GCR 1999.
Aut Bg Cd Czr Dk Fra Ger Ire Ita Mx Nth Nw Pol Rus Sp Swd Switz Uk -. 05 0 .05 .1 .15 Di stru st in co mpa ni es: US -i mm ig ran ts 4 5 6
Quality of labor relationship in source country
R²=0.50
Figure 9: Correlation between US-immigrants’ distrust in companies and the quality of labor relationships in the home country. Source: GSS 1977-2006 and GCR 1999.
Aut Bg Cd Czr Dk Fra Ger Ire Ita Mx Nth Nw Pol Sp Swd Uk 0 .05 .1 .15 Di stru st in co mpa ni es: US -i mm ig ran ts 3 4 5 6 7
Quality of labor relationship in source country
R²=0.40
Figure 10: Correlation between US-immigrants’distrust in companies and the quality of labor relationships in the home country. Source: GSS 1977-2006 and GCR 1999.
Table 4: Impact of history on beliefs in cooperative labor relationships: Ordered probit estimates on US-immigrants
Distrust companies (1)
Management and Workers will always be in con‡ict (2) Quality of labor relations
in home country - (I)
-.058*** (.013) -.200*** ( .053) N 18164 836 R2 .081 .082
History of state regulation of organized labor in home country
(II)
Hostile Reference Reference
Neutral -.049 * ( .030) -.182* ( .102) Supportive -.099 *** ( .019) -.250*** ( .098) N 15581 708 R2 .022 .085
Ordered probit e¤ects with robust standard error GSS : ***:1%, **: 5%, *: 10 Additional controls: gender, age, education, income category
2.2.2 Beliefs in cooperative labor relations and the demand for regulation
We show that the demand for wage regulation is associated with low beliefs in cooperative labor relations. We still focus on US-immigrants to get rid of reverse causality from di¤erences in institutional environment on the demand for labor market regulation.
Figure 11 documents the demand for wage regulation of US-immigrants depending on the country of origin of the ancestors. The question reads: “Here are some things the government might do for the economy. Please show which actions you are in favor of and which you are against: control wages by law?”. The answers ranges from 1, for strongly disagree, to 5 for strongly agree. Figure 11 shows, on the vertical axis the average answer conditional on age, gender, education, employment status and income for each country of origin. The conditional average corresponds the coe¢ cient of the country …xed e¤ect in the ordered probit regression on this question. Denmark is taken as a reference. A strong heterogeneity shows up by country of origins of US-immigrants. Descendants from Nordic countries, Anglo-Saxon countries and Italy tend to be less in favor of wages regulation by law compared to descendants from France or Spain. Figure 11 also shows that this heterogeneity in demand for wage regulation is negatively correlated with the quality of labor relations in the source country.
Aut Cd Czr Dk Fra Ger Ire Ita Mx Nth Nw Sp Swd Switz Uk -.1 0 .1 .2 .3 .4 Co ntr ol w ag es by la w: US -i mm ig ran ts 4 5 6
Quality of labor relationship in source country
R²=0.27
Figure 11: Correlation between US-immigrants’ demand for wage regulation by law and the quality of labor relationships in the home country. Source: GSS 1977-2006 and GCR 1999.
US-immigrants and their beliefs in cooperative labor relations, as measured by their level of con…dence in business. We run ordered probit regression controlling for the same set of individual controls as before and for country of origin …xed e¤ects. Column (1) shows that the propensity to call for wage regulation by law decreases with the level of con…dence in business, the e¤ect being statistically signi…cant at the 1 percent level.
Table 5 - Columns (2) - (4) report the correlation between the demand for regulation of US-immigrants and quantitative indicators of institutions in the home country. Column (2) reports the correlation between the probability for US-immigrants to call for a state regulation of wages and the indicator of labor quality in the source country. The correlation is positive and statistically signi…cant at the 5 percent level. Column (3) reports the correlation with the stringency of state regulation of minimum wage in the home country, based on our synthetic index presented in section 2. The relations is positive and statistically signi…cant at the 1 percent level. Conversely, Column (4) shows a negative correlation between the demand for wage regulation and union density in the home country, averaged over the period 1960-2000.
Table 5: Demand for wage regulation by law - Ordered probit estimates on US immigrants Government should control wages by law
(1) (2) (3) (4)
Con…dence in Business US-immigrants
-.198*** (.062) Quality of labor relations
in home country - Index GCR
-.117***
(.044) State regulation of minimum
wage in home country
.387*** (.123) Union density in home country -.368* (.202) N 1191 2087 1777 2087 R2 .042 .038 .043 .036
Ordered probit e¤ects with robust standard error GSS : ***:1%, **: 5%, *: 10 Additional controls: gender, age, education, income category
3
The model
We have documented that the stringency of government regulation of minimum wages is strongly negatively correlated with union density and with the quality of labor relations. This relations holds not only in cross-section of countries but also at the individual level. Individual beliefs in cooperative labor relations are history-dependent: they are shaped by past regulation on the labor market. In turn, pessimistic beliefs about the quality of labor relations are associated with higher demand for state regulation. This section seeks to provide a model to rationalize these facts.
3.1 Basic framework
We consider an in…nite horizon economy populated by a continuum of measure one of risk neutral individuals, each of whom lives for one period. There are two non storable goods in the economy: a numeraire good and labor. Each individual is endowed with one unit of labor. Individuals get utility from their consumption of the numeraire good and they di¤er in productive ability. In each period t; the proportion of individuals who produce less than y; y 0; with one unit of labor, is de…ned by the cumulative distribution functionG(y):For simplicity, we shall take the
Gdistribution to be uniform on the interval [0;1]:
Individuals may decide to join a trade union. The utility of an individual paid wage wt in
periodt; is just equal towt if the individual is not unionized and to vt=wt(1 c)
if she is unionized. The parameterc2(0;1)is introduced to represent the cost of unionization, equal tocwt:The assumption that the cost of unionization is proportional to the wage has many
empirical justi…cations. In most countries, the cost of membership is a fraction of the wage. The opportunity cost of the time that workers devote to union activity increases with their wage. Employers may also slow the carrer of union members. For the employee, the cost of this behavior of the employer should increase with the wage.
Workers face a monopsonistic representative …rm. This assumption is made for simplicity. It is the simplest way to represent monopsonistic labor markets, where workers are paid below their marginal productivity. This property can be derived from many models, in particular from the standard search and matching model which shows that search and matching cost induce wages below marginal productivity (see e.g. Pissarides, 2000). In our framework, the monopsonistic …rm makes take-it-or-leave-it o¤ers to non unionized workers. Consequently, non unionized workers cannot get more than the minimum wage wt 0 set by the government if
their productivityy is higher than the minimum wage, and they get no job o¤er from the …rm otherwise.
Unionization induces collective bargaining over wages and over other dimensions of labor relations. Following Hirschman (1970) and Freeman and Medo¤ (1984) we consider that unionism provides a “voice” which can improve productivity. Namely, the production of the workers increases fromyin the absence of trade union to(1 + )y; >0;when the workers are unionized and when voice succeeds. But voice can also fail. In that case, productivity is not improved by unionization. We assume that the probability that voice succeeds depends on the quality of labor relations, which can be either “high” or “low”. The quality of labor relations is not observable. Workers only observe whether voice succeeds or fails.10 In every period, voice can either be: (i) a success, in which case the productivity ofall type-y unionized workers is increased by a factor
(1 + ); (ii) or a failure, in which case productivity is not increased by trade unions. More precisely, in each periodt; the probability that voice succeeds or fails is:
Pr(voice succeeds)= 1 " if quality of labor relations is high
" if quality of labor relations is low
Pr(voice fails)= 1 " if quality of labor relations is low
" if quality of labor relations is high where" <1=2.11
1 0
For the sake of simplicity, it is assumed that workers are able to extract the same information independently of the number of employees whose wage is bargained over by the trade union. Alternatively, one could assume that workers observe the outcome of negotiation with a probability that increases with the number of employees whose wage is bargained over in the period. Our results are robust to introducing this additional feature to the model.
Unionization also provides bargaining power to workers. Unionized workers can negotiate their wage once they observe whether voice has succeeded. They get a share 2 (0;1] of the surplus that they generate. If a wage agreement is not reached, workers are paid the minimum wage and voice does not work any more. Accordingly, when voice succeeds, the …rm gets pro…ts per worker equal toy(1 + ) wt if an agreement is reached, and y wt in the opposite case.
Workers getwt(1 c)if wage negotiation succeeds andwt(1 c)if it fails. Surplus sharing yields
the wage12
wt(y) =wt+ y;
where = =[1 c(1 )]>0. It turns out that the negotiated wage is equal to the minimum wage plus a share of the increase in productivity generated by voice when voice succeeds. When voice fails, wage bargaining yields the minimum wagewtbecause unionization does not generate
any positive surplus.
Investment in cooperation and the dynamics of beliefs
The union can invest to improve the quality of labor relations.13 We denote the union’s
speci…c investment by it: For simplicity, assume that it can take only two values: it = 0 or it = I >0:The investment is publicly observable. When it = 0; the quality of labor relations
is necessarily low. Whenit =I; the quality of labor relations is high if the true nature of the
economy is cooperative, otherwise, the quality remains low.
Upon deciding whether or not to invest in the quality of labor relations, unionized workers do not know whether they live in a cooperative economy where the investment will indeed lead to high quality of labor relations or if they live in a non-cooperative economy where such investment is pointless. In other words, the investment decision can be seen as a costly experimentation to improve labor relations and discover the true cooperative nature of the economy.
Lete2 fC; Ngdenote the type of the economy: C if the economy is cooperative andN if it
that the quality of labor relation is not perfect. That it may succeed with positive probability"when the quality of labor relation is low, re‡ects the fact that workers may sometime overcome the non-cooperative nature of the employer and still manage to strike a good deal.
1 2Note that the wages negotiated by the trade union depend upon workers’productivity, whereas the minimum
wage is independent of productivity. Here we simply capture the idea that trade unions have a better information about workers’productivity than the government.
1 3
Appendix B provides evidence on the e¤ect of union’s investment on the quality of labor relations. Union’s investment in cooperation is measured in two ways, following Checchi and Lucifora (2002): the degree of workplace presence of unions and the degree of coordination and centralization of union’s decisions. Figure 13 reports the correlation between the indicator of workplace presence of unions and the perceived quality of labor relations measured by theGlobal Competitiveness Reports 1999. Figure 14 reports the same correlation pattern between the quality of labor relations and the degree of coordination and centralization of negotiations between trade unions. In both cases, steady positive correlations show up, suggesting that the quality of labor cooperation is strongly associated with investment in cooperation by unions.
is non cooperative. We let
Pr
t=0(e=C) =q0
denote workers’prior beliefs as to the cooperative nature of the economy at date zero.
A history ht(n; s) at the beginning of periodt consists in n t past negotiations (between
date 0 and date t 1) over which unions have invested in cooperation, s n of which have been successful, and n s have been unsuccessful. The number n of periods with negotiation and positive investment, may be smaller thantfor two reasons. First, the trade union does not necessarily invest in every period. Second, there is no negotiation in the periods where nobody is unionized.
From Bayes’rule, the probability that the economy is cooperative in periodtis:
qt= Pr [e=Cjht(n; s)] =
(1 ")s"n sq0 (1 ")s"n sq
0+ (1 ")n s"s(1 q0)
: (1)
Finally, using the fact that Pr [e=Cjht(n; s)] = 1 Pr [e=Njht(n; s)]; we can compute
the probability that voice succeeds in period twhen there have been n previous periods with investment and negotiations,sof which have been successful, namely:
p(qt; it) =
"+ (1 2")qt ifit=I " ifit= 0.
(2) In this framework, by unionizing and by investing in the quality of labor relations, workers manage both to obtain wage increases and also to generate information about the possibility to increase the quality of labor relations. In periods in which the trade union invests and some workers are unionized, the outcome of the negotiation reveals information on the type of economy. This in turn enables workers of the future generation to update their beliefs. When there is no investment or when nobody is unionized in period t, workers of generation t+ 1
cannot update their beliefs.
Bayes’rule immediately implies a positive correlation between beliefs in successive periods as stated by:
Lemma 1: In periods where the trade union invests I;the belief p(qt; I)that bargaining succeeds
in period t is non-decreasing with p(qt 1; it 1):
Proof: From the de…nition (2) of beliefs we know thatp(qt; I)increases withqt= Pr [e=Cjht(n; s)]:
Let
wheren0=n;or n0 =n 1;and s0 =sors0=s 1:We have: 1=a = 1 + (1 q0 q0 )(1 " " ) n 2s; 1=b = 1 + (1 q0 q0 )(1 " " ) n0 2s0 : Thus 1=a= (1=b) 1 " " n n0 2(s s0) + 1 1 " " n n0 2(s s0) :
In particular(1=a) and(1=b) are positively correlated, and thus so areaand b:QED. Timing
At the beginning of period t = 0; nature determines once for all the type of economy e 2 fC; Ng which is not observable. Then, in each period t 0, the sequence of decisions can be described as follows:14
1. The trade union decides whether or not to invest in the quality of labor relations. 2. Individuals vote to elect a government that sets a minimum wagewt 0:
3. Workers decide whether or not to join the trade union.
4. Wages are set by employers for non unionized workers and by wage negotiation for union-ized workers.
We …rst analyze the outcome of the wage negotiation and the decision to invest in labor relations and to unionize when the minimum wage is exogenous. This …rst step will allow us to shed light on the relations between the minimum wage, unionization and investment behaviors and beliefs. Then, we endogeneize the minimum wage by making it a choice variable by the elected government.
3.2 The e¤ect of minimum wage on the dynamics of cooperation and beliefs
Unionization behavior and investment in labor relations are in‡uenced by beliefs about the e¢ ciency of the investment and by the minimum wage. Beliefs are themselves in‡uenced by past unionization and investment experience. In this section, we …rst analyze how the minimum wage in‡uences unionization and investment behavior within each periodt; taking beliefs are given. Then, we proceed to analyze the impact of the minimum wage on the dynamics of beliefs and unionization.
1 4
Here it is assumed that the trade union invests before the government sets the wage. This assumption has been chosen because investment in the quality of labor relations can be interpreted as a commitment device. However, it should be noticed that our main result of multiplicity of steady states, some with investment, others without, also holds when the wage is set before investment and when investment and wage are chosen simultaneously.
3.2.1 Short run equilibrium
Here we analyze unionization and investment in labor relations within any periodt; with given belief qt = Pr [e=Cjht(n; s)] and given minimum wage wt: All workers whose productivity is
lower than the minimum wage wt are unemployed. Non unionized workers with productivity y wt obtain the minimum wage wt 0. Unionized workers with productivity y wt expect
to get the wagewt(y) = y+wtwith probabilityp(qt; it)and the minimum wage with probability 1 p(qt; it):
Unionization decision
Workers decide to join unions in period tif and only if the utility derived from union mem-bership, equal to fp(qt; it)wt(y) + [1 p(qt; it)]wtg(1 c), is larger than the utility obtained
without union membership, equal to the minimum wage wt.15 Therefore, all workers whose
productivity lies above the threshold
^
yt=
cwt (1 c)p(qt; it)
(3) decide to become union member. The share of workers who decide to join a union in periodtis therefore equal to:
t= 1 G
cwt (1 c)p(qt; it)
: (4)
In particular the share of unionized workers decreases with the minimum wage, the reason simply being that the gains from unionization are lower when the minimum wage is higher. More pessimistic beliefs about the chance of success of bargaining also lead to lower union density. Investment/experimentation decision
The trade union’s objective is to maximize the sum of the rents of its members, equal to the di¤erence between what they get when they are unionized and the minimum wage they get for sure when not unionized, namely:
Z 1 cwt (1 c)p(qt;it)
[p(qt; it)(1 c) [wt(y) wt] cwt]dG(y): (5)
Recall that if there is investment in the quality of labor relations (i.e. if it = I), the
negotiation succeeds with probabilityp(qt; I)equal to"+ (1 2")qt, whereas the probability of
success falls down top(qt;0) =" in the absence of investment. (wt; qt) = Z 1 cwt (1 c)[qt(1 2")+"]) f[qt(1 2") +"] (1 c) y cwtgdG(y) Z 1 cwt (1 c)") ["(1 c) y cwt]dG(y)
1 5Note that the decision to join the trade union is motivated here by individual gains only and not by social
custom as in the approach developed by Akerlof (1980), Booth (1985), Booth and Chatterji (1993), Corneo (1995), Naylor (1989) and Naylor and Crips (1993) and Naylor and Raaum (1993).
Let (wt; qt) denote the di¤erence between the value of the rents when investment takes
place and the value of the rents when there is no investment.16 There is investment in labor relations if and only if
(wt; qt)> I: (6)
It is easily checked that is increasing inqt and decreasing in the minimum wagewt. More
precisely, we get @ (wt; qt) @wt = wtc 2q t(1 2") (1 c) "[qt(1 2") +"] <0; (7) @ (wt; qt) @qt = Z 1 cwt (1 c)[qt(1 2")+"]) [(1 2")(1 c) y]dG(y)>0: (8)
Thus the trade union is more likely to invest when the minimum wage is lower and when workers are more optimistic about the returns of the investment. In particular investment will never occur if the investment cost I is higher than the maximum expected gains which arise when the minimum wage is equal to zero and people are the most optimistic, i.e. whenqt = 1:
In order to avoid such situations we assume henceforth that
(0;1)> I; (9)
or equivalentlyI < (1 2"2)(1 c)
The minimum wage policy and the no experimentation trap
Investment and unionization decisions depend upon beliefs and the minimum wage. Workers unionize more when they are more optimistic about the chance of success of negotiation and when the minimum wage is lower. And the trade union invests more to improve labor relations when workers are more optimistic about the returns to the investment and when the minimum wage is lower.
Figure 12 describes the short-run equilibrium for investment and unionization given(qt; wt)
(the details underlying Figure 12 are presented in the appendix). Three regions, corresponding to three di¤erent type of equilibria, show up:
i) when workers are optimistic and the minimum wage is low, then there is positive union density and positive investment;
1 6
Simple calculation shows that
(wt; qt) = Z 1 cwt (1 c)[qt(1 2")+"]) f[qt(1 2") +"] (1 c) y cwtgdG(y) Z 1 cwt (1 c)") ["(1 c) y cwt]dG(y)
i
t=0
i
t=0
i
t=I
(1-c)
εµ/
c
1
w
tπ
t> 0
q
tπ
t= 0
π
t> 0
1
Figure 12: Experimentation and unionization in the (qt; wt) plane.
ii) when the minimum wage is low and workers are pessimistic, there is no investment to improve labor relations, but there is positive union density, albeit lower than in the previous situation;
iii) when the minimum wage is high, there is no investment and union density is nil. Figure 12 illustrates that a high minimum wage can prevent the trade union from investing in the quality of labor relations. This is more likely to occur when workers are more pessimistic about the potential payo¤ from such investment, i.e on the cooperative nature of the environ-ment.
3.2.2 The dynamics of beliefs, unionization and experimentation
We now proceed to analyze the dynamics of beliefs, investment and unionization when the minimum wage is exogenously …xed at some level w; for all periods t 0: According to …gure 12, there are potentially three di¤erent possible steady states:
i)A steady state where i=I and >0,
ii) A steady state where i= 0 and >0,
iii) A steady state wherei= = 0:
Suppose …rst that there is no investment in period t= 0:In this case, the economy reaches its steady state immediately since beliefs are never revised thereafter. This case occurs if the
initial value of the belief,q0;is such that the net gain of investment is negative in period zero,
i.e. if (w; q0) I;or equivalently if
q0< q=fqj (w; q) =Ig
since (w; q) is increasing in q: As shown in …gure 12, two possible steady states are possible in this situation, corresponding to casesi) and ii). If the minimum wage is su¢ ciently low, i.e. if w < 1 c"; the economy is stuck in a steady state where the share of unionized workers is positive, equal to 1 c" w: If the minimum wage is above 1 c", the economy is stuck in a steady state with zero union density.
Now suppose that
q0> q:
and that the minimum wage is su¢ ciently low that experimentation occurs in period t= 0:In this case, the dynamics of experimentationmay lead the economy to converge towards a steady state with positive union density and investment. However, such optimistic beliefs in period zero are not su¢ cient to insure that the steady state with positive investment will indeed be reached. More speci…cally, when q0 > q; the economy converges toward such steady state with a
positive probability, which will be shown below to depend both upon the minimum wagewand uponq0:
Note …rst that if negotiation succeeds in period zero, then we must have: q1= Prt=1(e=C)> 0and p1(1;1)> p0:This implies that the expected return from investment at date 1, (w; q1);
is higher than in period zero. Thus
q1 > q0:
The same rise in workers’optimism occurs between periodstandt+1when negotiation succeeds in periodt:
The dynamics of beliefs when there is investment, is fully described by:
qt+1 = 8 > < > : qt ifqt q (1 ")qt (1 ")qt+"(1 qt) > qt with probability 1 " ifqt> q "qt "qt+(1 ")(1 qt) < qt with probability " ifqt> q; (10)
if the economy is type-C, and
qt+1 = 8 > < > : qt ifqt q (1 ")qt (1 ")qt+"(1 qt) > qt with probability " ifqt> q "qt "qt+(1 ")(1 qt) < qt with probability 1 " ifqt> q; (11)
A …rst implication of the updating equation (10) is that as the experimentation history expands, the reference type ends up being learned with probability 1. More formally, the con-tinuous mapping theorem (see Acemoglu et al, 2007) implies thats!(1 ")t ast! 1 when experimentation occurred in all periods0;1; :::; t 1;which in turn implies that
lim
t !1Pr [e=Cjht(t; s)] = limt !1
q0
q0+ (1"")t(1 2")(1 q0) = 1:
However, as we shall see below, experimentation may not occur in all periods even when the economy is cooperative (e= C): And as a result the economy will not avoid falling into a no investment/ no experimentation trap with probability one. The continuous mapping theorem also yields that limt !1Pr [e=Cjht(t; s)] = 0 if e= N;which this time will imply that with
probability one the economy falls into a no experimentation/no investment trap. From now on we shall concentrate on the case where the economy is truly cooperative (type-C).
A second implication of the updating equation (10), is that the probability of uninterrupted experimentation (and therefore of convergence toward full learning) increases with the value of the initial beliefsq0:For example, ifq0 is larger than the threshold valueq below which there is
no investment, but close enough toq;the probability that there is investment in period zero, but then no investment in subsequent periods, can be high. To see this, imagine thatq0> qbut that
negotiation fails in period zero (this occurs with probability"). Then, equation (10) implies that
q1< q0:Ifq1 is smaller thanq;which will occur ifq0 is close enough toq;investment is equal to
zero in period one. In that case, the economy falls in a no-investment/no-experimentation trap in period 1, after one period of experimentation, and from period zero this case is perceived to occur with probability".
For higher values of q0 it will take more than one failure to bring the economy to a
no-investment/no-experimentation trap. Such a scenario can occur after period 1 when there are successive failures for higher values ofq0:More precisely, we can show:
Proposition 1: If the economy is of the cooperative type (e = C) and if q0 > q; then the economy avoids the no-investment/ no-experimentation trap with probability Q(q0; w) which is increasing in q0 and decreasing in w:
Proof: LetT(q0; q) be de…ned by
'(T; qo) =q; where: '(T; qo) = 1 1 + (1 q0 q0 )( 1 " " )T :
Since' is decreasing inT and increasing in q0;then T(q0; q) is increasing in q0 and decreasing
Now the ex ante expected probability thatqt will eventually fall below q, which in turn will
lead to a no-investment/no-experimentation trap, is equal to:17
P(q0; q) = P n 0 P s n T(q0;q) 2 n s (1 ") s"n s P n 0 P s n n s (1 ")s"n s :
In particular it is easy to see thatP(q0; q)is decreasing inT; and therefore decreasing inq0 and
increasing inq; and therefore
Q(q0; w) = 1 P(q0; q)
is increasing inq0 and decreasing inq and therefore in the minimum wagew:QED.
Thus, when the economy is truly cooperative, the economy is more likely to converge to-ward a steady state equilibrium with positive investment and union density if initial beliefs are su¢ ciently optimistic and the minimum wage is su¢ ciently low. Moreover, we can state that: Result 1: In steady state, aggregate welfare of workers is higher in the equilibrium with positive investment in the quality of labor relations than in the equilibrium without investment.
Proof:
Aggregate welfare of workers in periodtis equal to the sum of wages minus the unionization costs and the investment costs in the quality of labor relations:
Wt= G cw (1 c)p(qt; it) G(w) w+ Z 1 cw (1 c)p(qt;it) (1 c)fp(qt; it)w(y) + [1 p(qt; it)]wgdG(y) it: When (1 ccw)p(q
t;it) is greater than 1, then aggregate welfare is equal to:
Wt= [1 G(w)]w it: (12)
A steady state equilibrium with positive investment in the quality of labor relations can exist only if the economy is truly cooperative and if (1 cwc)(1 ") <1. Assuming that these two conditions are ful…lled, the probabilityp(qt; it) that voice succeeds at date t;is equal to 1 "if
there is investment in the quality of labor relations. Then, steady state welfare is
WI = G cw (1 c)(1 ") G(w) w+ Z 1 cw (1 c)(1 ") (1 c) [(1 ") y+w]dG(y) I: 1 7
Here we use the fact that
qt= Pr [e=Cjht(n; s)] = 1 1 + (1 q0 q0 )( 1 " " )n 2s :