Trading in European Equity Markets:
Fragmentation and Market Quality
Zur Erlangung des akademischen Grades eines Doktors der Wirtschaftswissenschaften
(Dr. rer. pol.) von der Fakultät für Wirtschaftswissenschaften
am Karlsruher Institut für Technologie (KIT)
genehmigte
DISSERTATION
von
Dipl.-Wi.-Ing. Martin Wagener, Ingénieur INPG
Tag der mündlichen Prüfung: 8. November 2011 Referent: Prof. Dr. Ryan Riordan
Korreferent: Prof. Dr. Andreas Park
Abstract
Since the beginning of the 21st century, we have witnessed substantial changes in sec-ondary European equity markets. Exchanges and trading is becoming increasingly au-tomated and regulations have shaken up the trading landscape in which European ex-changes, such as the London Stock Exchange (LSE) and Deutsche Boerse, have enjoyed a national quasi-monopoly in trading. The European Markets in Financial Instruments Directive (MiFID), adopted in 2007, changed the status quo by allowing alternative trading venues to compete with traditional exchanges. This thesis studies how MiFID impacted European equity trading and develops a number of new insights.
In my work I focus on so-called multilateral trading facilities (MTF). On these alter-native trading venues users can trade securities as on traditional exchanges. However, compared to established exchanges, MTFs are often considered to offer superior trad-ing speed, lower transaction costs, and more innovative services. Yet while investors may benefit from the greater choice of trading venues and from stronger competition for order flow, multiple platforms also cause fragmentation of trading volume and liq-uidity. An important question is thus whether this fragmentation caused markets to be less transparent and trading to be more costly.
This thesis provides an empirical analysis of trading in UK-listed blue-chip stocks for two observation periods, the first in 2009 and the second in 2010. My findings suggest that MTFs contribute significantly to overall liquidity and price discovery. In addition, my analysis shows that investors profit from being able to trade on multiple platforms as they trade when and where it is least expensive to do so. I show that the LSE and MTFs provide a liquid market and find no evidence that market fragmenta-tion has harmed market quality. To better understand the implicit, competifragmenta-tion driven coordination of markets, I further analyze whether fragmentation leads to increased violations of the law of one price and occurrence of suboptimal executions. Neither situation would be consistent with an efficient market. The evidence suggests that exploitable arbitrage opportunities are resolved quickly when they arise. Further, in-vestors most often trade at the best available price across all markets. Consequently, I conclude that competition for order flow forces disconnected trading venues to quote integrated prices.
Altogether, the findings of this thesis suggest that under MiFID the positive effects of increased competition for order flow outweigh the possible negative side-effects of market fragmentation.
Contents
List of Figures v
List of Tables vii
List of Abbreviations ix
1 Introduction 1
1.1 Motivation . . . 1
1.2 Research Outline . . . 3
1.3 Structure of the Thesis . . . 5
2 European Equity Market Structure 7 2.1 Markets in Financial Instruments Directive . . . 7
2.2 Details on the UK Equity Market . . . 19
3 Related Work 27 3.1 Intermarket Competition . . . 27
3.2 Financial Market Innovation . . . 40
4 Data and Methodology 45 4.1 Data Selection . . . 45
4.2 Trading Intensity and Liquidity Measures . . . 48
4.3 Price Discovery . . . 51
4.4 Logistic Regressions . . . 55
5 Liquidity and Price Discovery 59 5.1 Introduction . . . 59
5.2 Sample Selection and Descriptive Statistics . . . 61
5.3 Liquidity . . . 64
5.3.1 Effective Spreads . . . 64
5.3.2 Order Routing Decisions . . . 68
5.4 Price Discovery . . . 74
5.5 Changes Over Time . . . 77
iv Contents
6 Arbitrage and Suboptimal Executions 85
6.1 Introduction . . . 85
6.2 Sample Selection and Descriptive Statistics . . . 88
6.3 Quote Quality . . . 92
6.3.1 Quote Competition . . . 92
6.3.2 Locked and Crossed Markets . . . 96
6.3.3 Determinants of Locked and Crossed Markets . . . 101
6.4 Trade-Throughs . . . 109 6.4.1 Trade-Through Statistics . . . 109 6.4.2 Determinants of Trade-Throughs . . . 113 6.5 Conclusion . . . 117 7 Conclusion 119 7.1 Summary . . . 119 7.2 Outlook . . . 121 A Sample Data 125 B Sample Firms 129 References 135
List of Figures
2.1 FTSE 100 trading volume on the LSE, Chi-X, BATS, and Turquoise . . . 24
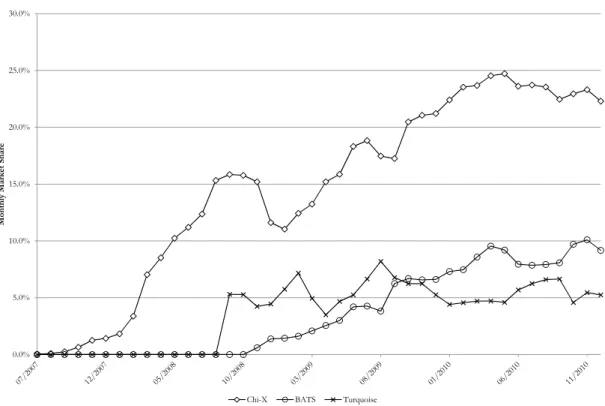
2.2 FTSE 100 market share of Chi-X, BATS, and Turquoise . . . 25
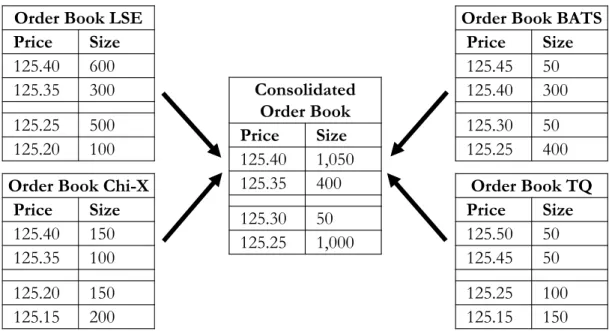
4.1 Consolidated order book . . . 48
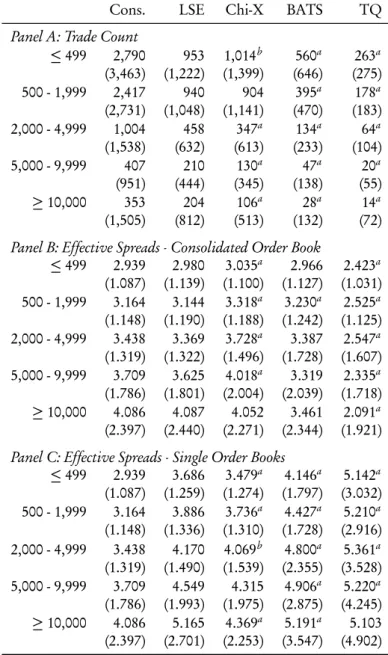
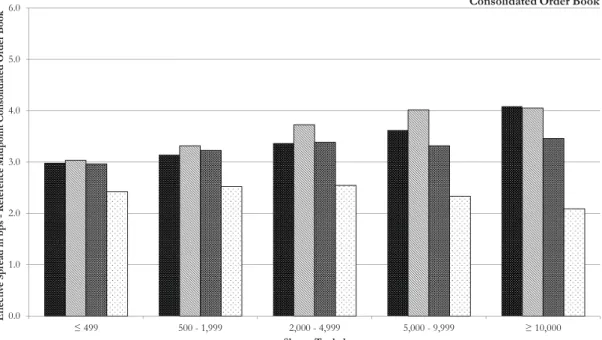
5.1 Effective spreads by trade size categories . . . 66
5.2 Effective spreads over time . . . 78
5.3 Total price discovery over time . . . 79
6.1 Order book scenarios: Locks, crosses, and trade-troughs . . . 87
6.2 Market shares of the LSE, Chi-X, BATS, and Turquoise . . . 89
6.3 Quotations relative to the EBBO . . . 95
6.4 Potential arbitrage revenues after transaction costs . . . 100
List of Tables
2.1 Timeline of MiFID approval . . . 9
2.2 Comparison of MiFID and RegNMS . . . 14
2.3 UK equity market history . . . 21
3.1 Intermarket competition: Overview over the empirical literature . . . . 30
4.1 Sample selection: Excluded FTSE 100 constituents . . . 57
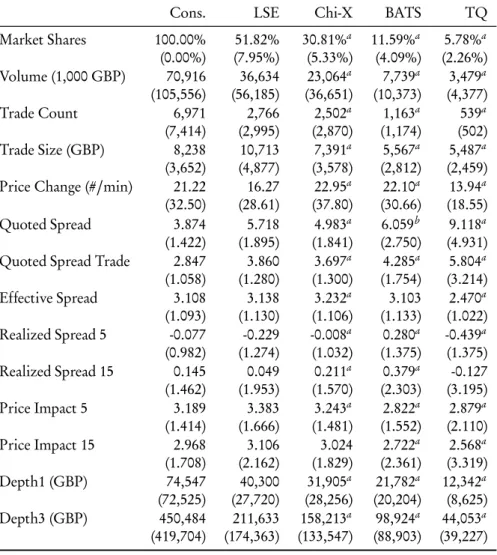
5.1 Descriptive statistics: Trading intensity and liquidity measures . . . 62
5.2 Descriptive statistics: Number of trades and effective spreads by trade size categories . . . 65
5.3 Regressions of effective spreads . . . 71
5.4 Logistic regressions: Order routing decisions . . . 72
5.5 Trade and quoted based price discovery . . . 75
5.6 Trading intensity, liquidity, and price discovery measures between 2009 and 2010 . . . 80
6.1 Descriptive statistics: Trading intensity and liquidity measures . . . 91
6.2 Quote based competition: Trading venue participation in the EBBO . . 93
6.3 Locked and crossed market statistics . . . 97
6.4 Detailed analysis of crossed market quotes . . . 98
6.5 Initiations and terminations of locks and crosses . . . 102
6.6 Logistic regressions: Determinants of lock and cross initiations . . . 108
6.7 Trade-through statistics . . . 111
6.8 Logistic regressions: Determinants of trade-throughs . . . 115
A.1 Raw TAQ data - LSE . . . 126
A.2 Raw depth data - LSE . . . 127
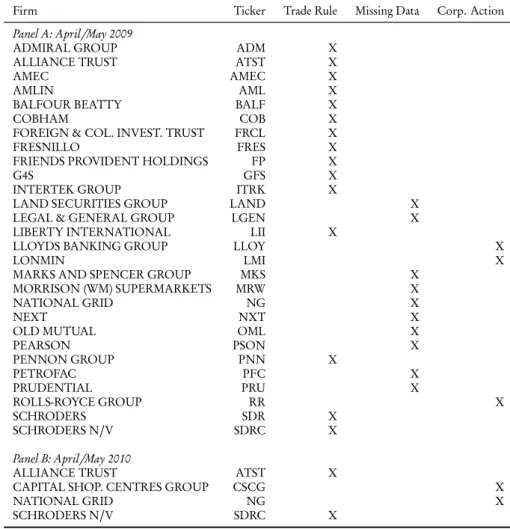
B.1 Sample firms - April/May 2009 . . . 130
List of Abbreviations
AMEX American Stock Exchange
ATS Alternative Trading System
BaFin Bundesanstalt für Finanzdienstleistungsaufsicht
CBOE Chicago Board Options Exchange
CESR Committee of European Securities Regulators
CIRF Cumulative Impulse Response Function
CQS Composite Quotation System
CSE Cincinnati Stock Exchange
CTA Consolidated Tape Association
EBB European Best Bid
EBBO European Best Bid and Offer
EBO European Best Offer
EBS Electronic Broking System
ECN Electronic Communication Network
ESC European Securities Committee
ESMA European Securities and Markets Authority
ETF Exchange-Traded Fund
FESE Federation of European Stock Exchanges
FSA Financial Services Authority
FSAP Financial Services Action Plan
FTSE 100 Financial Times Stock Exchange 100 index
HFT High-Frequency Trading
IDB Inter-Dealer Broker
ISD Investment Services Directive
ISE International Securities Exchange
ITS Intermarket Trading System
LSE London Stock Exchange
MiFID Markets in Financial Instruments Directive
MTF Multilateral Trading Facility
Nasdaq National Association of Securities Dealers Automated Quotations
NBB National Best Bid
NBBO National Best Bid and Offer
NBO National Best Offer
x List of Abbreviations
NYSE New York Stock Exchange
OLS Ordinary Least Squares
OTC Over-The-Counter
PCX Pacific Exchange
PHLX Philadelphia Stock Exchange
RegNMS Regulation National Market System
RIC Reuters Instrument Code
SEAQ Stock Exchange Automated Quotation system
SEC Securities and Exchange Commission
SETS Stock Exchange Electronic Trading Service
SI Systematic Internalizer
SIRCA Securities Industry Research Centre of Asia-Pacific
SRO Self-Regulatory Organization
UTP Unlisted Trading Privileges
VAR Vector Autoregression
VMA Vector Moving Average
Chapter 1
Introduction
1.1 Motivation
The recent automation of exchanges and new regulations has significantly altered the trading landscape. Trading no longer only takes place on a trading floor where brokers meet face to face, it mostly takes place in the server rooms of large financial institutions. Technology has changed how trading venues compete. Most importantly, improve-ments in information and communication technology have facilitated the creation of electronic trading platforms that compete for business with established exchanges and thereby reducing the end costs for investors.
Prior to 2007, traditional exchanges in Europe (regulated markets under MiFID), such as the London Stock Exchange (LSE) and Deutsche Boerse, enjoyed a quasi-monopoly in trading. To keep pace with technological development and to foster com-petition in the provision of services to investors and between trading venues, the Eu-ropean Union (EU) adopted the Markets in Financial Instruments Directive (MiFID)
that became effective in all EU member states in November of 2007.1 The new set
of rules opened traditional markets to competition from new types of trading venues, most importantly multilateral trading facilities (MTF) such as Chi-X and BATS. Today, the majority of trades is executed on regulated markets and MTFs that successfully cap-tured a significant fraction of trading volume from traditional exchanges. For example, the LSE share in exchange traded volume in UK blue-chip stocks decreased from nearly
100.0% in 2007 to less than 60.0% at the beginning of 2011.2 Chi-X is the largest MTF,
1MiFID was implemented in all 27 EU member states and in Iceland, Norway, and Switzerland.
2 Introduction accounting for about 25.0% of daily UK blue-chip trading volume. Similar develop-ments can be observed across Europe. For example, the market share of Deutsche Boerse in German blue-chip stocks fell to about 70.0% in the first quarter of 2011 with Euronext (Paris) falling to a market share of roughly 65.0% in French blue-chip stocks over the same period.
MiFID represents a significant overhaul of existing regulation, relying on three dif-ferent key pillars: market access, transparency, and best execution. First, MiFID abol-ished the option of a so-called ‘concentration rule’, meaning that retail orders had to be executed on a national traditional exchange. Today, regulated markets (i.e. traditional exchanges), MTFs, and investment firms can offer their services across borders. Second, transparency obligations require regulated markets and MTFs to publish order book information and executions on a timely basis. Third, under MiFID best execution re-lies on different factors such as cost, speed, likelihood of execution and settlement, and order size. Intermediaries (e.g. investment firms and brokers) that execute orders on behalf of their clients have to establish a best execution policy and the associated rules have to be reviewed at least annually.
There is currently a debate about the advantages of increased competition in equity markets. One consequence of competition between trading venues is that order flow and liquidity, i.e. the ability to trade shares, is fragmented across platforms. Therefore, investors may not always receive the best available price as MiFID does not enforce price-time priority across markets. In addition, less integrated markets may diminish the price discovery process and generally increase the costs of trading such as search and connectivity costs. Proponents of MiFID, however, argue that intermarket competi-tion has put downward pressure on explicit transaccompeti-tion costs, for instance, exchange fees and brokerage commissions, and has provided trading venues with incentives to innovate on their services (European Commission, 2010). Furthermore, increasing use of technology may mitigate some of the potential negative side effects of market frag-mentation. For instance, algorithmic and high-frequency traders may link platforms by consolidating order flow.
The introduction of more nimble trading venues is not per se a new phenomenon. Electronic communication networks (ECN) that compete for order flow in U.S. eq-uity markets emerged on a widescale basis in the late 1990s. New U.S. regulations
Research Outline 3 enabled this development. Currently, U.S. equity trading is regulated under the Regu-lation National Market System (RegNMS). Both MiFID and RegNMS share the goals of enhancing competition between trading venues, ensuring best execution, and guar-anteeing fair and orderly trading. A key differentiating factor of both regulations is the lack of formal integration in Europe where markets are not formally linked through networks and price-priority is not enforced across platforms. In addition, European regulation does not establish a single data consolidator to provide comprehensive con-solidated market information to investors.
The literature has intensively studied competition between ECNs and traditional markets in the U.S., especially in Nasdaq-listed stocks. The evidence supports the view that ECNs are competitive on liquidity (e.g. Barclay et al., 1999; Weston, 2000) and contribute to price discovery (e.g. Huang, 2002; Barclay et al., 2003). However, the market and regulatory structure is decidedly different in Europe. Therefore, the re-search on trading venue competition in U.S. markets can only be partially transferred to the European case. Despite the growing body of literature analyzing market frag-mentation under MiFID, MiFID’s impact on market quality is still not clear. Four years after MiFID considerably altered European equity trading, the time has come for a thorough analysis. This thesis aims to determine the contribution of MTFs to overall liquidity and price discovery in high volume stocks. In addition, it sheds light on the question whether platforms quote closely linked prices without a formal linkage.
1.2 Research Outline
This thesis aims to explore the impact of market fragmentation on market quality
un-der MiFID.3Liquidity and price discovery are two of the most important dimensions
3Chapter 5 is based on a joint working paper with Ryan Riordan and Andreas Storkenmaier
(Rior-dan et al., 2011). A previous version of the paper was circulated under the title “Fragmentation, Competition and Market Quality: A Post-MiFID Analysis” and presented at the 2nd Center for Fi-nancial Studies International Conference: The Industrial Organisation of Securities Markets: Com-petition, Liquidity and Network Externalities, at the 2010 European Financial Management Asso-ciation Meeting, at the Doctoral Symposium of the 3rd Erasmus Liquidity Conference, at the 17th Annual Meeting of the German Finance Association (DGF), and at the 2011 Campus for Finance Research Conference. Chapter 6 relies on a working paper with my co-author Andreas Storkenmaier (Storkenmaier and Wagener, 2011). An early version was presented at the 2010 Boerse Stuttgart Re-search Colloquium. A much more detailed version was presented at the 2011 European Financial Management Association Meeting and accepted for presentation at the 28th International
Confer-4 Introduction of market quality as they determine the level of market efficiency that is a prerequi-site for the optimal allocation of capital. In general, the quality of a market is driven by a set of rules and the behavior of market participants. Since investors and regula-tors may define market quality differently depending on different types of transactions and strategies, the concept cannot be assessed by a single measure. The literature has summarized a number of measures that are commonly used in empirical market mi-crostructure studies to evaluate and compare different trading venues. I apply these measures to examine market quality in UK blue-chip stocks on different platforms, the LSE and MTFs, and from an overall market perspective.
This thesis uses trade and quote data to empirically examine the dimensions of mar-ket quality on the most important trading venues in terms of UK trading volume, namely the LSE, Chi-X, BATS, and Turquoise. Competition for order flow may be beneficial when trading venues offering more liquidity attract a substantial fraction of investors. Therefore, this thesis analyzes liquidity on each platform and the variables investors use to condition their order routing decisions. The decision to route an order to one platform or another may also affect the contribution of each trading venue to price discovery. I examine the price discovery process using trades as in Hasbrouck (1991a,b) and quotes as in Hasbrouck (1995). In addition, to better understand the impact of increased fragmentation on market quality, a comparison between a period where fragmentation is considerably lower to a benchmark period is presented. Chap-ter 5 specifically addresses the following research question:
RQ: Do MTFs contribute to liquidity and price discovery?
In contrast to U.S. equity market regulation, MiFID neither establishes a formal linkage between trading venues nor enforces price-priority across platforms. There is also no official European consolidated tape that allows investors to observe the best available price across markets. This essentially creates a situation where the barriers to competition have fallen and competition forces are left to solve integration. Chapter 6 therefore explores market coordination by analyzing arbitrage opportunities and sub-optimal executions. Neither situation seems consistent with an economically efficient market: arbitrage opportunities violate the law of one price and suboptimal executions
ence of the French Finance Association. Financial support from Boerse Stuttgart and the Karlsruhe House of Young Scientists (KHYS) is gratefully acknowledged.
Structure of the Thesis 5 indicate that an investor could have received a better price. The following research question arises:
RQ: Does competition force competing but disconnected trading platforms to quote prices as if they were formally linked?
Methodologically, this chapter is related to Battalio et al. (2004) who study quote and execution quality in U.S. equity options in the absence of a formal linkage. This part of the thesis further aims to reveal under which market conditions arbitrage opportunities and suboptimal execution predominantly arise. Altogether, Chapter 5 and Chapter 6 provide an in-depth analysis of different market quality dimensions (liquidity, price discovery, and market coordination) in the fragmented UK trading environment.
1.3 Structure of the Thesis
The remainder of this thesis is organized as follows. Chapter 2 discusses European eq-uity trading regulation, highlighting the key pillars of MiFID and drawing parallels to U.S. regulation. It additionally provides details on competing platforms in UK equity trading, the main market under research in this thesis. Chapter 3 reviews the related literature. First, theoretical and empirical studies of intermarket competition and its impact on trading behavior, liquidity, and price discovery are summarized. The dis-cussion focuses on U.S. and European markets. Second, effects of recent technological innovations in financial markets, such as algorithmic and high-frequency trading, are reviewed to evaluate their impact on fragmented markets. Chapter 4 provides data characteristics and important details on trading intensity, liquidity, and price discov-ery measures as well as logistic regressions used in the following chapters. Chapter 5 analyzes competition between the LSE and MTFs in UK blue-chip stocks and discusses whether MTFs contribute to market quality. Chapter 6 aims to examine whether com-petition between disconnected trading venues forces them to quote prices as if they were formally linked. Finally, Chapter 7 summarizes the key contributions and briefly outlines promising avenues for future research in related topics.
Chapter 2
European Equity Market Structure
This chapter provides a solid background of the European equity market structure to further empirical analyses. Section 2.1 summarizes the key pillars of European equity trading regulation describing its main objectives and drawing parallels to the regula-tion in the U.S. Secregula-tion 2.2 provides details on the UK equity market, the market under research in my thesis, and highlights important market developments over the last decade.
2.1 Markets in Financial Instruments Directive
The organizational structure of a financial market is determined by its regulatory framework and by the interaction between market participants. In this context, market microstructure theory studies in detail “the process and outcomes of exchanging assets under a specific set of rules” (O’Hara, 1995, p. 1). To both the suppliers and deman-ders of liquidity as well as regulators, it is important to undeman-derstand how specific rules influence trading behavior, market quality, or the way public and private information is incorporated into prices. Market microstructure literature has shown that details in the trading process, reflecting order-handling costs, transparency, exchange infrastruc-ture, and asymmetric information, can have a profound impact on the functioning of
a market.1 In contrast to technological improvements or limited regulatory changes
on single exchanges, the introduction of the Markets in Financial Instruments Direc-tive (MiFID) significantly altered the entire secondary trading landscape across Europe.
8 European Equity Market Structure MiFID is a major part of the European Union’s Financial Services Action Plan (FSAP)
and came into effect in all 27 member states on November 1, 2007.2 The overall
ob-jective of MiFID is to foster competition in the provision of services to investors and between trading venues. The set of rules is “intended to contribute to deeper, more integrated and liquid financial markets, to drive down the cost of capital for issuers, to deliver better and cheaper services for investors, and thus to contribute to economic growth and job creation” (European Commission, 2010).
I. MiFID: Details and political process
MiFID consists of a framework Directive (Directive 2004/39/EC), an
Implement-ing Directive (Directive 2006/73/EC), and an Implementing Regulation (Regulation
No 1287/2006), replacing the Investment Services Directive (ISD, Council Directive
93/22/EEC) which was implemented in July 1995. MiFID broadens the scope of ISD
and further harmonizes the rules in the European Union (EU). ISD specifies minimum standards under which investment firms can provide services or establish branches in member states on the basis of home country authorization and supervision. Accord-ing to Herbst (2003), there are mainly two reasons why a new regulatory framework was necessary. First, investors became more active in financial markets and the range of products offered grew considerably and second, ISD may have not been able to level the playing field across the whole EU.
Table 2.1 highlights important steps towards the MiFID approval by European au-thorities. In June 1998, the Cardiff European Council invited the European Com-mission to prepare a ‘framework for action’ to complete the market for financial ser-vices within the European Union, notably with the introduction of the euro in Jan-uary 1999. The initial FSAP program was published in May 1999 (COM(1999) 232) and outlines specific measures to be taken in order to create a single market for all financial services among EU members. It does not merely focus on one sector such as banking or insurance but rather consists of a set of 42 measures intended to fill gaps and eliminate remaining cross-border barriers. Specifically, FSAP aims to create a single wholesale market, an open and secure retail financial services market, and
state-of-the-art prudential rules and supervision.3
2Iceland, Norway, and Switzerland have also implemented MiFID.
Markets in Financial Instruments Directive 9
Table 2.1:Timeline of MiFID approval. The table highlights important steps in the political
and regulatory process from the ISD adoption to MiFID.
Date Event
May 10, 1993 Adoption of the ISD (Council Directive 93/22/EEC)
July 1, 1995 ISD came into force
June 15-16, 1998 Cardiff European Council invited European Commission
to prepare a ‘framework for action’ for financial services
May 11, 1999 European Commission published FSAP
March 23-24, 2000 Political agreement on FSAP by Lisbon European Council
November 19, 2002 European Commission completed draft on the revision
of the ISD (subsequently MiFID)
September 25, 2003 First reading by European Parliament
October 16-17, 2003 Brussels European Council endorsed MiFID
April 21, 2004 European Parliament approved MiFID framework
Directive (Directive 2004/39/EC)
2004-2005 Technical advice by CESR and consultation process on
implementing measures
August 10, 2006 European Commission passed the Implementing Directive
(Directive 2006/73/EC) and the Implementing Regulation
(Regulation No 1287/2006)
November 1, 2007 MiFID came into full effect in all member states of the EU
Legislative process. MiFID is a major part of FSAP and encompasses investment firms
and financial instruments. Its introduction followed a four-level legislative process proposed by the Committee of Wise Men on the Regulation of European Securities
Markets chaired by Alexandre Lamfalussy (Committee of Wise Men, 2001).4 Level 1
consists of the framework Directive proposed by the European Commission and was jointly adopted by the European Council and the European Parliament. These rules are adopted to national law by each member state. Level 2 consists of the Implement-ing Directive and the ImplementImplement-ing Regulation set by the European Commission un-der assistance of the European Securities Committee (ESC). The Implementing Direc-tive defines organizational requirements and operating conditions for investment firms
single market discussing FSAP in detail.
4The Committee of Wise Men was appointed by the European Council in July 2000 and recommended
changes to accelerate the passage of necessary legislation. Visscher de et al. (2008) analyze the arrange-ments of the process and state that “the speed of the process has increased overall and that there are fewer bottlenecks than before in the different steps leading to the adoption of legislation”.
10 European Equity Market Structure and the Implementing Regulation specifies record-keeping obligations for investment firms, transaction reporting, market transparency, admission of financial instruments to trading, and further definitions. While the latter is directly applicable in the mem-ber states without transposition, the Implementing Directive needs to be adopted to
national law. At Level 3, the Committee of European Securities Regulators (CESR)5
has to ensure a consistent implementation of Level 1 and Level 2 across member states. It also gives technical advice at Level 2. Level 4 refers to more effective implementation and enforcement of EU laws. The Implementing Directive and Implementing Reg-ulation were finally passed in August 2006 and MiFID came into full effect in all 27 member states of the EU on November 1, 2007.
Categories of trading venues. With MiFID the European authorities “establish a
com-prehensive regulatory regime [. . .] to ensure a high quality of execution of investor
transactions and to uphold the integrity and overall efficiency of the financial system”
(Directive 2004/39/EC, Preamble). It applies to investment firms and regulated
mar-kets alike. An ‘investment firm’ is defined as “any legal person whose regular occupa-tion or business is the provision of one or more investment services to third parties
and/or the performance of one or more investment activities on a professional basis”
(Directive 2004/39/EC, Article 4(1)) and a ‘regulated market’ is specified as “a
multi-lateral system operated and/or managed by a market operator, which brings together
[. . .] multiple third-party buying and selling interests in financial instruments [. . .]
in a way that results in a contract [. . .]” (Directive 2004/39/EC, Article 4(14)).
Op-erators of regulated markets have to fulfill transparent and non-discretionary rules and procedures that provide fair and orderly trading.
The Directive further specifies the following three categories of trading venues: regulated markets, multilateral trading facilities (MTF), and systematic internalizer
(SI).6 While an MTF is defined in a similar fashion than a regulated market
(Direc-tive 2004/39/EC, Article 4(15)), a SI is an “investment firm which, on an organised,
frequent and systematic basis, deals on own account by executing client orders outside
5To further integrate European supervision, the European Securities and Markets Authority (ESMA)
replaced CESR in January 2011 (Implementing Regulation No 1095/2010). ESMA assumes all tasks
and competences of CESR and has new powers, for instance, the implementation of technical bind-ing standards and additional responsibilities for customer protection.
6As of November 10, 2011, there are 93 regulated markets, 144 MTFs, and 14 SIs operating in the EU.
Markets in Financial Instruments Directive 11
a regulated market or an MTF” (Directive 2004/39/EC, Article 4(7)). Hence, the
con-cept of SIs takes into account the possibility of large investment firms to internalize clients orders. My thesis focuses on competition between regulated markets and MTFs as both trading venue categories are the most important in terms of trading volume.
Further discussions are therefore limited to these two categories.7In April 2011, Chi-X
is the largest MTF in Europe accounting for roughly 26.0% of daily trading volume in FTSE 100 stocks and 18.0% in continental European equity trading, well in front of
BATS and Turquoise.8
Key pillars of MiFID. MiFID establishes a regulatory regime for each category of
trad-ing venue that relies on three different key pillars, namely market access, transparency,
and best execution.9 The next paragraphs discuss each of these factors in detail:
• Market access: MiFID abolishes the option for a so-called ‘concentration
rule’ or tax provisions given by ISD (Council Directive 93/22/EEC,
Ar-ticle 14(3)), meaning that retail orders had to be executed on a regulated market. As a consequence, domestic exchanges enjoyed a quasi-monopoly in nearly all member states - especially in Spain, Italy, and France (Davies et al., 2005). Under MiFID, investors’ orders can either be executed on a regulated market, an MTF, or a SI. Currently, MTFs offer trading in nearly all European blue-chip stocks and have successfully captured market shares from regulated markets. Their business models are tailored to the needs of speed-sensitive traders offering low-latency trading infrastructure, new fee schedules, and innovative order types. Consistent with ISD, MiFID also al-lows investment firms to provide services and activities in any other
mem-ber state (Directive 2004/39/EC, Article 31) or to establish a branch under
authorization and supervision of the home state (Directive 2004/39/EC,
Article 32).
• Transparency: The Directive includes p and post-trade transparency
re-quirements for equity trading on regulated markets and MTFs (Directive
2004/39/EC, Articles 29-30 and 44-45). As the number of trading venues
7Gomber and Pierron (2010) provide further insights into SI and OTC trading.
8See http://www.ft.com/intl/trading-room/.
12 European Equity Market Structure increases, order book information becomes more fragmented. To ensure a high level of market quality and an integrated price discovery process, MiFID requires regulated markets and MTFs to publish best bid and ask prices along with the number of shares quoted at these prices on a con-tinuous basis. Post-trade requirements include the time of execution, the execution price, and the associated trading volume.
• Best execution: The best execution obligation under MiFID applies when
in-vestment firms and brokers execute orders on behalf of clients. Article 21 of
Directive 2004/39/EC requires intermediaries to “take all reasonable steps
to obtain[. . .] the best possible result for their clients taking into account
price, costs, speed, likelihood of execution and settlement, size, nature or any other consideration relevant to the execution of the order”. Thus, it ap-plies to the overall characteristics of a possible trade and it is not just based on the best available price across trading venues. According to MiFID, in-vestment firms have to establish an order routing policy that they review
on a regular basis.10 This is in contrast to the standard guidelines prior
to the introduction of MiFID. For example, the British Financial Service Authority (FSA) only used LSE quotes to define best execution (Davies, 2008).
Impact of MiFID. When evaluating the impact of MiFID on European equity
trad-ing, it is important to keep in mind further developments that may had an impact on exchange operators and investors. First, high market volatility and defaults of ma-jor counterparties during the financial crisis influenced financial markets and second, technological improvements in both exchange and trading infrastructure created new trading possibilities. CESR launched a number of reports and consultation papers to evaluate the developments post MiFID (CESR, 2008, 2009, 2010). According to the European Commission (2010), there is evidence that
• the European market for financial services is more integrated under MiFID
than before (i.e. investment firms and regulated markets offer products on
10In some cases these rules are very simple. Deutsche Bank, for example, outlines that it executes clients’
orders in German stocks on Xetra, the electronic order book of Deutsche Boerse, assuming that the largest platform in terms of trading volume also guarantees best prices.
Markets in Financial Instruments Directive 13 a European scale),
• competition between regulated markets and MTFs has put downward
pres-sure on explicit transaction costs, bid-ask spreads, and trading times, and
• investor protection has been considerably strengthened.
In December 2010, the European Commission started a consultation process intended to get feedback from market participants, investors, national governments, national competent authorities, and academics for the ongoing improvement of MiFID (Euro-pean Commission, 2010). In this context Internal Market and Services Commissioner
Michel Barnier stated that “[. . .] in many ways, it [MiFID] has been a success. But
the world has changed. And we all know the current framework needs improvement. My objective is to ensure that the revision of MiFID will lead to a stronger regulatory
framework, adapted to the new trends and players on financial markets[. . .]”.11 This
thesis contributes to the ongoing debate about MiFID by providing empirical evidence on market quality, price discovery, and market coordination on regulated markets and MTFs (Chapter 5 and Chapter 6).
II. Equity trading regulation in the U.S.
It is important to put European equity trading regulation into perspective by compar-ing MiFID to U.S. regulation. MiFID comes as a set of rules influenccompar-ing tradcompar-ing and investor behavior on different levels at the same time. Therefore, it is difficult to isolate effects of specific rules outlined in MiFID. Table 2.2 compares objectives and regula-tory key pillars of MiFID and the Regulation National Market System (RegNMS), introduced in August 2005 by the U.S. Securities and Exchange Commission (SEC). RegNMS is a further adaption of the Securities Exchange Act of 1934 and includes “new substantive rules that are designed to modernize and strengthen the regulatory structure of the U.S. equity markets” (RegNMS, Summary). It builds upon the Na-tional Market System (NMS) established by the U.S. Congress in 1975.
Major regulatory changes in the last century. The 1975 amendments to the Exchange
Act of 1934 had a profound impact on the way equities were traded in the U.S. First, the new rules deregulated fixed commissions, such as brokerage rates, and second,
14 European Equity Market Structure
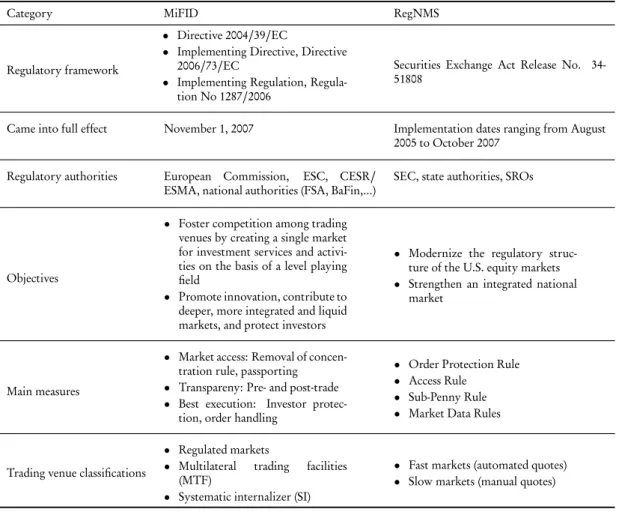
Table 2.2:Comparison of MiFID and RegNMS. The table provides details to the European
regulatory framework on equity markets, MiFID, and the U.S. counterpart regulation, Reg-NMS.
Category MiFID RegNMS
Regulatory framework
• Directive 2004/39/EC
• Implementing Directive, Directive 2006/73/EC
• Implementing Regulation, Regula-tion No 1287/2006
Securities Exchange Act Release No. 34-51808
Came into full effect November 1, 2007 Implementation dates ranging from August
2005 to October 2007
Regulatory authorities European Commission, ESC, CESR/ ESMA, national authorities (FSA, BaFin,...)
SEC, state authorities, SROs
Objectives
• Foster competition among trading venues by creating a single market for investment services and activi-ties on the basis of a level playing field
• Promote innovation, contribute to deeper, more integrated and liquid markets, and protect investors
• Modernize the regulatory struc-ture of the U.S. equity markets
• Strengthen an integrated national market
Main measures
• Market access: Removal of concen-tration rule, passporting
• Transpareny: Pre- and post-trade
• Best execution: Investor protec-tion, order handling
• Order Protection Rule
• Access Rule
• Sub-Penny Rule
• Market Data Rules
Trading venue classifications
• Regulated markets
• Multilateral trading facilities (MTF)
• Systematic internalizer (SI)
• Fast markets (automated quotes)
• Slow markets (manual quotes)
they mandated the SEC with the establishment of an integrated National Market Sys-tem (NMS). The NMS links individual trading venues by technology to achieve a fair and orderly market. The SEC has taken many actions to pursuant to its mandate, one of most important ones approved the Intermarket Trading System (ITS) in 1978. ITS is a facility which allows to display best quotes and orders to be routed between partic-ipating trading venues. On the basis of best quotes a variety of trading venues compete for orders in a unified system including national exchanges such as the New York Stock Exchange (NYSE) or the National Association of Securities Dealers Automated Quo-tations (Nasdaq) and regional exchanges. The key requirement is that an exchange is not allowed to trade-through a better price currently offered for an instrument by a competing trading venue. In the case, when another trading venue offers a better price,
Markets in Financial Instruments Directive 15
the order must be sent to this market via ITS.12 In general, ITS trade-through rules
were in place for NYSE-listed stocks unless an exception applied. For instance, small 100-share quotations and large 10,000 share or block transactions were not protected.
Trade-throughs were not prohibited in Nasdaq-listed stocks.13
The SEC also approved joint industry plans that define standards for quote dis-semination to provide a comprehensive source of market information. For NYSE-listed stocks consolidated trade data is distributed by the Consolidated Tape Asso-ciation (CTA) and quote data is disseminated via the Composite Quotation Sys-tem (CQS). The Nasdaq Unlisted Trading Privileges (UTP) plan provides consolidated trade and quote information for Nasdaq-listed stocks. Trade reporting includes stock symbol, time, price, and volume. Consolidated quote information comprises the Best Bid and Offer (BBO) price, the corresponding volume, and the trading venue. Quotes are available per trading venue and consolidated across platforms displaying the Na-tional Best Bid and Offer (NBBO).
In the 1990s, Electronic Communication Networks (ECN), such as Instinet, in-creased their market shares, especially in Nasdaq-listed stocks. ECNs are alternative trading systems (ATS) and defined as “electronic trading systems that automatically
match buy and sell orders at specific prices” by the SEC.14 Initially, these trading
systems were outside the reach of private investors, mainly used by broker-dealers and institutional investors. This created a two-tiered trading environment resulting in high dealer rents and less competition. For instance, Christie and Schultz (1994) document that Nasdaq market makers avoided odd-eight quotes and Huang and Stoll (1996), among others, find evidence for higher trading costs on Nasdaq compared to the NYSE. In January 1997, new SEC regulations increased competitive pressure on Nasdaq market makers. Most importantly, the new order handling rules required that best quotes offered by Nasdaq market makers on ECNs have to be included in the
12Jarrell (1984) gives an overview over the Securities Acts Amendments of 1975 and provides evidence
that the deregulation of NYSE brokerage rates broke down the broker cartel and triggered a dra-matic growth in institutional trading. Lee (1993) analyzes execution quality on the NYSE, Nasdaq,
regional exchanges, and Instinet in 1988/1989 and finds significant price differences between
loca-tions. His results raise concerns about the adequacy of ITS.
13Despite the absence of a trade-through rule for Nasdaq-listed stocks, Nasdaq’s best execution
obliga-tion forces broker-dealers to execute orders at the best available price. However, this rule was not strictly enforced on an order-by-order level.
16 European Equity Market Structure Nasdaq BBO. In addition, public limit orders must be allowed to compete for order flow, meaning that market makers have to display customers’ limit orders if they are
better priced than their own quotes.15 Facing an increase in trading volume on ECNs,
the SEC adopted Regulation ATS. This new regulation became effective in April 1999. It required so-called proprietary trading systems, broker-dealer trading systems, and ECNs with 5.0% or more of trading volume in a covered security in four of the last six months to publicly disseminate their best-priced orders in that instrument. In ad-dition, the alternative trading system had to join ITS.
Since 2001, the SEC has required that trading venues publish on a monthly basis, pre-defined execution quality reports, so-called ‘Dash-5 statistics’ (Reg NMS, Rule 605). In addition, Rule 606 requires intermediaries to make public on a quarterly basis, trad-ing venues where they route investors’ orders. Investors, brokers, and regulators can use these reports to evaluate the efficiency of order routing decisions. Boehmer et al. (2007) provide evidence that brokers condition their order routing decision on Dash-5 statistics. Trading venues tend to lose order flow if their reported execution quality worsens considerably relative to competitors.
RegNMS. New technologies, new types of trading venues, and the decimalization
sig-nificantly changed the U.S. trading landscape. Following a number of reviews, discus-sions, and consultations, the SEC adopted RegNMS on June 9, 2005. It aims to reduce the number of trade-troughs and to realign the relationship between various trading venues. The four main rules are described below. While the Sub-Penny Rule came into effect in January 2006, the Order Protection and the Access Rule were implemented for different instruments between July and October 2007. The implementation date of the Market Data Rules was in April 2007.
• Order Protection Rule (Rule 611): This rule requires trading centers to “[. . .] establish, maintain, and enforce written policies and procedures that are reasonably designed to prevent trade-throughs on that trading center of
protected quotations[. . .]” (RegNMS, Rule 611(a)). A trade-through
hap-pens if an order is executed worse than the best available price across trading venues that is represented by immediately for automatic execution accessi-ble quotes. Thus, this rule does not protect hidden orders or manual quotes
15A detailed description of the new regulation and its impact on market quality is offered by Barclay
Markets in Financial Instruments Directive 17 and only takes outstanding limit orders at the top of the order book into
account.16 It also covers small and large share quotations which were not
covered under ITS. Most importantly, there is a uniform regulation for all exchange-listed stocks, no matter whether listed on the NYSE or Nasdaq.
• Access Rule (Rule 610): This rule changed existing regulation significantly.
First, it enables fair and efficient access to quotes of any trading center al-lowing for the use of private linkages by different connectivity providers. Second, it limits the fee for a trading center to access protected quotations. Finally, trading venues are required to prevent their members to post quotes that lock or cross protected quotations on any other trading venue.
• Sub-Penny Rule (Rule 612): This rule specifies that any kind of exchange
platform is not allowed to “[. . .]display, rank, or accept from any person a
bid or offer, an order, or an indication of interest in any NMS stock priced in an increment smaller than $0.01 if that bid or offer, order, or indication of interest is priced equal to or greater than $1.00 per share” (RegNMS, Rule 612(a)). Flickering quotes and loss of execution priority by a nominal amount can distort price formation. The SEC therefore sets a minimum threshold of price variation.
• Market Data Rules (Rule 601 and 603): These rules establish a new regime
for the functioning of the single market data consolidator. Revenues gen-erated from market data fees are allocated on the basis of a trading venue’s contribution to best quotes.
The U.S. equity trading landscape was always more fragmented than its European counterpart. However, price-priority across trading venues is enforced and trading venues are virtually integrated via ITS, private linkages, and consolidated quotation and trade reporting systems. ECNs captured a significant market share in Nasdaq and NYSE-listed stocks. They are organized as electronic open limit order book markets and compete for order flow on the basis of low trading costs, trader anonymity, and
16Manual quotes are quotes entered on a ‘slow’ trading venue that does not offer automatic execution,
18 European Equity Market Structure fast executions. Chapter 3 discusses the literature on market fragmentation and ECNs in detail.
Conclusion. Both, MiFID and RegNMS have the purpose to foster competition and
to enhance investor protection. However, a closer look reveals substantial differences: First, MiFID does not establish formal linkages between trading centers. Investment firms have to decide whether they connect to different trading venues or use interme-diary connectivity. Smaller investment firms may decide to avoid high connectivity costs and only connect to the most important markets. U.S. equity exchanges are elec-tronically linked to facilitate an integrated national market. Second, under MiFID the investment firm is obliged to define and implement a best execution policy. Under RegNMS, trading venues are required to establish, maintain, and enforce best execu-tion. Third, MiFID defines best execution on the basis of multiple factors such as execution price, explicit trading costs, speed, and probability of execution. RegNMS specifies that price alone matters and any order must be forwarded to the trading venue with the best available quote for execution. Fourth, European regulation does not es-tablish a single data consolidator. There is no public consolidated tape integrating
order book information from various trading venues.17 MiFID only requires market
operators to publish certain pre- and post-trade information as discussed above.
There is an onging debate among practitioners and academics about the impact of
differences in MiFID and RegNMS on market quality. Petrella (2010) argues that “[. . .]
the consolidation of market data and the disclosure of execution quality information
appear to be more effective [. . .] in strengthening competition for order flow among
trading venues” under RegNMS. Stoll (2001), however, points out that a formal linkage may impede innovation and causes high infrastructure costs. Both studies rely on well-founded arguments but the authors do not assess empirically the question if market efficiency can be ensured without a formal linkage. This question is elaborated in Chapter 6.
17There are, however, commercial products available. For example, Thomson Reuters offers a
consoli-dated data stream, see http://thomsonreuters.com/products_services/financial/financial_products/
Details on the UK Equity Market 19
2.2 Details on the UK Equity Market
This section provides a brief description of the history of the LSE and highlights im-portant market developments in the UK after the introduction of MiFID in Novem-ber 2007. As discussed in the previous section, MTFs, such as Chi-X, BATS, and Turquoise, became serious competitors of traditional European exchanges during the last years. The UK equity market is particularly suitable for an analysis of the impact of MiFID on competition and market quality for at least two reasons. First, it is the most fragmented equity market in Europe and second, the UK, especially London, has a long tradition as a market place and 20.0% of the European equity trading volume
was still centered at the LSE in 2010.18 The Financial Times Stock Exchange index 100
(FTSE 100) is a well-known blue-chip stock market index. It is an arithmetic average, value-weighted index of the top 100 stocks in terms of market capitalization, listed at the LSE. To assess changes in the UK equity market structure and trading practices, the following subsections describe the market structure on the LSE over time, report trading volume and market share statistics in FTSE 100 constituents, and explore insti-tutional details of the LSE, Chi-X, BATS, and Turquoise.
I. Reforms and technological changes on the LSE
Table 2.3 depicts the most important developments in the history of UK equity trad-ing. Regulated trading on the LSE started on March 3, 1801. It has a long tradition as floor-based broker-dealer market. The following details are based on Clemons and Weber’s (1995) article that offers a well-organized description of trading at the LSE. Similar to the specialist system of the NYSE, ‘jobbers’ were responsible for making the market. They hold inventory for their own accounts, selling to brokers whose cus-tomers wanted to buy and buying from brokers with sell orders. The so-called single capacity system prevented firms to perform both jobber and broker functions at the same time. Specifically, jobbers acted as intermediaries between brokers.
Deregulation and introduction of SEAQ. In October 1986, the LSE switched to an
open, electronic screen-based quotation system, called the Stock Exchange Automated Quotation system (SEAQ). Simultaneously, numerous changes occurred, including the
18See Equity Market Report 2010 of the Federation of European Exchanges (FESE),
20 European Equity Market Structure liberalization of broker-dealer commissions, the replacement of the single with a dual capacity system, and the opening of dealer-ships to banks and other financial institu-tions (Clemons and Weber, 1995). Dual capacity means that an investment firm can act on SEAQ as an agent for its customers (broker) and be a jobber (dealer) transact-ing its own business. These market reforms are known under the term ‘Big Bang’ and had the purpose to encourage competition and to reduce execution costs. The market structure under SEAQ resembles the Nasdaq market. On SEAQ, competing market makers were obliged to enter two-way quotes for no less than the minimum quantity in stocks for which they were registered. This minimum size was determined on the basis of the trading volume over the previous year per stock. In the case where a mar-ket maker displayed a larger quantity of shares than the minimum quantity, her quotes were firm in the sense that incoming orders have to be executed against the displayed quantity. Market markers were eligible for relief from the stamp duty, allowed to short sell, and could use the Inter-Dealer Broker (IDB) system. Stamp duty is a form of tax charged for each share transaction in the UK. While quote display systems were au-tomated through SEAQ, order execution was arranged over the phone. Trades were
finally reported on SEAQ.19
Introduction of SETS. The second central market reform at the LSE was the
intro-duction of the Stock Exchange Trading System (SETS), an electronic open limit order book, which was introduced in October 1997. However, the broker-dealer network was retained in parallel and also today investors can choose to negotiate a trade with a broker-dealer (‘off book’) or trade in the electronic limit order book. The LSE re-moved the obligation of broker-dealers to provide two-way quotes on SETS. Liquidity
19There are a number of studies analyzing market quality and trading behavior on SEAQ. Abhyankar
(1995) provides evidence that equity and futures markets are more integrated after the introduction of SEAQ. He attributes this finding to a higher level of equity market efficiency after the Big Bang relative to the futures market. Jong de et al. (1995) compare French stocks listed on the Paris Bourse, an order-driven market, and traded on the LSE’s SEAQ International. The London market provides less favorable execution quality for all except the largest trade size category. Gemmill (1996) analyzes the impact of anonymity for block trades on SEAQ between 1987 and 1992 by different publication rules. Kleidon and Werner (1996) show that prices of UK cross-listed stocks on SEAQ and the NYSE and American Stock Exchange (AMEX) are not integrated. See Abhyankar et al. (1997) for an intraday analysis of quoted spreads, trading volume, and volatility on SEAQ. Reiss and Werner (1998) find that broker-dealers use the IDB system to share inventory risk. Further, Hansch et al. (1998) show that inter broker-dealer trading is driven by inventory changes. It appears that there is a negative relationship between price improvements a dealer offers and trade sizes a broker submits (Bernhardt et al., 2005).
Details on the UK Equity Market 21
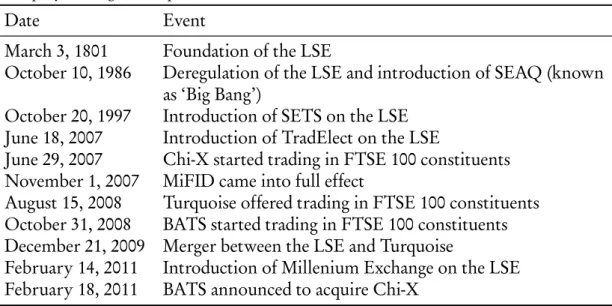
Table 2.3:UK equity market history. The table highlights important events that shaped the
UK equity trading landscape.
Date Event
March 3, 1801 Foundation of the LSE
October 10, 1986 Deregulation of the LSE and introduction of SEAQ (known
as ‘Big Bang’)
October 20, 1997 Introduction of SETS on the LSE
June 18, 2007 Introduction of TradElect on the LSE
June 29, 2007 Chi-X started trading in FTSE 100 constituents
November 1, 2007 MiFID came into full effect
August 15, 2008 Turquoise offered trading in FTSE 100 constituents
October 31, 2008 BATS started trading in FTSE 100 constituents
December 21, 2009 Merger between the LSE and Turquoise
February 14, 2011 Introduction of Millenium Exchange on the LSE
February 18, 2011 BATS announced to acquire Chi-X
provision through limit orders is voluntary. Limit orders are sorted by their price and, in case of equality, by the time of their arrival (price-time priority). Initially, SETS was only available for FTSE 100 constituents. In September 1999, FTSE 250 constituents were transferred to SETS, too.
According to Naik and Yadav (1999) and Friederich and Payne (2007), there were three main reasons which led to this market reform: First, it was widely agreed that opacity and trading costs incurred by retail investors were especially high on the LSE. Second, UK regulatory authorities removed certain quoting restrictions for broker-dealers on domestic alternative electronic trading networks opening the market for more competition. Third, many European exchanges moved to fully electronic limit
order trading and increased the competitive pressure on the LSE.20 To date nearly all
exchanges operate fully automated electronic limit order books. There are several ben-efits associated with this kind of market structure. First, investors can decide to buy or sell at specific prices (limit order) or to trade at the best available price (market order). Limit orders give control over the execution price but execution is not certain (execu-tion risk). Market orders provide immediacy but the execu(execu-tion price may vary from
20Various European exchanges introduced fully electronic trading systems in the 1990s. For example,
Euronext started trading on the Nouveau Système de Cotation (NSC) in 1988 and Deutsche Boerse on the Integrierte Börsenhandels- und Informations-System (IBIS) in 1991. See Jain (2005) for a list of electronic and floor-based trading systems at international exchanges.
22 European Equity Market Structure the last observable price (price risk). Second, investors are able to observe the entire order book on a timely basis, evaluating trading interests of buyers and sellers. Third,
order execution costs are expected to be lower due to electronic order execution.21
Further developments. In June 2007, the LSE introduced its new trading and
infor-mation platform called TradElect to further enhance trading speed and infrastructure
efficiency.22 To strengthen its competitive position and to “[. . .] capture a healthy
slice of the market’s growth potential”23, the LSE aggreed to merge its dark pool unit
Baikal with Turquoise on December 21, 2009. The aquisition was completed in Febru-ary 2010 leaving the LSE with 60.0% of the new company. The existing shareholders, international investment banks, still own 40.0% of the new company. In February 2011, the LSE switched trading from TradElect to Millennium Exchange to enhance trading speed and infrastructure reliability. This step may attract algorithmic order flow which is considered to be predominantly executed on MTFs.
II. Competition between the LSE and MTFs
FTSE 100 constituents are listed on the LSE. Trading is also possible on various MTFs that differ in technology, trading costs, and execution speed. The most successful MTFs in terms of market share in FTSE 100 constituents are Chi-X, BATS, and Turquoise. Under MiFID, the LSE and the three MTFs are regulated through the British Financial Service Authority (FSA). MTFs aim to attract order flow from algorithmic and high-frequency traders. To do so they offer fast trading platforms with high throughput rates and low trading fees. The throughput rate is defined as the average number of messages a trading system can process during a period. It is especially important for automated trading strategies which rely on fast order submissions and cancellations.
21There are different studies after the introduction of SETS in 1997. Naik and Yadav (1999) analyze
spread measures of FTSE 100 and FTSE 250 constituents in 1998 and for two control periods in 1994 and 1996. They find that trading costs for retail investors decreased under SETS. Overall, their results suggest that allowing limit orders to compete for order flow reduces the market power of broker-dealers (see Barclay et al. (1999) for similar results on Nasdaq). Ellul et al. (2002) study trading through SETS and broker-dealers at the open and close of a trading day. They argue that broker-dealers provide useful additional liquidity. Intraday patterns of quoted spreads, trading vol-ume, and volatility for SETS and SEAQ instruments are examined by Cai et al. (2004). Lai (2007) examines the impact of SETS on trading quality in FTSE 250 constituents. Friederich and Payne (2007) provide evidence that investors’ choice of trading on SETS or with broker-dealers depends on order characteristics and market liquidity.
22The LSE still uses the acronym ‘SETS’ for its electronic order book.
Details on the UK Equity Market 23
Market entry of MTFs. Chi-X, the largest MTF, started trading in German and
Dutch blue-chip stocks about six months ahead of MiFID on March 30, 2007. Eleven FTSE 100 constituents became available on Chi-X at the end of June 2007 and the full list of FTSE 100 constituents in August 2007. BATS began trading of ten FTSE 100 constituents by the end of October 2008. All FTSE 100 constituents were available for trading one week later. BATS is operated by BATS Europe, a subsidiary of the U.S. company BATS Global Markets. In February 2011, BATS agreed to combine with
Chi-X Europe.24 Previously, Chi-X Europe was owned by Instinet, a subsidiary of
No-mura Holdings, and a number a major investment banks and broker houses. Turquoise started trading in five FTSE 100 constituents on August 15, 2008. The roll-out of the entire universe of FTSE 100 constituents was completed by the end of the month. The ownership structure of MTFs is an important detail. Investment firms may predomi-nately submit orders to trading venues where they are shareholder.
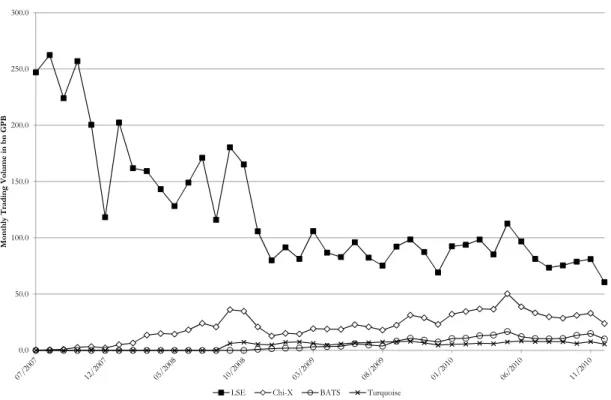
MTF market shares. Figure 2.1 and Figure 2.2 depict the development of trading
vol-ume in FTSE 100 constituents on the LSE, Chi-X, BATS, and Turquoise and the cor-responding market shares between July 2007, the month Chi-X started trading in UK
instruments, and December 2010.25 These four trading venues account for roughly
95.0% of trading volume generated on regulated markets and MTFs during the obser-vation period. Figure 2.1 shows that the LSE lost a significant fraction of trading vol-ume in FTSE 100 constituents between 2007 and 2010. There are mainly two reasons for this development. First, trading volume has not yet recovered to the level before the financial crisis and second, Chi-X, BATS, and Turquoise captured a considerable fraction of trading in FTSE 100 constituents. To assess the level of competition, Fig-ure 2.2 presents market shares for Chi-X, BATS, and Turquoise. The LSE market share is by construction one minus the sum of market shares across all MTFs. Chi-X was able to capture a significant fraction of trading over the last three years, reaching about 25.0% market share in FTSE 100 constituents in the first quarter of 2010, an all-time high. BATS steadily increased its market share to almost 10.0% in December 2010. Turquoise reports a lower market share than BATS since October 2009. Its average monthly market share fluctuated between 5.0% and 6.0%.
24See http://www.batstrading.co.uk/resources/press_releases/BATS_Chi-X_SPA_FINAL.pdf.
25Daily closing prices and number of shares traded are obtained from the Securities Industry
Re-search Centre of Asia-Pacific (SIRCA). I thank SIRCA for providing access to the Thomson Reuters
24 European Equity Market Structure 0.0 50.0 100.0 150.0 200.0 250.0 300.0 Monthly Tradi ng V olume in bn GPB
LSE Chi-X BATS Turquoise
Figure 2.1:FTSE 100 trading volume on the LSE, Chi-X, BATS, and Turquoise. The figure
shows average monthly trading volume of FTSE 100 constituents on the LSE, Chi-X, BATS, and Turquoise from July 2007 to December 2010. First, daily market shares are obtained by multiplying the daily closing price of an instrument on each trading venue with the correspond-ing number of shares traded. Second, daily tradcorrespond-ing volume is averaged across instruments on a monthly basis.
III. Institutional details
In the following three paragraphs, I outline important market features and develop-ments that are relevant for the two observation periods in 2009 and 2010 used through-out my thesis (see Chapter 4.1). In general, a competitive UK trading environment re-sulted in regular trading infrastructure upgrades on all platforms and frequently chang-ing fee schedules.
Trading mechanism. While regulated markets and MTFs compete primarily on
tech-nology and trading costs, the LSE, Chi-X, BATS, and Turquoise provide the same basic market model. They all operate an electronic, fully integrated limit order book which
combines both visible and hidden liquidity.26 Iceberg orders that only display a
por-tion of their total volume are available on all four trading venues. Fully hidden limit orders are not visible to any investor and have to meet the large in scale considerations
Details on the UK Equity Market 25 0.0% 5.0% 10.0% 15.0% 20.0% 25.0% 30.0% Monthly Market Sh are
Chi-X BATS Turquoise
Figure 2.2: FTSE 100 market share of Chi-X, BATS, and Turquoise. The figure shows
average monthly market shares of FTSE 100 constituents on Chi-X, BATS, and Turquoise from July 2007 to December 2010. First, daily market shares are obtained by multiplying the daily closing price of an instrument on each trading venue with the corresponding number of shares traded. Second, daily market shares are averaged across instruments on a monthly basis.
of MiFID.27In general, orders are executed according to ‘price-visibility-time priority’,
i.e. displayed orders have priority over non-displayed fractions of iceberg orders and fully hidden orders with the same price. The LSE introduced fully hidden limit orders on December 14, 2009.
As discussed above, the LSE trades FTSE 100 constituents on SETS. In
addi-tion, broker-dealers may provide liquidity off book.28 Continuous trading starts at
8:00 a.m. GMT on all four trading venues and lasts until 4:30 p.m. GMT. In addition to limit orders, market orders, iceberg orders, and fully hidden orders, Chi-X, BATS,
27MiFID requires all regulated markets and MTFs to be pre-trade transparent. An exception are
orders that are large in scale compared with normal market size (Directive 2004/39/EC,
Ar-ticle 22(2)). Normal market size is provided by ESMA and reviewed on a yearly basis, see
http://mifiddatabase.esma.europa.eu/.
28According to the LSE, the majority of trades is executed ‘on book’, for example, in April 2011, 98.0%
of the total number of exchange-reported trades and 82.0% of total exchange-reported trading volume (information obtained from the LSE per e-mail).
26 European Equity Market Structure and Turquoise offer pegged orders. The execution price for this type of order is de-termined based on a reference price such as the European Best Bid and Offer (EBBO). Executions on the three MTFs are subject to a price check. Possible trades are not executed if the execution price is in a certain range above or below the EBBO.
Trading Speed. MTFs offer potential benefits to speed-sensitive investors such as
al-gorithmic and high-frequency traders. A delay in the time it takes to process a trade may result in missed trading opportunities, misplaced liquidity, and higher risk expo-sure. Technically, MTFs offer on average eight to ten times higher trading speed than the LSE during the observation periods. For example, in May 2010, BATS reports an
average order latency of 200 microseconds.29 In October 2010, following its migration
to a new trading system, Turquoise claimed to be the world’s fastest trading platform
with an average order latency of 126 microseconds.30
Fee schemes. Algorithmic and high-frequency traders are very sensitive to explicit
trading costs. The LSE, Chi-X, BATS, and Turquoise feature a maker/taker pricing
scheme, i.e. investors are charged for aggressive orders that take liquidity from the order
book and rebated for passive orders that supply liquidity. In April/May 2009, investors
pay between 0.45 bps and 0.75 bps for an aggressive order on the LSE and receive a rebate up to 0.40 bps. Chi-X and BATS charge an aggressive order with 0.28 bps and rebate a passive order with 0.20 bps. On Turquoise investors pay 0.28 bps for an aggressive order and receive a rebate of 0.20 to 0.24 bps for a passive order depending on their trading volume during the previous month.
The LSE switched back to a traditional fee schedule on September 1, 2009. Investors are charged between 0.20 bps and 0.45 bps for both aggressive and passive orders. On May 4, 2010, the LSE introduced two additional rates for high-volume traders that run in parallel with the LSE’s existing fee schedule. The first new rate waives trading fees of passive orders for firms providing a large amount of liquidity. The second new rate charges 0.29 bps for an aggressive order. Investors have to apply to be included in the new rate groups and have to meet specific criteria such as a high prior trading volume. Over the second observation period in 2010, BATS charges an aggressive order with
0.28 bps and rebates a passive order with 0.18 bps. Maker/taker fees on Chi-X and
Turquoise are the same as in the first observation period.
29See http://www.batstrading.co.uk/resources/participant_resources/BATSEuro_Latency.pdf.
Chapter 3
Related Work
Market microstructure literature offers a broad range of topics. For the purpose of this thesis, I focus on theoretical and empirical studies on competition between trading venues. Section 3.1 summarizes the findings on costs and benefits of fragmentation and explores parallels between ECNs in the U.S. and MTFs in Europe. Section 3.2 looks at the impact of recent innovations in information and communication technologies on the way trading presently takes place in a fragmented trading environment. The literature on exchange infrastructure as well as algorithmic trading provides important implications on competition and market quality.
3.1 Intermarket Competition
A. Theoretical LiteratureFrom a theoretical perspective, Mendelson (1987) analyzes the effect of fragmentation on various platforms. He finds that there may be a detrimental effect of market frag-mentation on market and trading characteristics resulting from the proliferation of alternative trading venues. Comparing a consolidated ‘clearing house’ and fragmented ‘clearing houses’, his model demonstrates that fragmentation reduces the expected
trad-ing volume, increases price variance, and reduces expected gains from trade.1
The literature also describes the effect of network externalities on liquidity. Intu-itively, if two markets are combined into one, trading volume concentrates on the sin-gle market resulting in a higher probability that investors meet and that bid-ask spreads