Worcester Polytechnic Institute
Digital WPI
Major Qualifying Projects (All Years) Major Qualifying Projects
May 2017
Forex Trading Toolkit
Andrew Tautkus
Worcester Polytechnic Institute
Jason Matthew McKinney
Worcester Polytechnic Institute
Follow this and additional works at:https://digitalcommons.wpi.edu/mqp-all
This Unrestricted is brought to you for free and open access by the Major Qualifying Projects at Digital WPI. It has been accepted for inclusion in Major Qualifying Projects (All Years) by an authorized administrator of Digital WPI. For more information, please [email protected].
Repository Citation
1
Creating an Open Forex Trading Toolkit
A Major Qualifying ProjectSubmitted to the Faculty of Worcester Polytechnic Institute
In Partial Fulfillment of the Requirements for the Degree in Bachelor of Science
In Computer Science By __________________________________ Jason McKinney __________________________________ Andrew Tautkus Date: 4/21/2016 Project Advisors: __________________________________ Professor Xiangnan Kong
This report represents work of WPI undergraduate students submitted to the faculty as evidence of a degree requirement. WPI routinely publishes these reports on its web site without editorial or peer
review. For more information about the projects program at WPI, see http://www.wpi.edu/Academics/Projects.
2
Abstract
The goal of this project was to create an open and flexible framework with which researchers or traders can use to develop new and innovative trading tools for free. The
framework will provide traders and developers a way to access live currency data in a format of their choice outside of a trading platform. Currently no free framework like this exists which severely limits the development of external trading systems and software. We demonstrate the utility of this framework with an AI trading advisor, which uses open market data to rank user created trading models and to make trade suggestions based on the best performing models. The AI utilizes multiple trading strategies in the hopes of creating a more flexible trading system able to adapt to any market conditions.
3
Table of Contents
Abstract...2 Table of Contents...3 List of Figures...5 Chapter 1: Introduction...61.1 What is Forex Trading………...6
1.2 MetaTrader……….7
1.3 Motivation………..8
1.4 TrueFX………...9
1.5 Objectives………10
Chapter 2: Developing a Flexible Bar System, Database and API………11
2.1 What Are Candlesticks………11
2.2 Building A Database and API……….…....13
2.3 Expanding the System……….…15
Chapter 3: Developing a Trading System………..…………16
3.1 What is A Trading Strategy……….16
3.2 The Limitations of a Single Trading Strategy………..17
3.3 A Multiple Strategy System………20
Chapter 4: Our Trading System……….21
4.1 Overview………..22
4.2 The Strategy Class………...…22
4.3 Strategy Evaluation………..23
Chapter 5: The Strategies………...27
5.1 Populating the System with Strategies……….27
4
5.3 Three Bar High Strategy……….……….………..………..29
5.4 Inside Bar Strategy………..……….30
Chapter 6: Conclusion and Future Work……….……..31
5
List of Figures
Figure 1: Candlestick Basics………..………12
Figure 2: Candlestick chart Example………...13
Figure 3: API Framework Diagram………..….15
Figure 4: Simple Three Bar Strategy Example………..…16
Figure 5: Three Bar Strategy Working Correctly……….……….……18
Figure 6: Three Bar Strategy Working With Wrong Parameters Values……….….…19
Figure 7: Three Bar Strategy in Bad Market Conditions……….……….…20
Figure 8: Forward Chaining……….………..26
Figure 9: Five Bar Strategy Example……….29
Figure 10: Three Bar High Strategy Example………...30
6
Chapter 1: Introduction
1.1 What Is Forex Trading
There are many different finical markets that individuals or groups can trade in. One of these markets is the foreign exchange market or Forex market. The Forex market is a global decentralized market for trading currencies. As far as trading volume goes the Forex market is the largest market in the world with over a trillion dollars in trading volume per day. Participants in the Forex market range from large international banks, to individual traders. Due to the
sovereignty issue when involving two currencies the Forex market has almost no entity supervising it and regulating its actions.
The Forex market is closed to the average individual. Because of this if one wishes to place trades in the market they must go through a registered broker. These brokers have access to the market and for a small charge will place your trades for you. An online platform is usually used for this type of communication and transaction. These online platforms also provide the trader with live data streams of the current prices as well as different ways to view and analyze the data.
When trading in the Forex market it is necessary to purchase a currency pair which utilizes the exchange rate between the two currencies to generate a price. While it is possible to trade almost any currency pair, there are four major pairs that are mainly traded due to the stability of the currencies involved. These four pairs are EUR/USD, USD/JPY, GBP/USD and USD/CHF. These currency pairs are usually traded by purchasing what is known as standard lots of them. One standard lot is roughly equal to $100,000. Now since the average trader doesn’t usually have access to this kind of money leverage is often used to magnify the amount of
7
currency a trader can buy. Leverage essentially works by having the broker lend the trader money that they then use to purchase currency pairs with. For example say a trader wants to buy a standard lot of EURUSD, but their account size is only $10,000. They can use a 10:1 leverage to do so. This means they would be borrowing $90,000 from their broker. The general broker usually lets trader leverage up to 200:1. Leverage is key in allowing individual traders to make money in the Forex market.
While traders can buy standard lots of currency pairs and sell them at a later time for a profit if the value of that pair has increased, traders can also preform what’s known as a short. This is when the trader borrows some currency from their broker and sells it immediately. They can then buy it back at a later time and give it back to the broker for a profit if the value of that pair decreased from when they first sold it. Shorting the market is a valuable tool because it allows a trader to make money if they think that pair’s value is going to decrease. Using the concept of leverage as well as buying and shorting currency pairs, it is possible for an individual trader to participate in the Forex market.
1.2) MetaTrader
MetaTrader is an electronic online currency trading platform. It was developed
MetaQuotes Software and released in 2005. The software is licensed to brokers who provide the software to their clients who are individual traders wishing to trade in the Forex market.
MetaTrader consists of both a client and a server component. The server component is controlled by the broker while the client part is provided to the broker’s customers and used to see live price charts as well as place orders in the market. MetaTrader offers the ability to trade manually, but
8
the feature that made the platform so popular is that it allows users to write scripts that can automatically trade for them. This is what is known as algorithmic trading and it’s very popular. It is because of this feature that MetaTrader became the industry standard Forex trading platform and it is estimated that around 75% of individual traders use MetaTrader to trade in the Forex market.
The ability to write code within MetaTrader is a very powerful feature. Not only can a trader write automated trading scripts known as expert advisors, they can also write custom indicators as well. These custom indicators can be anything from a simple modified moving average to an advanced support and resistance indicator. These indictors can even be displayed on a live currency chart. Expert Advisors can use these indicators to place trades or a trader can look at them and use them to manually place trade. The ability to write expert advisors and indicators makes MetaTrader a very powerful platform for currency trading. However, these features come with their limitations as well.
1.3) Motivation
Within MetaTrader, there is no way to apply any kind of machine learning or incorporate external libraries into these indicators and expert advisors. This means that traders are forced to limit what their strategies can do to features contained inside MetaTrader. This is a problem because it completely removes things such as machine learning as well as other concepts from trader’s strategies because it is not possible to do within MetaTrader. This means a trader who wishes to apply some kind of machine learning or wants to use a program such as TensorFlow to help with their strategy would have to do it outside of MetaTrader and then place the trades manually. There are several issues with this though.
9
To start, MetaTrader offers no API to get the live data out of MetaTrader. You can obviously download historical data, but if you are trying to trade live having the historical data alone isn’t enough. You need a live stream of data and there is no good way to get this externally from MetaTrader. Therefor if you wish to build some kind of indicator or strategy outside of MetaTrader you need to find another way to get live data. This is a problem because free live data is very hard to come by and is not in an ideal format for building strategies with. This is just another issue that prevents strategies and indicators from being built outside MetaTrader. With all these issues, it discourages anyone from developing software outside of MetaTrader which is an issue we intend to fix.
1.4) TrueFX
There are several sources of free live Forex data online. However most of these sources are not very good and don’t update frequently enough or are just not very accurate. Luckily, after searching through all the free sources of data we discovered TrueFX. TrueFX is a platform that provides historical and real-time forex market data that is both accurate and updates frequently. This is very valuable because it allows developers to create their own trading systems in
whatever language or environment best suits their needs. There is however one issue with TrueFX. The data updates every couple milliseconds which means you get a bunch of raw data from each currency pair with no real organization which makes it very difficult to process. This can present an issue for a developer who is looking to develop an external strategy, but doesn’t know how to process and store all the raw data.
10
1.5) Objectives
There are several key issues that heavily discourage the development of trading systems outside of platforms like MetaTrader. The first is there is no good way to get live data out of MetaTrader. In a perfect world MetaTrader would have a nice API that you could send requests to and it would send you back data. However, since MetaTrader wants to force people to use their platform this is not the case. This means it is necessary to find another source of data in order to develop an external trading system. The second major issue is that while platforms like TrueFX do exist to provide with you with free live data, most of them aren’t very good. TrueFX is the exception to this, but it still comes with the major drawback that its data is raw and
unformatted. It only provides millisecond updates to the values of the popular currency pairs. The final issue is that if an external trading system were to be developed, there would be no way to make it automated since there is no good way to connect it to a trading platform such as MetaTrader. Therefor the system would only be able to recommend trades and you would need to place them manually in a trading platform.
Our first objective was to use the TrueFX platform to create a flexible API for processing and presenting raw data in different formats such as candlesticks. This allows for easy access to live and historical data in a format that is very practical and commonly used by traders. Now traders can make a simple request to the API and not have to worry about the formatting or processing to get the data they need. This solves the data issue that is such a problem in building an external trading system.
Our second objective was to develop a backend system with a database for processed data with which the API pulls from. An API is useless unless it has a strong backend and well
11
organized database to pull from. This will make sure that our API is able to handle large amounts of request and provide a quick response with the necessary data. This will further solve the data issues that limit external trading systems.
Our final objective is to build an AI trading assistant in Python and React.JS using the API to demonstrate the flexibility of the backend system. This part is essentially developing an external trading system using the API we build to demonstrate how easy the API makes
developing an external system. On top of just showing of how effective the API is we fully intend for our system to be able to successfully recommend trades as well.
Chapter 2: Developing a Flexible Bar System, Database and API
2.1) What are Candlesticks
One of the most popular ways for traders to display price data is what’s known as a candlestick or bar. The idea behind a candlestick is to take all the data points contained within one time interval and condense them into one graphical object that is much easier to look at and interpret. These candlesticks also help to filter out a lot of the noise that you will inevitable get when you get a new data point every couple milliseconds. Candlesticks contain multiple parts as seen in the figure below. The high of the candlestick represents the highest price within that time interval while the low represents the low of that interval. The open is the price at which that interval started and the close is the price at which the interval ended. If the open of the interval is less than the close, the candlestick will be green. However, if the close is less than the open, the candlestick will be shown as red. While one candlestick contains a lot of information about the price movement, traders often look at an entire chart of them.
12
Figure 1: Illustrates the different parts of a candlestick
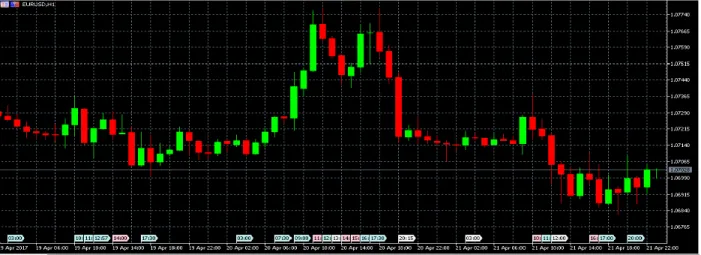
With an entire chart of candlesticks, it is possible to see the price movement over a long period of time. This would not be possible if all the data points were not consolidated into individual candlesticks due to the fact that there would simply be too many data points to display. Below is an example of what a simple candlestick chart looks like in which each candlestick represents an hour of data. Looking at the chart is very easy to see the price movements as well as which hours the currency pair moved a lot and the hours in which there wasn’t much movement. All this information is very important to a trader and without it there is no way they would be able to trade successfully or build a successful trading system.
13
Figure 2: Illustrates a candlestick chart. Each candlestick represents one hour of data points.
2.2) Building A Database and API
As discussed early raw data by itself is of little use to a trader and in order to build a trading system the data needs to be formatted into a more interpretable format such as candlesticks. From here, a trader can begin to build a trading system. Because of this it is essential that a flexible API be developed that can provide candlesticks for a requested time period for any time interval. This way a trader looking to build a trading system can get the data formatted in the way that they need in order for them to build a successful trading system. It is also important to note that since the formatted data can be accessed through an API, the trader looking to build a trading system can use what every software and tools they want and still have access to the data. This API is also a very important part of how we built our own trading system.
In order to build such a system the first step was to build a database. Without a database containing all the data points to pull from, there would be no way for the API to provide the necessary data. This database also needed to be organized in a way that it could quickly handle
14
the millions of data points it needed to contain while at the same time allowing for database quarries to be quick and efficient. To do this we have each entry in the database contain the currency pair, the bid price, the ask price and then the timestamp. Database queries can then use the timestamp as a way to select the most recent data as well as put it in order. Once we had a good way to organize the data in the database, we still needed to solve the issue of how to populate the database with data as well as keep it continuously up to date.
To do this we wrote a Python script that runs on the same server as the database. This script continuously pulls the data from TrueFX and adds it to the database in real time. This script only solved the issue of keeping the database up to date. We still needed to use TrueFX’s historical data stash to backfill the database. After this was accomplished, we then had a database that contained both historical data for all the major currency pairs as well as live up to date data.
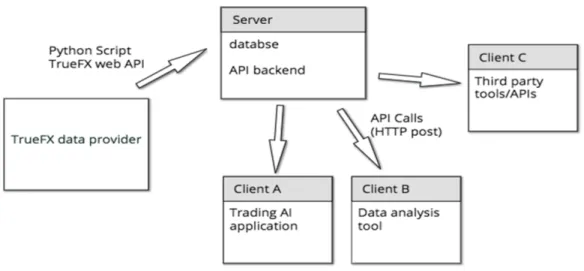
Once we had the database implemented we could then build the actual API. To do this we used Flask. Flask is a micro web framework written in Python that makes building a flexible robust backend very simple. To use the API the request must contain a currency pair, the amount of candlesticks needed, and the time length of the candlestick. A start and end date can also be used instead of a candlestick amount. An example request would be to request 100 hour
candlesticks of the currency pair EURUSD. The Flask API would then query the database for the necessary data points. From there it would construct the requested candlesticks using that data and then send those candlesticks in JSON format as a response to the initial request. A diagram of this system can be seen below.
15
Figure 3: A diagram of the framework we built to provide Forex data
2.3) Expanding the System
Due to the limited time we had for the project there was only so much we had time to add. However there is still plenty of room for expanding the API and database system to make it even more quick and efficient. One of the main things that would significantly increase
performance would be to implement a candlestick caching system. This would allow for popular and recently created candlestick requests to be stored on the server. That way if they were requested again the API would not have to query the database and rebuild the candlesticks, but could just use the cached candlesticks instead. This would greatly improve the speed at which the API would be able to respond to requests. While there are many other improvements we could make as well, due to the time constraint of the project they were not possible.
16
Chapter 3: Developing a Trading System
3.1) What Is a Trading Strategy
Once we had a functioning API built it was then possible to being building a trading system. However before discussing the trading system it is important to understand what a trading strategy is because it is a fundamental concept in any trading system. A trading strategy can be broken up into several parts. The first is what’s known as an entry condition
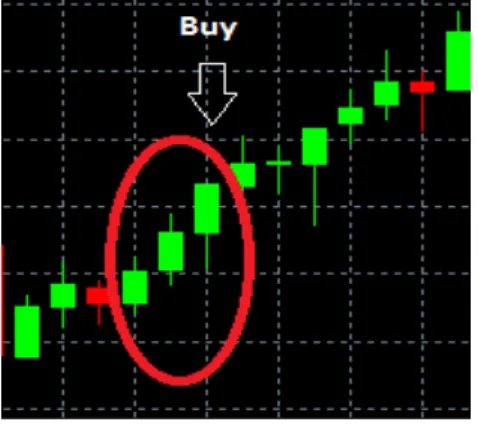
An entry condition is a rule or condition that says when you are going to enter the market. A trading strategy has one or more of these conditions and they can vary in complexity. For example, a simple entry condition would be to buy every time there are three green bars in a row. However, this entry condition is much too simple and would never be effective. A more realistic example would be to buy every time there are three green bars in a row where the high of each consecutive bar is higher than the previous. An example of this entry condition in action can be seen below. Having an entry position is only half the battle. Once you open a position, you still need to determine when to close it. To do this we use what’s known as exit conditions
17
A trading strategy must also have at least one exit condition, but most usually have multiple. These conditions say when to exit the market once a position has been opened. There are three main types of exit conditions. The first is what’s known as a sell limit. A sell limit is a condition that says you will close the position after a certain price increase from when you initially bought. For example if you bought EURUSD at 1.1001, a sell limit exit condition could be to sell as soon as the price hits 1.1021. The second type of exit condition is what’s known as a stop-loss. This type of exit condition is used to protect against excessive loss. A stop-loss is basically the opposite of a sell limit and says if the price decreases by a certain amount you will close your position. An example of this is if you bought EURUSD at 1.1001 to sell if the price goes down to 1.0001. The final kind of exit condition is closing your position based on some indicator or pattern in the chart. A simple example if this could be to sell as soon as you see two red bars in a row. Entry and exit conditions are the two fundamental parts of a trading strategy. The hard part is determining what they should be.
3.2) The Limitations of a Single Trading Strategy
There are many different aspects of the Forex market that constantly changes making the market conditions vary greatly at any given time. Because market conditions are always
changing it makes it very hard for a single strategy to consistently perform well. This is due to the fact that a trading strategy has a fixed set of entry and exit conditions that are ridged and unchanging while the market is constantly changing. Because of this, what ends up happing is that strategies tend to only perform well during certain market conditions due to the fact that they can’t adapt and change to fit all market conditions. It is like trying to fit a linear model to
nonlinear data. It is only going to be able to perform so well because it’s simply not flexible enough to fit all the data.
18
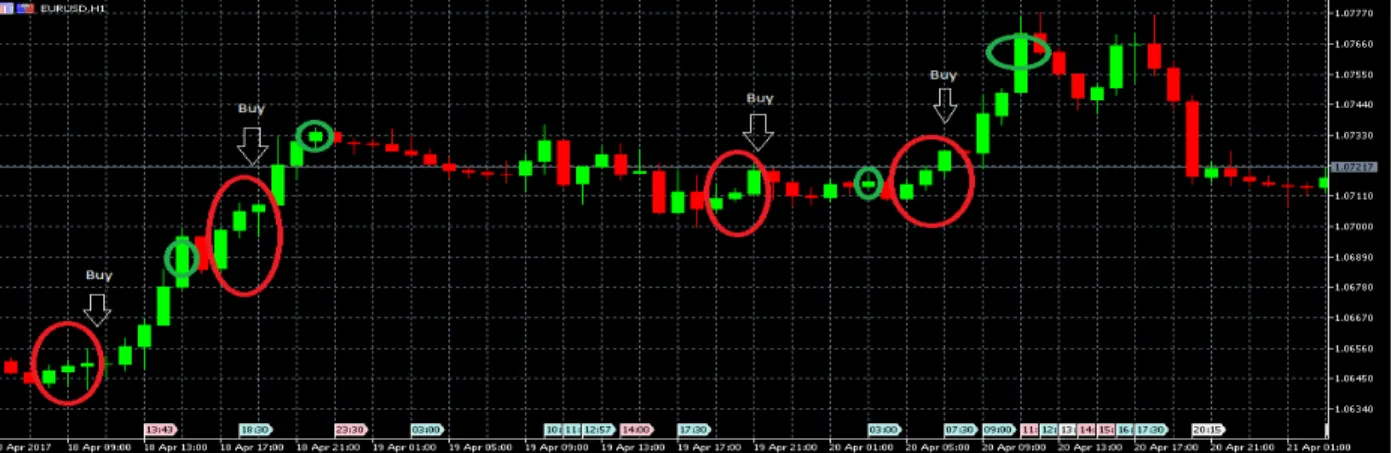
To understand this concept let’s look at a single trading strategy. Suppose we have a trading strategy in which our entry condition is to buy when we see three green bars in a row in which each consecutive high is greater than the previous. Then for exit conditions we have a sell limit in which we sell after a price increase of .003, a stop-loss in which we sell after the price drops .001 and a condition in which we sell five bars after we bought if we haven’t already sold. This is a pretty simple strategy, but in the right market conditions it can be very effective as seen by Figure 5 below. The strategy preforms well during times when the market is moving a lot and up trending. However, in slower market conditions when there is not as much price movement the strategy clearly suffers since the sell limit and stop-loss are too high for such a slow market as seen in figure 6. As demonstrated a strategy can work well in some market conditions, but suffers due to a lack of flexibility to adapt when market conditions change.
Figure 5: Demonstrates the three bar strategy working in the right market conditions with the right parameters. The red circles show where the three bar pattern is seen and a position is opened while the green circles show where the position
19
Figure 6: Shows the three bar strategy in slower market conditions. Here the sell limit and stop-loss are too high for such slow market conditions. The red circles show the three bar pattern where a position is opened and the green circles show the
market exit.
Luckily, there is a way to add more flexibility to a given strategy so it can more easily adapt to the market. One way to do this is by adding trainable parameters to a strategy. For example instead of having a fixed sell limit or stop-loss, you can have a variable one in which the strategy trains on previous bars and using some criteria determines the best values for those parameters. Now if we go back to figure 6, if we had trainable parameters for our three bar strategy it would have been able to train and see, assuming a proper training method and value selection criteria was used, that a smaller limit and stop loss would be better suited for the slower market conditions it was currently in and use the smaller sell limit and stop-loss instead. Now the strategy goes from losing money in those given conditions to making a profit because of the flexibility that was added to it. However, trainable parameters only add so much flexibility to a given strategy.
Sometime the strategy just isn’t going to work in certain market conditions and no changing of parameters will help. As seen in the figure 7 below, the three bar strategy was having no success at all. Training the strategies parameters to either increase or decrease the sell
20
limit and stop-loss wouldn’t help either because the price declined almost immediately after entering the market every time. Since a given strategy can only adjust so much to try and match market conditions, in order for a trading system to be flexible enough to constantly adapt to the market it is necessary to use more than one strategy. This will add even more flexibility to the system.
Figure 7: Demonstrates market conditions in which the three bar strategy would not be effective regardless of if the parameters’ were trained. The red circles show the three bar pattern leading to a position being opened and the green circle shows where the position was closed.
3.3) A Multiple Strategy System
A multiple strategy system allows for more flexibility that a single strategy system would never be able to achieve. By having multiple strategies all with flexible parameters and a method to select the best strategy and parameters at any given time one can build a trading system that is flexible enough to constantly adapt and change along with the market. This should allow for a trading system that can generate a consistent and steady profit no matter the market conditions.
In order for such a system to be successful there are several parts that need to be successful. First, there needs to be a good variety of strategies that all excel in different market
21
conditions. It is important to have enough strategies that it will give the system enough flexibility to adapt to any market condition, but at the same time you can’t have too many or it will take too long to select one. It’s because of this the amount of strategies as well as which ones too
incorporate needs to be carefully thought out. Secondly, each strategy has to have enough trainable parameters that they can be bent to better fit the current market, but at the same time they can’t have too many or else it will take too long to train the strategy as well as take a lot of stability away from it. Finally, there needs to be a good heuristic and training method to select the best strategy as well as the best parameters for each strategy. Without a good heuristic and training method you will run into all kinds of issues and the trading system will never work. This is perhaps the hardest part of building this type of system and where most of the work needs to be put in.
Using the API we built, creating a multiple strategy system is now possible. Because the API allows for access to currency data outside of MetaTrader, we now have access to the tools necessary to build such a system. To demonstrate the effectiveness of our API as well as show how effective a multiple strategy system can be we created a multiple strategy trading system that is capable of recommending trades that the user can then execute in MetaTrader. While the system still needs a lot of work due to the complex nature of accomplishing such a task, we have a solid proof of concept to demonstrate such a system that can eventually be refined into full-fledged trading system.
22
4.1) Overview
Our trading system consists of several key components. The first is a web based front end. This acts as the interface in which users can interact with the system. The interface is built using React.JS since it is a very effective tool to develop single page web applications with. The interface contains a series of python files that are loaded at runtime on the fly and are
implementations of a generic base strategy class. The software comes loaded with a few prebuilt strategies, but users are free to write their own as well. Each strategy then trains on past data and selects the best set of parameters according to set criteria. From here an overarching AI agent then selects the best strategy to use and runs it. While a given strategy is running, the agent is constantly evaluating other possible strategies and parameters and makes the decision on when a new strategy or set of parameters is necessary. Information on how each strategy is ranked at any given time as well as what strategy and parameter set is currently being run is displayed on the interface and constantly updates.
4.2) The Strategy Class
The base strategy class is built in Python and contains several key methods. The first is a method that handles pulling the data. This method can be called in any of the classes that extend the strategy class and given the currency pair, the amount of bars, and the bar size, it will make a request to the API we built and fetch the bars. This allows a given strategy easy access to the necessary data. Another key method contained in the strategy class is the evaluate method. This method handles evaluating the strategy in order to rank how well it is expected to perform compared to the other strategies. This method allows users developing a strategy to just call the evaluate method and not have to worry about writing code to evaluate the strategy. It also allows
23
each strategy to be evaluated based on the same criterion which creates a consistent and fair evaluation process in which no strategy will get favored or neglected due to containing a
different evaluation method. While each strategy is in charge of evaluating which parameters are the best for it and will vary for each individual strategy, the evaluation of the strategy itself is done by a base evaluation method and is the same for all strategies.
The evaluation method is in charge of ranking an individual strategy. To do this is must simulate the strategy on past data and evaluate its performance in the hopes that market
conditions will be similar to what they were then. However there are several key issues that you run into when implementing this kind of evaluation. The first issue is choosing how many candlesticks or bars back to train on. If you train on too many you will be evaluating the
strategies on market conditions that aren’t present anymore and if you use too little you will not have enough data to make an accurate evaluation. The second issue is what performance metrics to use to evaluate the strategies performance. While the simple solution would be to just use profit, there are definitely other performance indicators that should be considered such as consistency and risk. The final issue is how to reduce the luck of an individual strategy in the evaluation process. For example, a given, strategy could have just gotten really lucky during the training process thus producing really good performance metrics, but in reality is not a good strategy to use at the given time. Luckily we were able to come up with solutions to these issues
4.3) Strategy Evaluation
The evaluation method is responsible for evaluating how well a givens strategy is expected to perform. There are several issues that must be addressed when building such a method. The first issue of deciding how many bars back to train on is a classic issue and one that
24
must be solved when implementing any kind of training method. A common way to solve this is to test out training on different bar amounts and see which bar amount leads to the best
performance. This is the method we decided to implement to decide this. However what we found was that depending on the bar size, the ideal amount of bars to train on varied. For example, on 15 minute bars training on anywhere from 100-300 seemed to produce positive results while when training on hour bars a value around 50 bars back seemed to be the best. We believe this is because with smaller bar lengths you can train on more bars without getting into old market conditions due to the fact that each bar is a smaller length. To solve the issue of different bar lengths having different amounts of bars to train on and be successful we
implemented a simple linear scale. To do this we had 15 minute bars be the base bar length and 200 bars back be the base length to train on. Then the amount of bars to train on is reduced by 3 for every minute increase in bar size and increased by 3 for every minute decrease in bar size. This linear scaling technique makes sure that no matter what bar size is being used, it is always training on the appropriate amount of bars.
The next issue we needed to solve was which performance metrics to use as well as how to factor them in to produce an overall rank for a given strategy. The first metric that clearly needs to be factored in is total profit. This metric will simply be the total profit that the strategy made over the training interval. If the strategy lost money this value will be negative. The total profit is then scaled down to an average profit per bar value by simply dividing the profit by the amount of bars trained on. The next factor to consider is consistency. For this a strategies past performance is looked at. The total profit the strategy has made total is divided by the amount of bars it has traded on to produce another profit per bar value that represents consistency. The final metric is risk. This metric represents the chance that the strategies actual return will differ from
25
the expected return and by how much. We calculate this value by taking the expected profit per bar from when it was trained and comparing it to the actual profit per bar from when it was run. By subtracting the expected profit per bar from the actual profit per bar we get a measure for risk. Once the three metrics are calculated we can take a weighted average of them to get a rating for the strategy since all of the metrics are in profit per bar. The total profit per bar is weighted at .5 while consistency and risk are both weighted at .25 each. It is also important to note that all profit is scaled down to what it would have been if only one standard lot of currency had been used. This keeps the profit calculations all on the same scale which is necessary for this type of metric system to work.
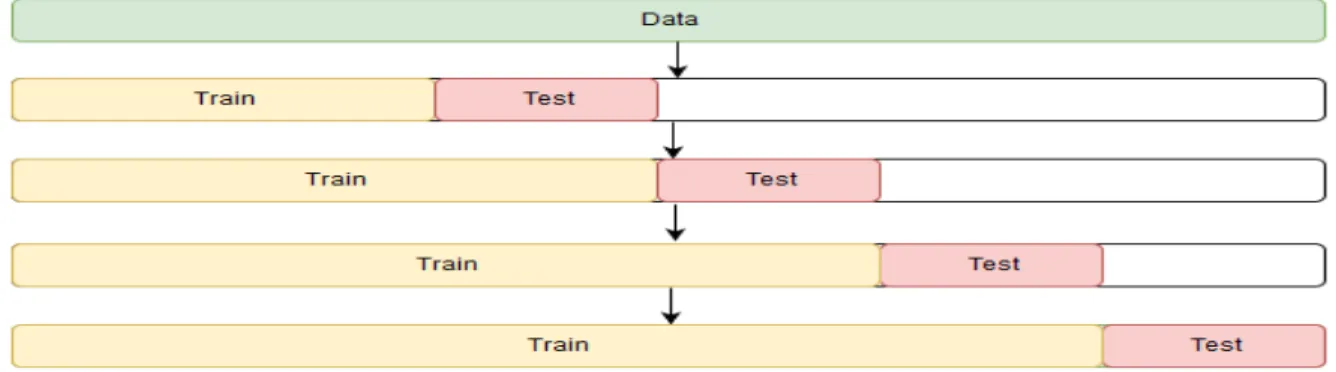
The final issue that we needed to deal with was luck. When training a strategy, a total profit over the time period will be produced. However, just because the total profit was very high doesn’t necessarily mean that the strategy will perform well when run live. The strategy could have just gotten lucky and made one really good trade, but in reality is not a good fit for the current market conditions. To reduce how much impact luck has on the training process called cross validation is usually used. However, we were unable to use traditional cross validation since we are operating on time series data and regular cross validation would put the data out of order. Instead we used a process known as forward chaining. As seen in the figure below, the data is broken up into a selected number of even chunks known as folds. From here the first chunk is used as training data and the second is used as the test data. Then the first two folds are used as training data and the third is uses as the test data. This process is repeated until all of the folds, but the last one are part of the training data. From here the profit of each test session is averaged together and this new value is multiplied by amount of folds to keep it in scale with the other performance metrics and used as the total profit value. This technique helps to significantly
26
reduce the impact of luck in the training process since that one lucky trade does not factor in nearly as much. This technique also helps produce better parameter values when training an individual strategies parameter set.
Figure 8: Illustrates how the data is broken up for 5 fold forward chaining
Once the agent has determined the best strategy, it will run that given strategy. The last problem we needed to solve was how the agent was going to decide when to stop running a given strategy. At any given time the agent has three choices. The first is to keep the same strategy running. The second would be to switch to a new strategy and the final choice would be to run the same strategy, but with different values for its parameters. On the surface this might seem like an easy problem to tackle, but in reality there is a lot that needs to be factored in.
The first issue is to determine when to switch out a strategy. If the strategy is preforming poorly then switching it out is an easy decision and if it is preforming very well then not
switching it out is an easy decision. The problem lies in the case when the strategy is preforming okay. It is making a decent profit but another strategy is ranked higher than it now. On one hand the strategy that is currently running is making money so switching it out might not be the best idea, but on the other hand the strategy that is now ranked higher could potentially make you even more profit. The issue is that there is no guarantee that it will and it could end up
27
preforming worse than the currently running strategy. To solve this, a linear model of the
strategies profit is generated. From here the agent can determine how much profit it is making as well as if its performance is increasing, decreasing or staying the same. Then the slope from this model is multiplied by five as a scaling factor and then added to the profit per bar. If that new value is greater than the other strategies rank which is also a measure of projected profit per bar then keep it. If the new value is lower than run the higher ranked strategy. This kind of
evaluation approach punishes strategies that are down trending and rewards ones whose
performance is increasing. As a side note, a strategy needs to be running for 30 bars before it can be switched out unless the loss it is accumulating reaches a certain threshold. This gives the strategy currently running a chance to preform and makes it so one bad starting trade doesn’t cause it to get switched out.
Chapter 5: The Strategies
5.1) Populating the System with Strategies
In order for our trading system to be successful it needs to have a good selection of strategies to choose from. As discussed earlier, having too many strategies will take too long to train all of them and really slow down the agents decision making process. On the other end, having too little will not give the trading system enough flexibility to be able to adapt to any given market conditions. Unfortunately, due to time constraints the ideal range of strategies to have is unknown, but having around ten will most likely produce desirable results.
As a basic proof of concept we developed three different strategies for the system to use. Ideally we would like to have liked to have more, but we simply didn’t have time to build more and three was plenty to test the system. Each strategy consists of entry conditions, exit conditions
28
and a set of trainable parameters. The details of how each strategy operates will be discussed below.
5.2) Five Bar Strategy
This strategy is fairly simple and exploits reversals in the market after a big trend in one direction. The strategy has the following entry and exit conditions. The strategy buys every time it sees five red bars in a row and shorts every time it sees five green bars in a row assuming a position isn’t already open. The strategy then has two exit conditions that are both trainable parameters. The first is a sell limit in which the strategy closes the position after the price has increased a certain amount from when it was bought or if shorting decreased a certain amount. The exact amount is trained to get the right value for the given market conditions. The second exit condition is a stop-loss in which the strategy closes the position after the price drops a certain amount from the price is was bought at or increased a certain amount if shorting. A chart of the strategy and when it would enter the market can be seen below. When the positions would be closed is not included since the parameters are trainable and can vary for any given instance of the strategy.
29
Figure 9: Demonstrates the five bar strategy. The red circles show the five bar pattern that leads to a position being opened. When the positions would be closed is not included since the parameters are trainable and can vary for any given instance of
the strategy
5.3) Three Bar High Strategy
This strategy operates by catching the second half of short term trends in the market. The entry conditions for this strategy are to buy whenever there are three green bars in a row and the high of each consecutive bar is greater than the one before it. The strategy shorts when there are three red bars in a row and each consecutive low is lower than the previous. The strategy then has two exit conditions that are both trainable parameters. The first is a sell limit in which the strategy closes the position after a certain price increase. If shorting, it closes the position after a price decrease instead. The second exit condition is a stop-loss in which the strategy closes the position after a certain drop in price or if shorting an increase in price. A chart of the strategy and when it would enter the market is shown below. Just like with the previous strategy, when it would exit the market is not shown since it would vary on any given instance of the strategy.
30
Figure 10: Demonstrates the three bar high strategy. The red circles show the three bar high pattern that leads to a position being opened. When the positions would be closed is not included since the parameters are trainable and can vary for any
given instance of the strategy
5.4) Inside Bar Strategy
This strategy works by picking up an inside bars. Inside bars represent a pause in the market before a big move in one direction. An inside is a bar that is completely contained within the bar before it. For a bar to be an inside bar its high needs to be less than the bar before it and it its low needs to be greater than the low of the bar before it. The strategy has the following entry conditions once it detects an inside bar. It will buy if the inside bar is less than half the size of the bar before it and short if it’s more than half the size of the bar before it. Then similar to the two previous strategies it has a trainable sell limit and stop-loss for exit conditions. The strategy and when it would enter the market can be seen below. Just like before when it would exit can’t be displayed since it varies in every instance of the strategy.
31
Figure 11: Demonstrates the inside bar strategy. . The red circles show the inside bar pattern that leads to a position being opened. When the positions would be closed is not included since the parameters are trainable and can vary for any given instance of the strategy
Chapter 6: Conclusion and Future Work
The goal of this project was to create an open and flexible framework with which
researchers or traders can use to develop new and innovative trading tools for free. We then built a multiple strategy trading system controlled by an AI agent that recommends trades in the Forex market. This served to not only demonstrate the utility of the framework built, but also show that such a multiple strategy system can be successful due to the flexibility it possesses to adapt to any given market conditions.
The first goal of the project was definitely accomplished. Using TrueFX which is a free source of live and historical currency data, we were able to construct a database to store the live data as well as a backend and API that can generate candlesticks for any of the major currency pairs for any bar length and time interval. This solves the issue of getting live candlesticks outside of MetaTrader allowing for the development of external trading systems and software.
32
As far as the second goal we accomplished most of what we were looking to do. We developed a trading system that uses the framework we built to generate market data outside of MetaTrader. The part that we didn’t get to finish is proving that such flexible multiple strategy system can be successful. While we got the system built, there simply wasn’t enough time to let it run live for months in order to collect enough data to measure how successful it was. This is perhaps one of the biggest drawbacks of attempting to build such a system because while back testing on historical data is possible, live testing is the only real way to measure if a strategy or trading system is successful and that takes months which we simply didn’t have.
This being said, just because the project is over as far an MQP does not mean that we will stop working on it. We plan to develop this software into a full trading suite including automated trading and other forms of model selection, easier model creation and data analysis tools. This includes adding forms of optimization such as caching processed data in the API or training multiple strategies at once on their own threads. On top of this, gathering live results of the trading system is something that we fully intend to do as well. This is because we believe that such a trading system has great potential and is definitely worth the time and effort to fully develop. Hopefully in a years’ time we will have the system fully developed and will be able to quantitatively say how successful our trading system is.
33
Chapter 7: Bibliography
1.) "What is a Japanese Candlestick," [Online]. Available:
http://www.babypips.com/school/elementary/japanese-candle-sticks/what-is-a-japanesecandlestick.html. [Accessed 17 April 2017]
2.) James Stanley, “How to Build a Trading Strategy” [Online] Available:
https://www.dailyfx.com/forex/education/trading_tips/daily_trading_lesson/2012/07/10/How_to _build_a_trading_strategy.html [Accessed 18 April 2017]
3.) Nial Fuller, “What Is a Forex Trading Strategy” [Online] Available:
http://www.learntotradethemarket.com/forex-university/what-is-a-forex-trading-strategy [Accessed 18 April 2017]
4.) Nial Fuller, “Inside Bar Trading Strategy” [Online] Available: http://priceaction.com/price-action-university/strategies/inside-bar/ [Accessed 18 April 2017]
5.) Galen Woods, “10 Price Action Bar Patterns You Must Know” [Online] Available: https://www.tradingsetupsreview.com/10-price-action-bar-patterns-must-know/ [Accessed 18 April 2017]
6) “Why You Need To Use Multiple Trading Strategies” [Online]. Available:
ForexMentorOnlinehttp://www.forexmentoronline.com/why-you-need-to-use-multiple-trading-strategies/ [Accessed 20 April 2017]
7.) Rob Hyndman, “Cross-validation For Time Series” [Online] Available: http://robjhyndman.com/hyndsight/tscv/” [Accessed 20 April 2017]