Article
Network Anomaly Detection by Using a Time-Decay
Closed Frequent Pattern
Ying Zhao1, Junjun Chen1,* , Di Wu2,3, Jian Teng1, Nabin Sharma2, Atul Sajjanhar4 and Michael Blumenstein3
1 College of Information Technology, Beijing University of Chemical Technology, Beijing 100029, China 2 School of Computer Science, University of Technology Sydney, Ultimo 2007, Australia
3 Centre for Artificial Intelligence, University of Technology Sydney, Ultimo 2007, Australia 4 School of Information Technology, Deakin University, Burwood 3125, Australia
* Correspondence: [email protected]
Received: 23 June 2019; Accepted: 14 August 2019; Published: 17 August 2019
Abstract:Anomaly detection of network traffic flows is a non-trivial problem in the field of network security due to the complexity of network traffic. However, most machine learning-based detection methods focus on network anomaly detection but ignore the user anomaly behavior detection. In real scenarios, the anomaly network behavior may harm the user interests. In this paper, we propose an anomaly detection model based on time-decay closed frequent patterns to address this problem. The model mines closed frequent patterns from the network traffic of each user and uses a time-decay factor to distinguish the weight of current and historical network traffic. Because of the dynamic nature of user network behavior, a detection model update strategy is provided in the anomaly detection framework. Additionally, the closed frequent patterns can provide interpretable explanations for anomalies. Experimental results show that the proposed method can detect user behavior anomaly, and the network anomaly detection performance achieved by the proposed method is similar to the state-of-the-art methods and significantly better than the baseline methods.
Keywords: anomaly detection; frequent pattern; user behavior
1. Introduction
The development of the Internet has led to an increase in cyber attacks causing tremendous damage to governments, organizations, and society. Therefore, network anomaly detection systems are designed to detect cyber attacks. Most anomaly detection approaches are based on machine learning (ML) or data mining (DM). However, the purpose of using ML or DM methods is different. The ML focuses on classification and prediction, and the DM focuses on the discovery of unknown properties in the data [1,2].
Traditionally, the anomaly detection methods can be categorized into three main groups, misuse detection, anomaly detection, and hybrid detection [1]. The misuse detection uses previous knowledge about anomaly patterns to identify network intrusions, which can achieve excellent detection performance with low false alarm rates for known anomalies. However, these types of approaches can not be used to detect zero-day attacks whose patterns are unknown to the detector. For example, if one detection system does not have or update the associated signatures about the anomaly, it is not able to identify this type of attack. The anomaly detection identifies the anomaly by comparing the network traffic with a predefined normality model. In the detecting process, the network traffic that does not fit the normality model is considered as the anomaly. The hybrid detection is a combination of misuse detection and anomaly detection.
Over the past decade, many network anomaly detection methods have been proposed. In these detection algorithms, the data processing, such as feature selection, was widely used. Ambusaidi et al. [3] proposed a filter-based feature selection algorithm for intrusion detection, and Aljawarneh et al. [4] used a Vote method with information gain to select important features. To address the data scarcity problems, a fuzziness based semi-supervised learning approach was
proposed for the intrusion detection system [5]. Moreover, Deep learning methods were also
widely applied in anomaly detection. The Kitsune, an autoencoder framework, was developed for online anomaly detection [6]. Zenati et al. [7] developed a Generative adversarial network (GAN) based intrusion detection system. However, these methods ignored user behavior anomaly in intrusion detection.
The user behavior anomaly, which is different from normal user behavior, may or may not damage the target network system. However, user interests usually are harmed by this anomaly. For example, one network account is stolen by another user to access the Internet. Various studies applied external features such as user behavior information to detect the anomaly. Parwez et al. [8] used K-means and hierarchical clustering methods to detect anomalous user activities in the mobile wireless network. The KOBRA [9] collected time-stamped process events to learn local patterns and the co-occurrence relations, which can be used to model the normal behavioral baseline of the applications. Moreover, Legg et al. [10] proposed a tree-structure profiling approach to assess the user and role-based profile by obtaining the consistent representation of features. Principle Component Analysis (PCA) also was used for detecting anomalous behavior instances [11,12]. However, these methods only focused on using user behavior information for identifying anomaly but ignored the concept drift of user behavior; That is, user behavior changes over time, and the detection model based on user behavior needs to be updated regularly. In addition, these methods cannot provide interpretable explanations for the anomaly.
To address this problem, we apply frequent patterns to construct the user behavior model and provide the update strategy for the model. In a data set, frequent patterns are itemsets whose frequency are no less than a predefined threshold [13]. Compared with the features directly extracted from the data to represent user behaviors, frequent patterns can be used to present hidden user behavior. For example, by frequent patterns, we can examine user behavior from how often he/she performs similar activities. In this paper, we propose a novel framework to detect anomaly activities and provide explanations for the user network behavior and network anomaly. Our contribution is summarized as follows:
• We propose a framework which can mine frequent patterns from the user network traffic to
represent user network behavior. We use frequent patterns to construct user behavior models for anomaly detection. Moreover, a time-decay factor is applied to the frequent pattern for distinguishing the weights between the current network flow and historical network flow.
• To deal with the changes of user behavior, a detection model update strategy is provided in the anomaly detection framework.
• Experimental results show that the proposed method can detect user behavior anomaly, and the
network anomaly detection performance achieved by the proposed method is similar to the state-of-the-art methods (Restricted Boltzmann Machine and Support Vector Machines (RBM+SVM) [14] and non-symmetric deep auto-encoder (NDAE) [15]) and significantly better than the baseline methods (K-nearest Neighbors (K-NN), Support Vector Machines (SVM), and C4.5 Decision Tree).
The rest of this paper is organized as follows: Section2introduces related work, in which we briefly summarize existing works on anomaly and user behavior detection techniques. The definition of frequent pattern is given in Section3. Section4presents our proposed anomaly detection framework. Section5 details the detection algorithm. Experimental data and results are given in Section 6. In Section7, we give the conclusion and discussion of the future works.
2. Related Work
2.1. Network Anomaly Detection
Misuse-based approaches compare the detected patterns with the known attack patterns [16,17]. However, the misuse-based methods are ineffective against zero-day attacks because the new attack patterns are not yet defined for the detector. In contrast, anomaly-based approaches focus on the patterns of normal traffic, which build a profile of normal activities such as bandwidth, usage, or behavior. By comparing the current traffic patterns and normal patterns, anomaly-based methods can identify unknown attacks.
In recent years, anomaly-based approaches are widely used in the security research community.
A hybrid deep learning-based anomaly detection scheme on software defined network [14] was
proposed by Garg et al. By using improved Restricted Boltzmann Machine (RBM), they reduced the dimension of the captured flow, then detected the intrusion with a gradient-based SVM. The Dendron [18] applied genetic trees driven rule induction for anomaly detection, where the decisions trees (DTs) were blended with evolutionary techniques to generate detection rules. These generated rules, which are linguistically interpretable for human comprehension, enabled the detector to take accurate decisions. Additionally, Shone et al. [15] proposed a model which combined non-symmetric deep auto-encoder (NDAE) and random forest (RF) to detect the anomalies. They stacked two NDAEs and linked the stacked auto-encoder to an RF classifier, where the NDAEs were used to learn the representations of network traffic and the RF was used to classify these representations into normal activities or network attacks. Zenati et al. [7] used GAN models for anomaly detection, which can learn an encoder from the complex high-dimensional data space to the latent space during the training. The reconstruction errors based on learned features were used to identify if a sample is anomalous. Experiments conducted on KDD99 dataset showed that this method can achieve high detection performance. However, these works disregarded user behavior anomaly.
2.2. User Behavior Anomaly Detection
User behavior information can be refined from the network traffic flows. Legg et al. [10] turned the user activity into tree-structured profiles and compared the historical user activities with recent activities to detect insider threats. The KOBRA [9] is an online anomaly detection system which can learn normal behavior pattern for applications. The time-stamped process events were collected and then were converted to a discrete-time signal in the KOBRA. By comparing the anomaly score with a threshold, the system detected the anomaly behavior. Najafabadi et al. [12] proposed PCA subspace anomaly detection method for application layer DDoS attacks, where the web server log was analyzed such as client IP field, URL field, and time field. TargetVue [19] detected anomalous users via an unsupervised learning model and visualized the results by analyzing time-adaptive local outlier factor and communication features as user behavior. However, those methods cannot update the trained model; thus, the performance may be degraded after the network traffic behavior changes.
To improve the robustness of detection, the incremental learning method is used to update the anomaly detection model. A semi-supervised network intrusion detection method [20] was proposed to update the detection model incrementally. The detection method included the offline and online phases. In the offline phase, the initial detection model was created using a cluster adjustment method. In the online phase, the semi-supervised incremental learning method was used to update classification model. Mohamed et al. [21] proposed an Adaptive Intrusion Detection Model (AIDM) to study different incremental machine learning classifiers, which can learn network traffic flows in real-time without redeploying the detection infrastructure. Moreover, incremental deep learning method is also used for online anomaly detection. A Recurrent Neural Networks (RNNs) detection method for time series anomaly was deployed to address challenges posed by behavior changes [22]. Although these methods can incrementally update the detection model, the updates of the model are transparent such that network administrators can not understand which behavior patterns in
the model have been changed. Nevertheless, the proposed method updates frequent patterns and their supports to renew the detection model where the frequent pattern is used to represent the user network behavior, and the support of the frequent pattern is used to indicate the importance of each behavior. Network administrators can analyze frequent patterns and their supports to know about user network behavior.
3. Frequent Pattern
Frequent patterns can be defined as itemsets, subsequences, or substructures that are no less than a specific predefined threshold [13] in the dataset. Therefore, frequent patterns can be used to represent user network behavior.
3.1. Closed Frequent Patterns
By mining network traffic transactions, a large number of frequent patterns are extracted. To reduce the time overhead of mining and improve the anomaly detection performance, we need to compress the mined patterns by discarding useless and weakly expressed patterns. Common compression methods include closed frequent pattern method, maximal frequent pattern method, and top-k frequent pattern method [13]. The maximal frequent pattern method and the top-k frequent pattern method can achieve better compression performance than the closed frequent pattern method. However, the cost of high compression performance is that some information may be lost in the maximal frequent pattern and top-k frequent pattern. To preserve the essential information, we choose the closed frequent pattern method to remove redundant patterns, as shown in Section6.4.1.
The closed frequent patterns, maximal frequent patterns, and top-k frequent patterns can be defined as follows.
ConsiderTis network traffic transactions set. Each transactiont∈Tindicates one network traffic
transaction.I={a1,a2, ...,aM}is the finite set of items whereMindicates the number of distinct items. The item is the basic element of pattern. For example, the value of one feature is an item in the user network behavior patterns. Each transactiontcan be represented as a list of distinct items{i1,i2, ...,ij}, whereij∈I.
Support. The support is the proportion of transactions that contain the patternX, as shown in Equation (1). The support countSCis the count of the patternXbelonging to the transactions in theT:
support= |X⊆t,t∈T|
|T| . (1)
Frequent pattern. Givenθ∈(0, 1]is the minimum support, andNis the sliding window size. If
SCis not less thanθ×N, the patternXcan be considered as a frequent pattern.
Closure operator [23]. A closure operator functionCincludes two function componentsgandh, which can be represented asC=g◦h.
Consider thatTis the subsets of all transactionsT, whereT⊆T, andYis the subsets of all items
inI, whereY⊆I. Equation (2) represents the equation of functiong:
g(T) ={i∈I|∀t∈T,i∈t}, (2)
where the subset of transactionTis the input of functiong, andg(T)represents a pattern which is included in all transactions belonging toT.
FunctionhtakesYas input and returns a set of transactions, as shown in Equation (3):
Closed frequent pattern [23]. Closed frequent pattern X can be defined as Equation (4), whereX=C(X):
C(X) =g◦h(X) =X; (4)
otherwise,Xis non-closed.
Maximal frequent pattern. Maximal frequent pattern is the frequent pattern that does not have any frequent pattern supersets.
Top-k frequent patterns. Top-k frequent patterns are the frequent patterns ordered by theirSC
from the top to the k-th position.
3.2. Closed Frequent Pattern Based on Time-Decay
In real scenarios, user behavior varies over time, which may influence the detection result. Therefore, we use the time-decay factor for the anomaly detection model to reduce the influence of historical transactions. We emphasize the current network transaction more than the historical transactions by a time-decay factor. We propose a time-decay CloStream (TDCloStream) algorithm, which is inspired by the CloStream algorithm [23] and the TDMCS algorithm [24]. By using the time-decay factor, both the importance of current network traffic transactions and the cumulative effect of historical network traffic transactions are considered simultaneously.
The time-decay factor. The time-decay factort f ∈(0, 1]is a parameter that describes decay rate of support countSCin unit time.
4. Framework
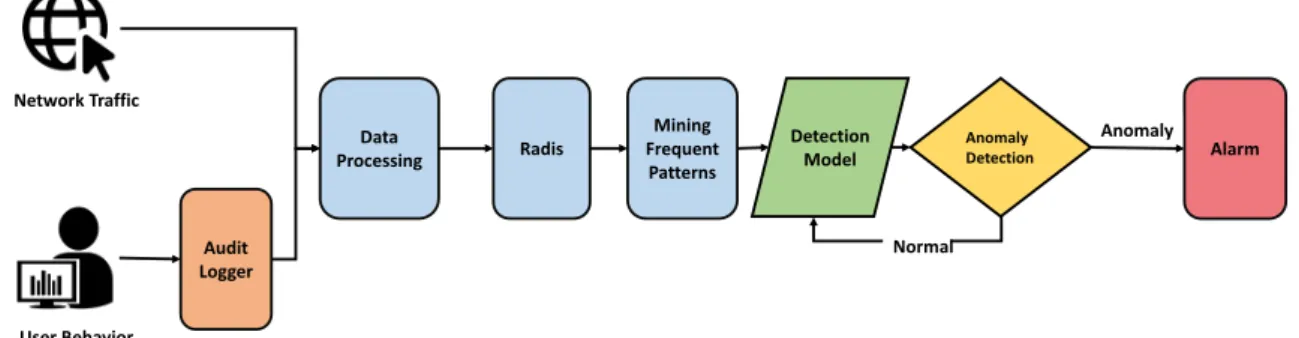
In this paper, we propose an anomaly detection framework based on user behavior model. An anomalous network traffic transaction will trigger the alarm if the similarity between the transaction and the detection model is out of a threshold. The framework of the proposed method is shown in Figure1. Network Traffic User Behavior Audit Logger Anomaly Detection Detection Model Data Processing Radis Mining Frequent Patterns Alarm Normal Anomaly
Figure 1.Anomaly detection framework.
The input data includes network traffic and user information that are from the campus network billing system (audit logger). The user information consists of UserID, IP, and timestamp. During the data processing, we apply nDPI library [25], which is an open source, extensible and cross-platform deep packet inspection library to parse binary network packets, to extract features and to build transactions for further frequent pattern mining. Then, UserID based on the user information is added to each transaction. The processed transactions are stored in the Redis database [26], which is an open source in-memory key/value database to increase reading and writing speed. In the frequent patterns’ mining stage, closed frequent patterns are mined to represent user network behavior. During the modeling stage, we extract the frequent patterns of normal network traffic and construct the detection model for each user. In the detection stage, we mine the frequent patterns from transactions for each user and identify anomalous patterns by calculating the similarity between mined patterns and detection models. If a traffic flow includes anomalous patterns, it triggers the alarm.
5. Algorithm
5.1. TDCloStream Algorithm
The proposed TDCloStream algorithm uses three data structures, namely,ClosedTable,CidList, andTransTable.ClosedTableis used to maintain closed patterns, which consists of four fields:Cid,CP,
SC, andFlag.Cidis a unique identifier that is utilized to identify each closed pattern. The identified closed pattern is stored in theCPfield, and its support count is stored in theSCfield.Flagis a flag field for support count update. Each record inClosedTablerepresents the information of one closed pattern.
CidListis used to maintain the information of items and theirCidSets. TheCidSetfield stores the correspondingCidset for each item. In addition,TransTableis used to store the potential closed patterns
after a new transaction arrives, which contains two fieldsTempCPandCid, whereTempCPstores
the itemset that meet the{NewTransaction∩ti,ti ∈ ClosedTable}condition, andCidis the identifier inClosedTable.
Since the user behavior changes over time, the frequent patterns which represent the user behavior changes as well. To discriminate between the weights of historical network traffic transactions and current network traffic transactions, the time-decay factort f is used to update the support count of the closed pattern in theClosedTable, and the updated formulas are shown in Equations (5) and (6).
According to the Equations (5) and (6), the support count has the maximum limit as shown
in Equation (7): SC(ti,t0m) = ( r , ifm=1, SC(ti,t0m−1)×t f +r, ifm≥2, (5) r= ( 1, ifti⊆t0m, 0,otherwise, (6) SC< 1 1−t f, (7)
wheretiis the closed pattern in theClosedTableandt0mrepresents the current transaction.
To process the network traffic transactions, TDCloStream includes two functional parts, TDCloStreamADD() function and pruning part. The TDCloStreamADD() is used to process the new transactions, and pruning part is used to prune the infrequent patterns inClosedTable as the time flows. When the algorithm processed the data to the designated stepM, the pruning operation
is performed to remove infrequent patterns in ClosedTableand update CidList. The algorithm of
TDCloStream is shown in Algorithm1.
Algorithm 1:TDCloStream
1 foreachnew Transaction Tnewin Ddo
2 TDCloStreamADD(tnew);
3 ifNUM%M == 0then
4 foreachpattern in ClosedTabledo 5 ifpattern.SC<θ×Nthen 6 remove pattern from ClosedTable;
7 end
8 update CidList;
9 end
10 end
11 end
There are two phases in TDCloStreamADD() function. In the first phase, for each item in the new transaction, its correspondingCidset inCidListis stored in theSET({tnew}), where theCidSet(i)is
thei-th’sCidset. The function seeks potential patterns at the intersection of new transactiontnewand closed patterns whoseCidare in theSET({tnew})and stores the potential patterns intoTransTable. During the second phase, this function updates the support count of the potential patterns and updates the
CidList. Then, the function updates support count of historical closed patterns by using Equation (5).
The whole process procedure of the TDCloStreamADD() is shown in Algorithm2.
Algorithm 2:TDCloStreamADD 1 foreachtnewin Ddo
2 TransTable←(tnew, 0);
3 SET({tnew})=CidSet(il)∪...∪CidSet(ik); 4 foreach Cid i∈SET({tnew})do
5 S←Null;
6 S←tnew∩ClosedTable[i].CP; 7 ifS∈TransTablethen
8 ifClosedTable[i].SC>ClosedTable[t].SCthen
9 replace(S,i)with(S,t)inTransTable;
10 end 11 else 12 TransTable←TransTable∪(S,i); 13 end 14 end 15 foreach (X,i)in TransTabledo 16 ClosedTable[i].Flag = True; 17 if(X = ClosedTable[i].CP)then 18 ClosedTable[i].SC=ClosedTable[i].SC×t f +1; 19 else 20 tmpfreq =ClosedTable[i].SC×t f+0; 21 j←j+1;
22 ClosedTable←ClosedTable∪(j,X,tmp f req); 23 foreach ii ∈tnewdo 24 CidSet(ii)←CidSet(ii)∪j; 25 end 26 end 27 end 28 foreachCP in ClosedTabledo 29 if(CP.Flag = False)then 30 CP.SC=CP.SC×t f +0;
31 end
32 end
33 end
5.2. Anomaly Detection and Model Update
Given thatF= {f1,f2, ...,fn}is a user network traffic transactions set. TheP ={p1,p2, ...,pK} represents the closed frequent pattern set mined from theF, and the{SC1p,SC2p, ...,SCKp}is the support count set of theP. TheM={m1,m2, ...,mT}is a frequent pattern set to represent the user anomaly detection model, and the{SC1m,SC2m, ...,SCmT}is the support count set of theM. The algorithm of
anomaly detection and model update is shown in Algorithm3. This algorithm detects the anomaly,
and then updates the detection model. From Line 3 to Line 17, the algorithm calculates the SimilarityS
is anomalous by one predefined thresholdφ. If one network traffic transactionf includes any anomaly pattern, then f can be identified as an anomaly. From Line 18 to Line 24, the algorithm generates new detection modelM0by updating the old modelMwith the normal pattern setNor.
Algorithm 3:Anomaly detection and model update 1 Set the anomaly thresholdφ(0<φ<1);
2 Nor={},M0 =M; 3 foreachpiin Pdo 4 S=0; 5 foreachmjin Mdo 6 S=S+||pi∩mj| pi∪mj|× SCm j ∑T j=1SCmj ; 7 end 8 ifS≤φthen 9 foreach f in Fdo 10 ifpi ⊆ f then 11 f is anomalous; 12 end 13 end 14 else 15 Nor=Nor∪pi; 16 end 17 end 18 foreachmjin Mdo 19 SCmj =SCmj ×t f;
20 if∃n⊆mj, where n∈ Northen
21 SCmj =SCmj +1;
22 end
23 end
24 M0 =M0∪n, wheren∈ Norandn6⊂mj;
6. Evaluation
In this section, we discuss the anomaly detection performance of the proposed method on both user behavior anomaly and network anomaly. Firstly, the datasets used in our experiments are discussed. Then, we compare the detection performance of the proposed TDCloStream algorithm with baseline methods on both datasets as well as the state-of-the-art algorithms [14,15] on the KDD99 dataset. The experimental results are given and discussed in this section. The results show that the proposed algorithm can detect both user behavior anomaly and the network anomaly. We conducted the experiments on an Intel Xeon(R) E5-2609 v3 CPU server with 32G memory, using CentOS7 as the operating system. All algorithms were coded in C++ and Python.
6.1. Datasets
In this paper, we performed experiments on two datasets, namely, BUCT and KDD99. First, we evaluated the detection performance of a user behavior anomaly on the BUCT dataset. Then, we evaluated the network anomaly detection performance on BUCT and KDD99 dataset. The BUCT dataset is a real network traffic dataset that is captured from the library of the Beijing University of Chemical Technology. The network traffic of the BUCT dataset is generated by 274 users and two web servers. We captured three days of network traffic: 2-day data were used to construct the user behavior model, and 1-day data was used for testing. Because the BUCT dataset does not consist of anomaly
traffic, we used the Scapy [27] to generate SYN-flood attacks traffic for the BUCT dataset. The Scapy is a powerful Python-based interactive packet manipulation program and library. It can forge or decode packets of a vast number of protocols.
The KDD99 dataset is a popular public dataset that has been widely applied for research and evaluation of network intrusion detection methods [28]. It includes network anomalies such as DOS, R2L, U2R, and Probing as listed below:
• DOS: denial-of-service, e.g., SYN-ACK flood attack;
• R2L: unauthorized remote access, e.g., brute force password attack;
• U2R: unauthorized local root privileges, e.g., privilege escalation attack;
• Probing: surveillance and data collection, e.g., port scanning.
According to [29], there are some inherent problems in the KDD99 dataset. The main shortcomings are the redundant records and the unreasonable number of training and test records. Instead of detecting all the records one time, the proposed method detects anomaly and updates the user behavior model as time goes on, so the shortcomings of KDD99 dataset have relatively little influence on the proposed method. Additionally, there are about 5 million labeled records in the KDD99 dataset, which is helpful to evaluate the robustness of the proposed method in a vast volume of network traffic. To evaluate detection performance, we divided the KDD99 dataset into the anomaly category and the normal category. The details of two datasets are shown in Table1.
Table 1.Datasets.
Dataset Records Bandwidth Size
BUCT 32 million 150 M/s 1.3TB
KDD99 4.9 million -
-Additionally, the proposed detection method detects network anomaly by comparing patterns of current network traffic with the user behavior model based on frequent patterns. If one network traffic pattern is far away from the model, it is identified as an anomaly. Although the chosen datasets do not consist of all types of network attacks, the proposed method theoretically can detect the anomaly that is not aligned with the detection model.
6.2. Features
To mine closed frequent patterns in the BUCT dataset, we transformed the original network traffic into transactions with the open source depth packet detection library nDPI. The nDPI can identify flows with a five-tuple [30] {source IP, Destination IP, source port, destination port, protocol} and transform network traffic into transactions. To link network transactions to users, we added the user information (UserID) for each transaction by matching transactions with the audit logger. After that process, the TDCloStream mined closed frequent pattern from the user transactions. Transaction features of the BUCT dataset are shown in Table2.
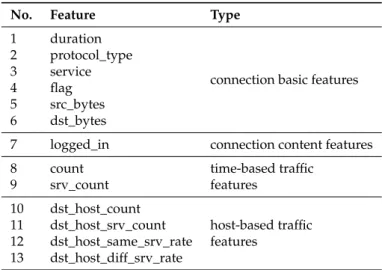
For the KDD99 dataset, every transaction is described by four types of features: connection basic features, connection content features, time-based traffic features, and host-based traffic features. We selected 13 features from 41 features of the KDD99 dataset. The features are shown in Table3.
Table 2.Features of transactions on the BUCT dataset.
No. Feature Description
1 UserID UserID of the transaction
2 protocol_type TCP (Transmission Control Protocol), UDP (User Datagram Protocol), or Other
3 InPort Source port
4 OutIP Destination IP
5 OutPort Destination Port
6 Pkts Number of packets
7 Bytes Size of flow
8 Max_pkt_size Max packet size 9 Min_pkt_size Min packet size
10 Acks Acks flag
11 P1_size Size of the first valid packet 12 P2_size Size of the second valid packet
13 Type Application type
Table 3.Features of transactions on the KDD99 dataset.
No. Feature Type
1 duration
connection basic features 2 protocol_type
3 service
4 flag
5 src_bytes
6 dst_bytes
7 logged_in connection content features
8 count time-based traffic
features 9 srv_count 10 dst_host_count host-based traffic features 11 dst_host_srv_count 12 dst_host_same_srv_rate 13 dst_host_diff_srv_rate
We preprocessed the features because the features are of different types. For example, the IP and flags are discrete, whereas the flow size is continuous. These continuous features were discretized to meet the requirements of the proposed algorithm.
6.3. Metrics
The metrics used in this paper are accuracy, precision, recall, and F-measure, which are the typical metrics for anomaly detection.
Positives and Negatives. For classification, the data may have any of the four statuses:
True Positives (TP), False Positives (FP), True Negatives (TN), and False Negatives (FN).
• TP: anomaly traffic transactions classified as anomaly transactions.
• FP: normal traffic transactions classified as anomaly transactions.
• TN: normal traffic transactions classified as normal transactions.
• FN: anomaly traffic transactions classified as normal transactions.
Accuracy. Accuracy indicates the proportion of samples which are correctly classified. Accuracy is a good measure when classes are balanced. The accuracy can be calculated by Equation (8):
Accuracy= TP+TN
Precision. Precision denotes the proportion of true anomaly samples in all anomaly samples recognized by detection model in the testing dataset. The Precision can be calculated by Equation (9):
Precision= TP
TP+FP. (9)
Recall. Recall denotes the proportion of true anomaly samples in all anomaly samples in the testing dataset. The Recall can be calculated by Equation (10):
Recall = TP
TP+FN. (10)
F-measure. F-measure can be interpreted as a weighted average of the Precision and Recall. The formula of F-measure is shown in Equation (11):
F−measure= 2×Precision×Recall
Precision+Recall . (11)
6.4. Results
6.4.1. Mining Frequent Patterns
By comparing the detection performance on different hyperparameters in Section6.4.4, we applied
a sliding window sizeN = 5000, minimum supportθ = 0.1, and f = 0.9998 in the experiments.
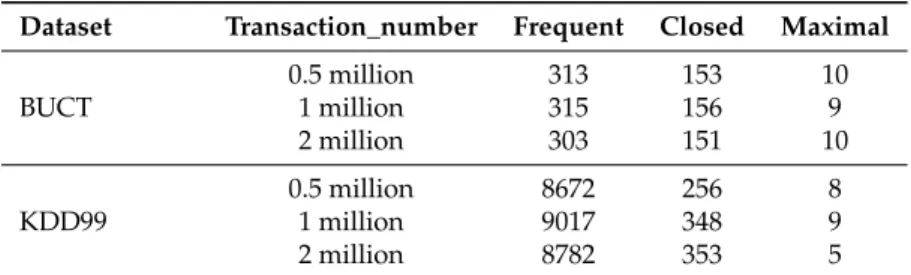
The FPgrowth algorithm [31], which is an efficient and scalable frequent pattern mining algorithm based on prefix-tree structure, was used to mine frequent pattern and maximal frequent pattern. The proposed algorithm was used to mine closed frequent pattern. The number of different types of frequent patterns is shown in Table4.
Table 4.The number of patterns.
Dataset Transaction_number Frequent Closed Maximal
BUCT 0.5 million 313 153 10 1 million 315 156 9 2 million 303 151 10 KDD99 0.5 million 8672 256 8 1 million 9017 348 9 2 million 8782 353 5
For the BUCT dataset, when the number of transactions is 0.5 million, 313 frequent patterns, 153 closed frequent patterns, and 10 maximal frequent patterns are mined. When the number of transactions is 1 million, the number of three types of frequent patterns are 315, 156, and 9, respectively. When the number of transactions is 2 million, the number of three types of frequent patterns are 303, 151, and 10, respectively. From the above results, the closed frequent pattern has good compression performance, and the maximal frequent pattern loses too much information.
For the KDD99 dataset, when the number of transactions is 0.5 million, 8672 frequent patterns, 256 closed frequent patterns, and eight maximal frequent patterns are mined. When the number of transactions is 1 million, the number of three types of frequent patterns are 9017, 348, and 9, respectively. When the number of transactions is 2 million, the number of three types of frequent patterns are 8782, 353, and 5, respectively.
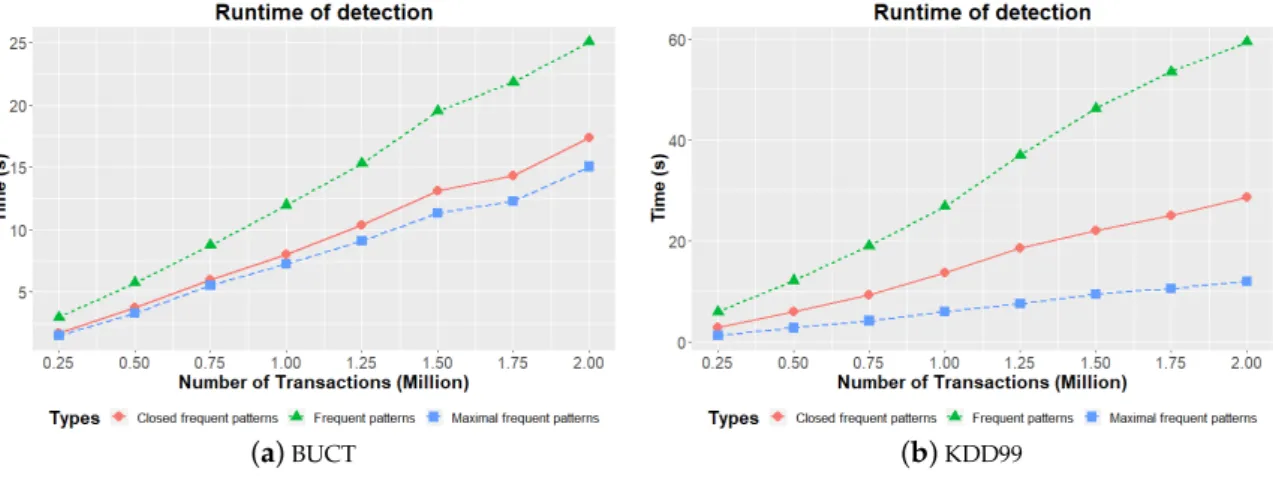
Figure2shows the runtime of detection. The runtime increases with the number of transactions. From Figure2a, when the number of transactions is 2 million, the detection time of closed frequent pattern is 17.35 s, while the detection times of frequent pattern and maximal frequent pattern are 25.02 s and 15.04 s, respectively. When the number of transactions is 1 million, the detection time of closed frequent pattern is 8.01 s, while the detection time of frequent pattern and maximal frequent
pattern are 11.97 s and 7.25 s, respectively. The detection time of frequent pattern is much longer than the detection time of closed frequent pattern and maximal frequent pattern. According to Table4, there is too little useful information for anomaly detection in the maximal frequent patterns. Although the detection time of maximal frequent pattern is the shortest, the maximal frequent pattern is not a good tool to represent user network behavior. The same conclusion can also be drawn from Figure2b.
(a)BUCT (b)KDD99
Figure 2.Runtime of detection. 6.4.2. User Anomaly Behavior Detection
In this section, we simulated the account hijacking to evaluate the performance of user anomaly behavior detection. In this experimental setting, 100 users’ behavior models were randomly selected as the detection models, and their traffic transactions were used as the normal test data. For each detection model, one different user’s traffic transactions were used as the anomalous test data to simulate the account hijacking where one user account is used by another user to access the Internet or other network resources. Additionally, we evaluated the influence of the time-decay factor. If the time-decay factor is equal to 1, the support of closed frequent pattern is not influenced by the time-decay factor, and the proposed TDCloStream algorithm is transformed into the CloStream algorithm.
Figure3illustrates experimental results of user anomaly behavior detection when the minimum
support θis 0.1, and the anomaly threshold φis 0.2. For the proposed method, the Accuracy is
85.15%, the Precision is 84.13%, and the Recall is 88.43%. For the CloStream, the Accuracy is 81.45%, the Precision is 80.36%, and the Recall is 83.25%. From the experimental results, the time-decay factor can improve the detection performance, and the proposed method can detect user behavior anomaly. Because user network behavior used to compare to the detection model is also normal behavior from other users, so the evaluation metrics are not as high as the metrics of network anomaly detection as shown in Section6.4.3.
Compared with other anomaly detection methods, closed frequent patterns can provide interpretable explanations for the anomaly. After the detection, all closed frequent patterns can be further analyzed by network administrators. Because long patterns contain more information than short ones, we selected a few long patterns that include more than seven features from two random users and listed them in Table5. If one feature is not contained in the frequent pattern, we set this feature value to null.
Table 5.User behavior patterns of BUCT.
BUCT Feature No. 1 2 3 4 5 6 7 8 9 10 11 12 13 Support
User1 - TCP 80 - - 10 2∼103 - 1400∼1500 0∼100 1 1400∼1500 - Web 0.217 - TCP 80 - - 102∼103 105∼106 1400∼1500 0∼100 1 1400∼1500 - Web 0.126 - TCP 80 - - 103∼104 106∼107 1400∼1500 0∼100 1 1400∼1500 - Web 0.102 User2 - TCP 80 - - 102∼103 - 1400∼1500 0∼100 1 1400∼1500 - Web 0.172 - TCP 80 - - 102∼103 105∼106 1400∼1500 0∼100 1 1400∼1500 - Web 0.124 - UDP - - - 103∼104 107∼108 - 500∼600 0 500∼600 500∼600 Stream 0.115
From the frequent patterns in Table5, we can infer that User1 and User2 usually use the network to browse Web pages and their network behavior is similar. Moreover, User2’s network behavior
includes some UDP stream data access. Compared with the Web behavior patterns with 102∼103
packets, the support of User1’s pattern is bigger than User2’s pattern, which demonstrates that the two users’ network behavior is different.
6.4.3. Network Anomaly Detection
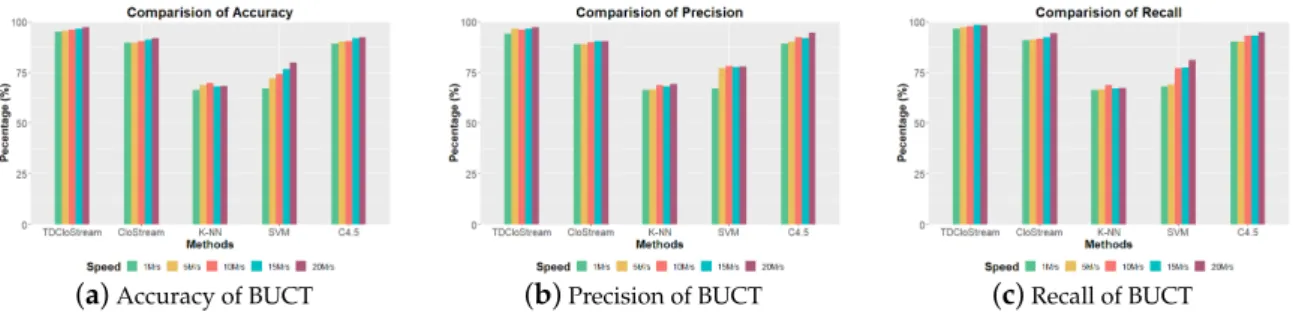
To evaluate the network anomaly, we used the Scapy to simulate network anomaly for the BUCT dataset. We generated SYN-flood packets with Scapy to attack two web servers in the library with the rate of 1 M/s, 5 M/s, 10 M/s, 15 M/s, and 20 M/s, respectively. The attacking source address was randomly generated in the range of 10.47.0.1∼10.69.255.254, and the attacking source port was randomly generated as well. The average network velocity of the two servers was 0.9 M/s, and the
peak velocity was 7 M/s. The anomaly thresholdφ was set to 0.2. Figure4shows the accuracy,
precision, and recall of different algorithms on the BUCT dataset, respectively. From the experimental results, at different attack rates, the proposed method has better detection performance than other algorithms in accuracy, precision, and recall. As the test data of BUCT is time series data, the proposed method based on time-decay achieved better detection performance than the Clostream.
(a)Accuracy of BUCT (b)Precision of BUCT (c)Recall of BUCT
Figure 4.Accuracy, precision and recall of the BUCT dataset.
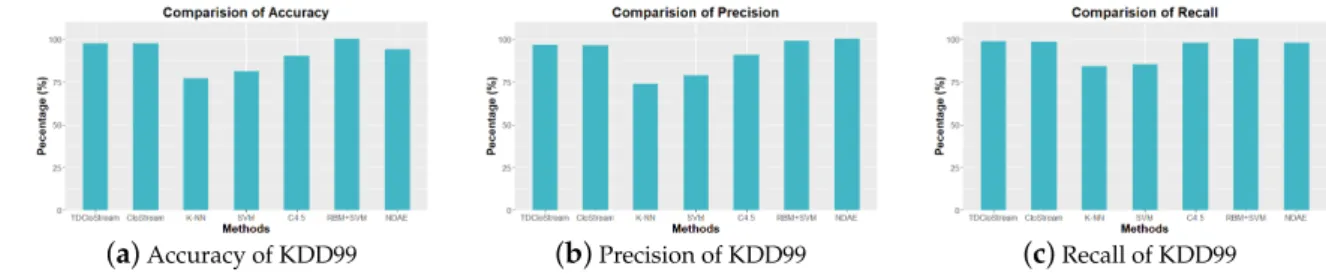
Since the KDD99 dataset does not contain UserID information, we can not identify which users these records belong to. We used a behavior model that represents the normal network behavior of the KDD99 dataset to detect the anomaly. In this setting, this network behavior model can be considered as an ensemble detection model of a set of users. We selected 0.2 million normal records as the training subset, and we also selected 0.7 million normal records and 3 million anomaly records as the testing subset. Figure5shows the accuracy, precision, and recall of different algorithms on
the KDD99 dataset. From Figure5a, the accuracies of TDCloStream, CloStream, K-NN, SVM, C4.5,
RBM+SVM [14], and NDAE [15] are 97.7%, 97.3%, 77.1%, 81.1%, 90.1%, 99.98%, and 93.9%, respectively. Figure5b,c show the precision and recall of these methods, respectively. According to the experimental
results, the network anomaly detection performance achieved by the proposed method is similar to the state-of-the-art methods, and significantly better than the baseline methods. Because the test data of KDD99 is not time-series data, the TDCloStream and CloStream achieve similar detection performance.
(a)Accuracy of KDD99 (b)Precision of KDD99 (c)Recall of KDD99
Figure 5.Accuracy, precision and recall of the KDD99 dataset.
Table6shows some normal network patterns and anomaly network patterns of the BUCT dataset. When network attack (SYN-flood) happens, the values of feature 6 (Count of packets), feature 7 (Size of flow), feature 8 (Max packet size), feature 11 (Size of the first valid packet), and feature 12 (Size of the second valid packet) show a discernible change. All the changed values are all smaller than the values of the normal patterns. This phenomenon indicates that hackers launch as many attacks as possible with limited resources.
Table 6.Network patterns of BUCT.
BUCT Feature No. 1 2 3 4 5 6 7 8 9 10 11 12 13 Support
Normal Pattern
- TCP 80 - - 102∼103 105∼106 1400∼1500 0∼100 1 1400∼1500 - Web 0.161 - TCP 80 - - 103∼104 106∼107 1400∼1500 0∼100 1 1400∼1500 1400∼1500 Web 0.128 Anomaly Pattern - TCP 80 - - 0∼10 10∼103 0∼100 0∼100 - 0 0 Web 0.314
Similarly, Table7shows some normal patterns and anomaly patterns of the KDD99 dataset.
Through analysis, we find that feature 2, feature 4, feature 5, feature 7, feature 8, and feature 9 can help network administrators determine whether a network anomaly occurred. In the case of TCP anomaly, the value of feature 5 (src_bytes) is in the range of 0∼100, which is significantly less than the value of feature 5 of normal patterns; the value of feature 4 (Flag) is S0, which represents the error status of the connection; the value of feature 7 (logged_in) is 0, which represents Login failed. In the case of ICMP anomaly: the value of feature 5 (src_bytes) is in the range of 1000∼1100; the value of feature 8 (count), which represents the number of connections with the same target host as the current connection, is in the range of 510∼520, and the value of feature 9 (srv_count), which represents the number of connections that have the same service as the current connection, is in the range of 510∼520. The large value of feature 8 and feature 9 indicate that many connections are pointing to one target host with the same service.
Table 7.Network patterns of KDD99.
KDD99 Feature No. 1 2 3 4 5 6 7 8 9 10 11 12 13 Support
Normal Pattern 0 tcp http SF 100∼200 - 1 0∼10 - - - 0.95∼1 0∼0.05 0.274 0 TCP http SF - - 1 - - 250∼260 250∼260 - 0∼0.05 0.149 0 TCP http SF - - 1 0∼10 0∼10 - - 0.95∼1 0∼0.05 0.132 0 TCP http SF - 1000∼1100 1 0∼10 0∼10 - - 0.95∼1 0∼0.05 0.111 Anomaly Pattern - ICMP ecr_i SF 1000∼1100 0∼100 - 510∼520 510∼520 - - - - 0.289 - TCP - S0 0∼100 0∼100 0 - - 250∼260 0∼10 0∼0.05 0.05∼0.1 0.282 0 TCP private S0 0∼100 0∼100 0 - 10∼20 - - - - 0.184 6.4.4. Parameter Evaluation
In this section, we evaluate the hyperparameters such as windows sizeN, minimum supportθ, time-decay factor f, and anomaly thresholdφ.
Windows Size and Time-decay Factor. Because the time-decay factor is used in the TDCloStream, the support count of frequent pattern is smaller than the original support count. According to
Equation (7), the support count has the maximum limit under the time-decay setting. Therefore, we set the value of time-decay factor whose maximum limit is equal to the value of the window size, that is,t f =1−1/N.
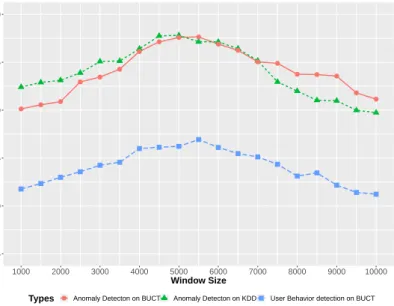
The detection performance of different tasks is influenced by the windows sizeN, as shown in Figure6. For user anomaly behavior detection, the F-measure is higher than 0.860 when theNis in the range of 4000 to 6000. For the anomaly detection on KDD99, the highest F-measure, 0.978, is achieved whenNis 5000. For anomaly detection on BUCT, highest F-measure is 0.976 whenNis 5500. Therefore, we set theNto 5000 for the evaluation experiments in this paper. The value of the time-decay factort f
is based on theN, so thet f is 0.9998.
0.75 0.80 0.85 0.90 0.95 1.00 1000 2000 3000 4000 5000 6000 7000 8000 9000 10000 Window Size F−measure
Types Anomaly Detecton on BUCT Anomaly Detecton on KDD User Behavior detection on BUCT
Figure 6.F-measure with different window size.
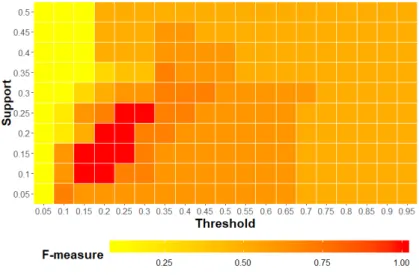
User anomaly behavior detection optimization. We apply F-measure to evaluate the optimal minimum supportθand anomaly thresholdφin user anomaly behavior detection on the BUCT dataset. The experimental results in Figure7show that, with the increase of the minimum support and anomaly threshold, the F-measure increases. The best detection rate is achieved when the minimum supportθ is in the range of 0.1 to 0.25 and the anomaly thresholdφis in the range of 0.15 to 0.3. Then, with the increase of the minimum support and anomaly threshold, the F-measure decreases. Through the definition in Section3.1, the number of frequent patterns is inversely proportional to the minimum
supportθ. When the number of frequent patterns is large, there is too much useless information.
When the number of frequent patterns is small, there is little useful information in the detection model. Network anomaly detection optimization. The F-measure is also used to evaluate the optimal
minimum supportθand anomaly thresholdφin network anomaly detection. We randomly selected
2 million normal data and simulated 2 million anomaly data for the hyperparameters evaluation experiments conducted on the BUCT dataset. Similarly, 0.9 million normal data and 0.9 million anomalous data were randomly selected from the KDD99 dataset for the experiment. The experimental results are shown in Figure8. The best detection rate is achieved when the minimum supportθis in the range of 0.1 to 0.3 and the anomaly thresholdφis in the range of 0.1 to 0.25.
Figure 7.F-measure with different support and threshold for user anomaly behavior detection.
(a)BUCT (b)KDD99
Figure 8.F-measure with different support and threshold network anomaly detection.
7. Conclusions
In this paper, an anomaly detection model based on time-decay closed frequent pattern is proposed. The model mines closed frequent patterns from the network traffic for each user and uses time-decay factor to discriminate between the weights of the current network traffic and historical network traffic. The static learned models degrade the detection performance over time because of the dynamic nature of the user network behavior. To deal with the changes of network behavior, a model update strategy is provided in the anomaly detection framework to improve the robustness of user anomaly behavior detection. The proposed model not only detects user behavior anomaly but also detects network anomaly. According to the experimental results, the network anomaly detection performance achieved by the proposed method is similar to the state-of-the-art methods, and significantly better than the baseline methods. Additionally, the closed frequent patterns can provide interpretable explanations for the anomalies.
However, there are some issues to be considered in the future work. For example, the size of the experimental data we used in our framework is far smaller than the size of campus network export data and the computation cost will significantly increase with the increase of data volume. To deal with big network data, the parallel algorithm is one of the potential solutions. In our future work, we will research on parallel anomaly detection model based on frequent patterns and provide a parallel model update strategy. Another point is that the dataset does not contain network traffic generated by mobile devices, so we did not analyze whether the model is suitable for wireless and mobile
networks. We plan to capture the WiFi traffic of campus network in the future. Additionally, we will further research the influence of time-decay on the network anomaly detection and user behavior anomaly detection.
Author Contributions: Conceptualization, Y.Z.; methodology, J.C.; software, D.W.; investigation, J.T.; writing—original draft preparation, J.C and D.W.; writing—review and editing, A.S. and M.B.; visualization, N.S.; Supervision, Y.Z.
Funding:This research was funded by China Scholarship Council project (201806880022). Conflicts of Interest:The authors declare no conflict of interest.
References
1. Buczak, A.L.; Guven, E. A survey of data mining and machine learning methods for cyber security intrusion detection. IEEE Commun. Surv. Tutor.2016,18, 1153–1176. [CrossRef]
2. Husák, M.; Komárková, J.; Bou-Harb, E.; ˇCeleda, P. Survey of Attack Projection, Prediction, and Forecasting in Cyber Security. IEEE Commun. Surv. Tutor.2018,21, 640–660. [CrossRef]
3. Ambusaidi, M.A.; He, X.; Nanda, P.; Tan, Z. Building an intrusion detection system using a filter-based feature selection algorithm. IEEE Trans. Comput.2016,65, 2986–2998. [CrossRef]
4. Aljawarneh, S.; Aldwairi, M.; Yassein, M.B. Anomaly-based intrusion detection system through feature selection analysis and building hybrid efficient model. J. Comput. Sci.2018,25, 152–160. [CrossRef] 5. Ashfaq, R.A.R.; Wang, X.Z.; Huang, J.Z.; Abbas, H.; He, Y.L. Fuzziness based semi-supervised learning
approach for intrusion detection system.Inf. Sci.2017,378, 484–497. [CrossRef]
6. Mirsky, Y.; Doitshman, T.; Elovici, Y.; Shabtai, A. Kitsune: An ensemble of autoencoders for online network intrusion detection. arXiv2018, arXiv:1802.09089.
7. Zenati, H.; Romain, M.; Foo, C.S.; Lecouat, B.; Chandrasekhar, V. Adversarially Learned Anomaly Detection. In Proceedings of the 2018 IEEE International Conference on Data Mining (ICDM), Singapore, 17–20 November 2018; doi:10.1109/icdm.2018.00088. [CrossRef]
8. Parwez, M.S.; Rawat, D.B.; Garuba, M. Big data analytics for user-activity analysis and user-anomaly detection in mobile wireless network. IEEE Trans. Ind. Inform.2017,13, 2058–2065. [CrossRef]
9. Fawaz, A.M.; Sanders, W.H. Learning process behavioral baselines for anomaly detection. In Proceedings of the 2017 IEEE 22nd Pacific Rim International Symposium on Dependable Computing (PRDC), Christchurch, New Zealand, 22–25 January 2017; pp. 145–154.
10. Legg, P.A.; Buckley, O.; Goldsmith, M.; Creese, S. Automated insider threat detection system using user and role-based profile assessment. IEEE Syst. J.2015,11, 503–512. [CrossRef]
11. Bi, M.; Xu, J.; Wang, M.; Zhou, F. Anomaly detection model of user behavior based on principal component analysis. J. Ambient. Intell. Humaniz. Comput.2016,7, 547–554. [CrossRef]
12. Najafabadi, M.M.; Khoshgoftaar, T.M.; Calvert, C.; Kemp, C. User behavior anomaly detection for application layer ddos attacks. In Proceedings of the 2017 IEEE International Conference on Information Reuse and Integration (IRI), San Diego, CA, USA, 4–6 August 2017; pp. 154–161.
13. Han, J.; Cheng, H.; Xin, D.; Yan, X. Frequent pattern mining: Current status and future directions. Data Min. Knowl. Discov.2007,15, 55–86. [CrossRef]
14. Garg, S.; Kaur, K.; Kumar, N.; Rodrigues, J.J. Hybrid Deep Learning-based Anomaly Detection Scheme for Suspicious Flow Detection in SDN: A Social Multimedia Perspective.IEEE Trans. Multimed.2019,21, 566–578. [CrossRef]
15. Shone, N.; Ngoc, T.N.; Phai, V.D.; Shi, Q. A deep learning approach to network intrusion detection. IEEE Trans. Emerg. Top. Comput. Intell.2018,2, 41–50. [CrossRef]
16. Brahmi, H.; Brahmi, I.; Yahia, S.B. OMC-IDS: At the cross-roads of OLAP mining and intrusion detection. InPacific-Asia Conference on Knowledge Discovery and Data Mining; Springer: Berlin, Germany, 2012; pp. 13–24. 17. Li, Y.; Xia, J.; Zhang, S.; Yan, J.; Ai, X.; Dai, K. An efficient intrusion detection system based on support vector
machines and gradually feature removal method. Expert Syst. Appl.2012,39, 424–430. [CrossRef]
18. Papamartzivanos, D.; Mármol, F.G.; Kambourakis, G. Dendron: Genetic trees driven rule induction for network intrusion detection systems. Future Gener. Comput. Syst.2018,79, 558–574. [CrossRef]
19. Cao, N.; Shi, C.; Lin, S.; Lu, J.; Lin, Y.R.; Lin, C.Y. Targetvue: Visual analysis of anomalous user behaviors in online communication systems.IEEE Trans. Vis. Comput. Graph.2015,22, 280–289. [CrossRef] [PubMed] 20. Noorbehbahani, F.; Fanian, A.; Mousavi, R.; Hasannejad, H. An incremental intrusion detection system
using a new semi-supervised stream classification method. Int. J. Commun. Syst.2017,30, e3002. [CrossRef] 21. Mohamed, M.R.; Nasr, A.A.; Tarrad, I.F.; Abdulmageed, M.Z. Exploiting Incremental Classifiers for the
Training of an Adaptive Intrusion Detection Model. IJ Netw. Secur.2019,21, 275–289.
22. Saurav, S.; Malhotra, P.; TV, V.; Gugulothu, N.; Vig, L.; Agarwal, P.; Shroff, G. Online anomaly detection with concept drift adaptation using recurrent neural networks. In Proceedings of the ACM India Joint International Conference on Data Science and Management of Data, Goa, India, 11–13 January 2018; pp. 78–87.
23. Yen, S.J.; Lee, Y.S.; Wu, C.W.; Lin, C.L. An efficient algorithm for maintaining frequent closed itemsets over data stream. InInternational Conference on Industrial, Engineering and Other Applications of Applied Intelligent Systems; Springer: Berlin, Germany, 2009; pp. 767–776.
24. Han, M.; Ding, J.; Li, J. TDMCS: An efficient method for mining closed frequent patterns over data streams based on time decay model.Int. Arab J. Inf. Technol.2017,14, 851–860.
25. Deri, L.; Martinelli, M.; Bujlow, T.; Cardigliano, A. ndpi: Open-source high-speed deep packet inspection. In Proceedings of the 2014 International Wireless Communications and Mobile Computing Conference (IWCMC), Nicosia, Cyprus, 4–8 August 2014; pp. 617–622.
26. Carlson, J.L.Redis in Action; Manning Publications Co.: Shelter Island, NY, USA, 2013.
27. Kobayashi, T.H.; Batista, A.B.; Brito, A.M.; Pires, P.S.M. Using a packet manipulation tool for security analysis of industrial network protocols. In Proceedings of the 2007 IEEE Conference on Emerging Technologies and Factory Automation (EFTA 2007), Patras, Greece, 25–28 September 2007; pp. 744–747.
28. Kwon, D.; Kim, H.; Kim, J.; Suh, S.C.; Kim, I.; Kim, K.J. A survey of deep learning-based network anomaly detection. Clust. Comput.2019,22, 949–961. [CrossRef]
29. Tavallaee, M.; Bagheri, E.; Lu, W.; Ghorbani, A.A. A detailed analysis of the KDD CUP 99 data set. In Proceedings of the 2009 IEEE Symposium on Computational Intelligence for Security and Defense Applications, Ottawa, ON, Canada, 8–10 July 2009; pp. 1–6.
30. Zhao, Y.; Chen, J.; You, G.; Teng, J. Network Traffic Classification Model Based on MDL Criterion. InAdvanced Multimedia and Ubiquitous Engineering; Springer: Berlin, Germany, 2016; pp. 1–8.
31. Han, J.; Pei, J.; Yin, Y.Mining Frequent Patterns without Candidate Generation; ACM Sigmod Record; ACM: New York, NY, USA, 2000; Volume 29, pp. 1–12.
c
2019 by the authors. Licensee MDPI, Basel, Switzerland. This article is an open access article distributed under the terms and conditions of the Creative Commons Attribution (CC BY) license (http://creativecommons.org/licenses/by/4.0/).