Working Paper 109
Tax Compliance of Wealthy Individuals in
Rwanda
Jalia Kangave, Kieran Byrne and John Karangwa
July 2020
1
ICTD Working Paper 109
Tax Compliance of Wealthy Individuals in
Rwanda
Jalia Kangave, Kieran Byrne and John Karangwa
July 2020
2 Tax Compliance of Wealthy Individuals in Rwanda
Jalia Kangave, Kieran Byrne and John Karangwa
ICTD Working Paper 109
First published by the Institute of Development Studies in July 2020 © Institute of Development Studies 2020
ISBN: 978-1-78118-661-9
This is an Open Access paper distributed under the terms of the Creative Commons Attribution Non Commercial 4.0 International license, which permits downloading and sharing provided the original authors and source are credited – but the work is not used for commercial purposes. http://creativecommons.org/licenses/by-nc/4.0/legalcode
Available from:
The International Centre for Tax and Development at the Institute of Development Studies, Brighton BN1 9RE, UK Tel: +44 (0) 1273 606261
Email: info@ictd.ac Web: www.ictd.ac/publication Twitter: @ICTDTax
Facebook: www.facebook.com/ICTDtax
IDS is a charitable company limited by guarantee and registered in England Charity Registration Number 306371
3
Tax Compliance of Wealthy Individuals in Rwanda
Jalia Kangave, Kieran Byrne and John Karangwa
Summary
Low-income countries are increasing their fiscal independence through the improvement of domestic taxation systems. To continue to do so, they must ensure that these systems are perceived as equitable and preserve their integrity. An essential characteristic of an equitable tax system is the treatment of wealthy individuals. In this paper, we use key informant
interviews and data from key government institutions, including the Rwanda Revenue Authority (RRA), the land agency and the body in charge of development investment, to get some insight into individual wealth in Rwanda and the tax compliance of wealthy individuals. We find low levels of compliance among identified individuals, which could be partly
explained by the fact that the existing law does not require certain categories of individuals to file tax returns. In addition, there is some evidence to suggest that some rich individuals engage in tax evasion.
Keywords: high net worth individuals; wealthy individuals; tax compliance; personal income taxes.
Jalia Kangave is an independent consultant and ICTD researcher working on taxation of wealthy individuals, gender and tax, and research capacity-building. At the time of
undertaking this research, she was a Research Fellow at the Institute of Development Studies.
Kieran Byrne is an Overseas Development Institute (ODI) Fellow working as a tax policy analyst/researcher at the Rwanda Revenue Authority.
John Karangwa is a Manager for Research and Policy Analysis at the Rwanda Revenue Authority.
4
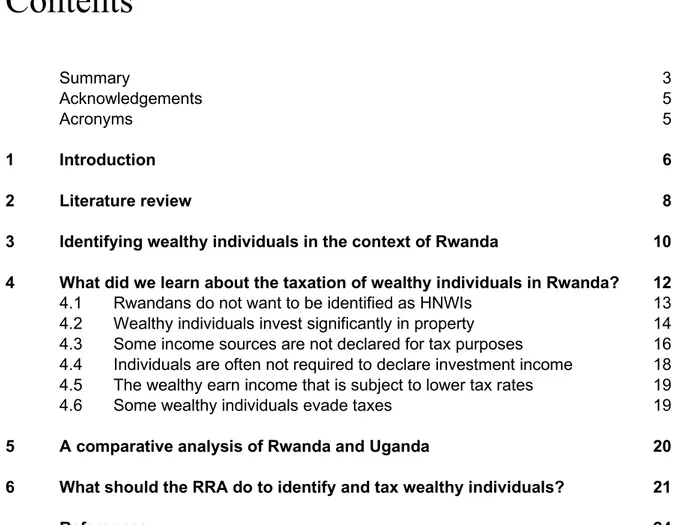
Contents
Summary 3 Acknowledgements 5 Acronyms 5 1 Introduction 6 2 Literature review 83 Identifying wealthy individuals in the context of Rwanda 10 4 What did we learn about the taxation of wealthy individuals in Rwanda? 12
4.1 Rwandans do not want to be identified as HNWIs 13 4.2 Wealthy individuals invest significantly in property 14 4.3 Some income sources are not declared for tax purposes 16 4.4 Individuals are often not required to declare investment income 18 4.5 The wealthy earn income that is subject to lower tax rates 19 4.6 Some wealthy individuals evade taxes 19
5 A comparative analysis of Rwanda and Uganda 20 6 What should the RRA do to identify and tax wealthy individuals? 21
References 24
Figures
Figure 1 Distribution of residential land in Rwanda, as per the Land
Registry, 2019 15
Figure 2 Tax paid (RWF million) by HNWIs, by tax type 2016-2018 17 Figure 3 Number of HNWI payers, by tax type 2016-2018 17
5
Acknowledgements
We thank the International Centre for Tax and Development and the Rwanda Revenue Authority (RRA) for the support that they have provided us in writing this paper. We are particularly grateful to the RRA’s Senior Management Team, whose support and feedback from inception of the project to the end has been greatly valued. We thank Denis Mukama, the acting Deputy Commissioner, Planning and Research Department for his regular guidance. We are also grateful to RRA officials in various departments and interviewees in the public and private sector whose insights helped to shape our ideas. Lastly, we are grateful to the anonymous peer reviewers for their feedback. All errors are our own.
Acronyms
HNWI High net worth individual PAYE Pay As You Earn
PIT Personal income tax
RDB Rwanda Development Board RRA Rwanda Revenue Authority URA Uganda Revenue Authority
6
2
Introduction
Increasing emphasis is being placed on the need for low-income countries to collect more tax revenue (United Nations 2015; OCED 2015). In parallel, the need for equitable tax systems is also gaining prominence (Prichard 2018; Moore and Prichard 2017). Recent research reveals that African countries have made considerable progress in increasing tax collection (Moore et al. 2018). However, taxation in many African countries is inequitable in various respects. For example, there is now a growing body of evidence that individual Africans often make various tax-like payments (commonly referred to in the literature as informal taxes), which extract more money from low-income households than they do from high-income households (Jibao et al. 2017; van den Boogaard 2018; Olken and Singhal 2011). Similarly, revenue authorities in these countries collect very little in personal income taxes (PITs), which are useful for income redistribution. Moore et al. (2018), for example, estimate that less than 5 per cent of the African population pay PIT compared to about 50 per cent in high-income countries. Worse still, the bulk of this PIT is collected from individuals in formal employment (particularly from government employees and employees of large private sector companies). The majority of these individuals earn steady but modest incomes when
compared to high-income professionals and wealthy self-employed individuals who often go untaxed (Keen 2012; Kogler et al. 2015). The result is an under-taxation of the wealthy and over-taxation of low-income earners.
In Rwanda, between fiscal years 2016/17 and 2018/2019, PIT accounted for approximately 24 per cent of total tax revenue (OECD/ATAF/AUC 2018; Rwanda Revenue Authority databases). However, 97 per cent of this amount was from Pay As You Earn (PAYE), which is collected from salaries of individuals in formal employment. The remaining 3 per cent was collected from personal business.1 A previous study on PIT in Rwanda indicates that the rich
contribute significantly to PIT that is not employment-related.2 However, given the
percentage collected from personal businesses, in absolute terms the contribution by the rich remains low.
In an effort to raise more revenue and to promote more fairness in the tax system, a small cluster of revenue authorities in African countries (most notably South Africa, Uganda and Mauritius) have put in place mechanisms to try to ensure that wealthy individuals pay their fair share in taxes (Kangave et al. 2018). The Uganda Revenue Authority (URA) reported impressive success shortly after establishing its High Net Worth Individual (HNWI) unit.3 In a
similar spirit, the Rwanda Revenue Authority (RRA) wanted to investigate whether the tax remitted by wealthy individuals is consistent with their tax liability, hence the purpose of this study. This inquiry has been rendered even more urgent following the recent global
1 Administrative tax data from RRA databases. This heavy reliance on PAYE is not unique to Rwanda. Moore et al.
(2018) conclude that on average, in the year 2015, 5 African countries (Ghana, Kenya, Rwanda, Swaziland and Uganda) collected 97% of their personal income taxes from PAYE.
2 Mascagni et al. (2016) observe, eg, that between 2012 and 2014, the bulk of PITs (47%) that are not PAYE-related
were collected from the real regime, which is constituted primarily by large enterprises. In the real regime, those in the richest decile contributed almost 60% of the revenue, with the richest 1% contributing almost 24% of the total revenue collected under the PIT real regime.
3 Before the URA established its HNWI unit, it was collecting very little from wealthy individuals. In financial year
2014/2015, it collected only USD390,000 from wealthy individuals managed by its Large Taxpayer Office (Kangave et al. 2018). In September 2015, the URA set up its HNWI unit. By June 2016, the unit had collected over USD2.5 million. By June 2017, the figure had increased to USD11.4 million. Similarly, the number of wealthy individuals on the URA taxpayer register increased from a mere 17 before the unit was set up, to 356 (117 HNWIs and 239 politically influential individuals, called VIPs) in June 2017. The URA’s success story has been featured in Princeton University’s series on innovations for successful societies (Schreiber 2019).
7
pandemic sparked by COVID-19, which has highlighted the need to tax wealthy individuals to support increasing government expenditure (Moore and Prichard 2020; Prichard 2020; International Monetary Fund 2020).
In this paper, we explore to what extent wealthy individuals in Rwanda are tax compliant. To get some insight into the answers to this question, we conducted interviews with government officials from the RRA, Rwanda’s Ministry of Finance and Economic Planning, Rwanda Development Board (RDB), City of Kigali and the Rwanda Land Management and Use Authority in January and February 2019. In the private sector, we interviewed individuals at the Private Sector Federation, international audit firms, prominent law firms and commercial banks. In total, we interviewed 20 officials in the public sector and 8 individuals in the private sector. Because our interest was to get a better understanding of the technical aspects of taxation, the challenges involved in day-to-day collection of taxes and the politics of taxation, we identified a mixture of individuals at both senior management level and officials involved in operations. In the private sector, we identified practitioners who were more likely to engage with wealthy individuals. The purpose of the interviews was to gather information regarding a number of issues. What are the indicators of wealth in Rwanda? What challenges does the RRA face in taxing individuals? Did respondents feel that wealthy individuals paid the appropriate tax due? How should the RRA go about identifying and taxing wealthy individuals? After the interviews, we analysed data from the Rwanda Land Management and Use Authority, and the RDB, and used this data to examine tax compliance of the wealthy using internal RRA data.
We have six main findings:
1. Rwandans do not like to be publicly recognised as wealthy. As such, using the phrase High Net Worth Individuals is problematic.
2. Property, land and shares are important stores of wealth, and are concentrated in a few individuals. For example, the top 1 per cent of residential landowners own approximately 15 per cent of the residential land in Rwanda.
3. Only a few individuals declare all their personal income for tax purposes. For example, while RRA data indicates that a number of wealthy individuals are millionaires (in USD), we find low levels of compliance among these individuals. In 2018, for example, of the 42 individuals that we identified as prospective HNWIs, only 1 in 5 individuals filed a
personal income tax declaration.
4. Few wealthy individuals are legally required to declare their income and file tax returns. Specifically, individuals who earn investment income that is subject to withholding tax are not required to file tax returns.
5. Wealthy individuals often earn income through streams that are taxed at lower rates. For example, while investment earnings are taxed at a maximum rate of 15 per cent and disposal of shares at 5 per cent, the maximum rate for other individual earnings is 30 per cent.
6. Some wealthy individuals engage in tax evasion, which involves under-declaring the value of their assets and allocating ownership of assets to other contacts, while continuing to reap the income stream.
The paper is arranged as follows. Section 2 reviews the literature on taxation of HNWIs. We discuss the concept of wealth in Rwanda in Section 3. This is followed by a discussion in Section 4 of the research findings. We then have a brief comparative analysis of the taxation of wealthy individuals in Rwanda vis-à-vis Uganda in Section 5. We conclude with some recommendations in Section 6.
8
2 Literature review
There are five broad questions that existing research on HNWIs has been concerned with: 1. Who are HNWIs?
2. What are the behavioural responses of these individuals to changes in tax systems? 3. How do revenue authorities approach the taxation of these individuals?
4. What challenges do revenue authorities face in taxing these individuals? 5. What is the economic impact of taxing these individuals?
There is no universal definition of HNWIs for tax purposes. Revenue authorities in different countries define them differently. In the United Kingdom, these are individuals with a net worth of more than GBP10 million (National Audit Office 2016). In South Africa, they are individuals who have an income of at least ZAR3 million and net assets of at least ZAR16 million (South African Revenue Agency response to questionnaire 2016). In Australia, they are individuals who, together with their associates, control wealth of at least AUD5 million (Kangave et al. 2018). In Uganda, the URA uses multiple thresholds, depending on the type of asset (Kangave et al. 2018). Useful indicators for Uganda’s purposes include having significant shareholding in companies with a yearly turnover of at least USD14.3 million, undertaking bank transactions of at least USD1 million a year or obtaining bank loans of at least USD1.5 million in a five-year period, dealings in land transactions of over USD280,000 in a five-year period and earning rental income of at least USD140,000 per year. Ultimately, as Tanzi (2012: 300) advises, ‘the definition of HNWIs must be country specific’, and ought to be based on the per capita income of the country. This means that HNWIs in low-income countries ‘may have absolute income, that would make them part of the middle class of richer countries’ (Tanzi 2012: 300).
Ever since the Allingham and Sandmo (1972) study, which concludes that taxpayer
behaviour is influenced by the economic returns on evasion, researchers have documented various responses of wealthy individuals to changes in tax systems. They find that wealthy individuals employ various strategies to react to policy changes including: increasing their investment in pass-through entities (such as partnerships) when income tax rates of top individual earners are reduced below corporate tax rates (Auerbach and Slemrod 1997); using short-term fixes to respond to changes in taxation – such as temporarily increasing their income (eg by exercising stock options) when they anticipate increases in tax rates and reducing the income when the increase in tax rates is introduced (Goolsbee 2000); and lobbying and increasing their contributions to political parties to steer politicians in a certain direction during periods of policy uncertainty (Giertz and Mortenson 2014). Generally, researchers find that the income of wealthy individuals has a high elasticity, which gives them more opportunities for tax evasion and avoidance, including increasing their expenses and echaracterizing their income (Sael et al. 2009).
Revenue authorities use a range of strategies in trying to tax HNWIs. In Uganda and the United Kingdom, the URA and Her Majesty’s Revenue and Customs (HMRC) have dedicated units to manage the affairs of HNWIs (Kangave et al. 2018; National Audit Office 2016). HMRC’s unit is staffed with people who are trained to handle complex tax planning schemes, and customer relationship managers who are responsible for understanding the behaviour of HNWIs and the risks associated with them. In the URA, technical expertise of staff is
important, but communication skills are considered paramount – due to the political power wielded by HNWIs. The Australian Tax Office (ATO) established an HNWI Task Force in
9
1996, but this was disbanded in 2001 (Kangave et al. 2018). HNWIs in Australia are now managed through the ATO’s Privately Owned and Wealthy Groups (POWG) Office, which deals with both wealthy individuals and the companies that they control. Similarly, the South African Revenue Agency (SARS) operated a HNWI unit between 2009 and 2014, but closed it when the whole organisation was restructured to operate along functional lines (Kangave et al. 2018). The affairs of HNWIs in South Africa are now managed through various functional departments, with designated tax officials who deal specifically with their accounts.
A number of challenges are faced by revenue authorities seeking to tax HNWIs. Kangave et al. (2016) observe that one of the difficulties in Uganda came from the fact that about a third of the HNWIs identified on the URA’s taxpayer register in 2016 were politicians who wielded a lot of power. Those who were not politicians had strong political connections. Even in high-income countries, such as the United States, these individuals may influence how tax laws apply to them, because of the easier access that they have to civil servants, high-level bureaucrats and politicians (Tanzi 2012). In countries such as Chile and Argentina, Fairfield (2013; 2010) demonstrates that HNWIs possess the power to influence tax policies through either lobbying or threatening to decrease investment or capital flight.
HNWIs are also difficult to tax because they are more likely to engage in aggressive tax planning schemes and recruit the services of financial experts to reduce their tax liability (OECD 2009; Tanzi 2012). In high-income countries, these individuals use strategies such as investing in trusts and foundations, differed-stock distributions and using artificial loss or deduction schemes to reduce their taxable income (Tanzi 2012). Indeed, sometimes they engage in outright evasion. Using a combination of tax audit information, population-wide income data, wealth records and leaked microdata from offshore financial institutions to investigate tax evasion in Norway, Sweden and Denmark, Alstadsæter et al. (2017) find that tax evasion rises sharply with wealth. Specifically, they find that the top 0.01 per cent of the individuals being studied evade about 30 per cent of their personal and wealth taxes when compared with an average evasion rate of 3 per cent. Similarly, Cooper et al. (2015), using 2011 tax returns data in the United States, find that wealthy individuals used pass-through entities such as partnerships to evade taxes. They note that ‘Overall, 69 per cent of pass-through income earned by individuals accrues to the top 1 per cent’ (Cooper et al. 2015: 3). Observing that ‘owners of very large fortunes typically receive income flows that are much smaller than their full economic income’ because of their engagement in complex tax avoidance schemes, Piketty et al. (2013: 3) advocate a comprehensive income tax, a progressive wealth tax and a progressive inheritance tax.
In low-income countries such as Uganda, many of these individuals were found not to engage in any kind of sophisticated tax planning scheme (Kangave et al. 2016). Rather, their’s was outright evasion, in the sense that the majority of them did not file income tax returns and therefore paid no income taxes. This was made possible because of the political power that they wielded, and because the URA was not making optimum use of the
information in its possession. There were, however, a few cases where individuals were engaged in tax avoidance schemes that entailed either trying to reduce their income by splitting it amongst family members, or hiding the income by setting up companies that were then used to fund personal expenses. Taxing these individuals is also difficult in cash-based economies where it is extremely difficult to trace economic transactions (Kangave et al. 2016).
To understand the economic impact of taxing HNWIs, researchers analyse the impact of increasing tax rates, or providing preferential rates for their income bracket. The findings
10
have produced mixed results. Using a natural experiment, Young and Varner (2014)
conclude that the claim that wealthy individuals migrate when higher rates of tax are imposed on their income is often an exaggerated one. The researchers used tax records of wealthy taxpayers in New Jersey and California to test whether increases in tax rates on wealthy individuals lead to millionaire migration. Specifically, they looked at the migration patterns of millionaires before and after tax rate increases.4 They then compared the behaviour of the
millionaires with the behaviour of a control group composed of high-income earners just below the millionaire bracket. The control group was not affected by the tax increase. They found that in New Jersey there was an increase in millionaire migration after the tax increase was introduced. However, because a similar increase in out-migration was observed in the control group, the researchers concluded that the millionaire migration could not be attributed solely to the tax increase. The results were even more surprising in California. They found that while net out-migration increased for the control group after the tax rate was increased, it did not increase for the millionaires who were affected by the increase. The researchers concluded that there was no satisfactory evidence to support the argument that when tax rates are increased on this group of taxpayers, they migrate.
In a subsequent study, Cohen et al. (2015) contest the findings of Young and Varner. Cohen et al. use data sets that were similar to those used by Young and Varner in New Jersey. However, they use a different price index to deflate incomes, and their analysis focusses on out-migrants (instead of net migration). Their rationale for focussing on out-migrants was that in-migrations could be explained by conditions in the locations of origin, which are bound to be different across locations. The researchers were also able to get additional tax records that were not available to Young and Varner. They find that when in-migrants were excluded from the analysis, there was ‘a noticeable and statistically significant increase in
out-migration of millionaires, relative to the out-out-migration of taxpayers earning between US$200,000 and US$500,000 a year’ (Cohen et al. 2015: 218). They conclude that increasing tax rates on millionaire incomes not only increased out-migration, but also negatively affected revenue collection.
While the above two studies relate to inter-state migration in the United States, which may not be prevalent in low-income countries, the studies are still relevant when thinking about the wider economic consequences that may result from attempting to tax HNWIs – such as capital flight. In Uganda, for example, URA officials observed that when the URA started enforcing the law on HNWIs, these individuals started exploring tax planning schemes (including investing abroad), as opposed to engaging in outright evasion.5
3 Identifying wealthy individuals in the
context of Rwanda
Identifying HNWIs and the extent of their wealth is often a challenging task for revenue authorities in both high-income and low-income countries. In high-income countries, the main challenge is posed by the fact that HNWIs often engage in complex tax planning schemes. In
4 In New Jersey, where the income tax rate for wealthy individuals had been increased in 2004, they looked at individual
income tax records filed between 2000 and 2007. In California, where the rates had been increased in 2005, they looked at tax records between 1987 and 2009.
5 Henry Saka and Ronald Waiswa, ‘Taxing the Rich and VIPs: An Update from Uganda’, presented at 7th ICTD Annual
11
low-income countries, particularly in Africa, individuals may not engage extensively in sophisticated tax planning schemes because African revenue authorities have traditionally not paid much attention to PITs other than PAYE. Instead, the difficulty in identifying HNWIs in African countries is more likely to be associated with the fact that there is a huge cash economy, and a lack of reliable data on income and property ownership. This is made more difficult in countries where revenue authorities still rely significantly on manual processes (Ligomeka 2019). Lastly, in some cases, the economic elite are also the political elite, who consider themselves to be above the law. The challenges in each country on the African continent are likely to be different.
To identify HNWIs in Rwanda, it is important to understand the nature of the country’s economy. Between 2013 and 2017, 69 per cent of all registered investment in Rwanda was in Kigali City Province (Rwanda Development Board 2017). The remaining 31 per cent was shared between the Western Province (14%), Eastern Province (11%), Northern Province (4%) and Southern Province (2%). In Kigali City Province, the largest sectors during that period were construction (23%), services (20%) and Information and Communications Technology (17%). Overall, in 2017, construction, mining and energy registered the highest investment. Additionally, public investment is a significant and central part of Rwanda’s economy.6 In other words, investment in Rwanda is highly centralised, and the state plays a
role in determining the allocation of capital across sectors (Booth and Golooba-Mutebi 2012; Gokgur 2012). The state owns significant shares in several of the biggest companies in the country, particularly in sectors such as real estate, road construction, metal trading,
telecommunications, agro-processing and energy (Behuria 2015; 2016).
This centralisation of investment by the state has been interpreted differently by different commentators. Some argue that the rents from this investment are centralised for the long-term development of the whole population, with no direct benefits accruing to particular individuals (Booth and Golooba-Mutebi 2012). Others conclude that the enterprises benefit only a select few, and have the effect of crowding out investment by other actors (Gokgur 2012). Our research did not investigate the validity of either of these claims. However, we can make two observations, which are important for understanding individual ownership of wealth in the country. The first is that the centralisation of rents by the state may make it difficult for the RRA to establish whether and to what extent these rents accrue personally to individuals who may be HNWIs, since these interests are not publicly listed. The second observation is that, given that the state controls a significant share of the businesses in the country, much of the wealth is owned by the state and there may be relatively few HNWIs. This suggestion ties in with responses heard from interviewees, who believed that there are very few wealthy individuals in Rwanda. We investigate this further in Section 4 below. In addition to public investment, the government plays a pivotal role in supporting the mobilisation of private investment. The government was instrumental in setting up collective investment schemes to strategically invest in targeted sectors of the economy7 (Booth and
Golooba-Mutebi 2012). At first pass, the investors in these collective schemes seem likely to be among Rwanda’s HNWIs. Using data from the RRA and other government sources, we conducted a preliminary assessment of these individuals’ wealth and taxpaying behaviour (Section 4).
6 The World Bank, ‘Rwanda: Overview’ < http://www.worldbank.org/en/country/rwanda/overview>.
7 Under Rwanda’s Law Relating to Investment Promotion and Facilitation No. 06 of 2015, a collective investment scheme
is defined as ‘an arrangement in which several investors form a group and work together for the purpose of improving their common interest and reducing risk’.
12
Among other things, identifying individual wealth in Rwanda is difficult because there is a culture of secrecy that shrouds the ownership of wealth. Many interviewees highlighted that Rwandans do not like to ‘flaunt wealth’. One interviewee said: ‘Unlike other East African countries where it is easy to identify rich people because they are very flamboyant, here, they are very low profile. They are not very visible. It will be difficult to find their children in international schools. Here, the cars they drive, the way they dress and where they stay make it difficult to identify them. They take their children to schools outside the country. If they want to drink alcohol, they do it at home – not in bars’.
In a number of instances, wealth is actively hidden and disguised. Several interviewees gave examples of this behaviour. Examples include wealthy individuals opening up bank accounts in the name of illiterate individuals who live in villages, including a bank account of over RWF2 billion held in the name of a guard (who did not know of the bank account’s
existence). Similarly, some interviewees believed that a number of government officials have a lot of hidden wealth. However, since they are formally obliged to report their wealth to the Ombudsman, their assets may formally belong to other people.
4 What did we learn about the taxation of
wealthy individuals in Rwanda?
We used four main methods to get some insight into individual wealth in Rwanda and the behaviour of wealthy taxpayers:
• First, we did a desk review of laws and other relevant literature.
• Second, we interviewed 28 key informants from the public and private sectors.
• Because our key informants identified three main categories of wealth – land, property and shares – we concentrated on these kinds of assets in the third stage of our research. This involved collecting quantitative data on mortgage and share holdings from the RDB and land ownership from the Rwanda Land Management and Use Authority. This enabled us to draw up a preliminary list of HNWIs.
• We then looked at the tax records of the Domestic Tax Department and the Local
Government Tax Department8 of the RRA for the period 2015-2018, to assess the extent
to which these apparent HNWIs were declaring incomes and assets and paying income and property tax, as well as having appropriate tax withheld on their behalf.
Rwanda is a particularly suitable context for undertaking this analysis for various reasons: a. It has a full land registry that records the size of each plot of land, its use, ownership or
lessor, and for some plots a value is also attached. This value is reported by the owner at the time of transfer of ownership or for purposes of mortgage valuation. In cases where a commercial transaction has occurred, the land registry also has a record of the land value (including buildings). However, land values are still unavailable for the vast majority of parcels.
8 Since fiscal year 2015/2016, the RRA has collected local government taxes on behalf of the districts in Rwanda. For this
13
b. The RDB maintains a register of shareholders of firms of Rwanda’s private sector. Here, we find details of who the shareholders of each company are, and how much equity they hold in those companies. The companies are also required to submit updated structures of the shareholding whenever there is a transfer of shares. Included in this declaration should be a listing of the shareholders of each enterprise. However, we found that a number of the largest companies had not reported their shareholders to the RDB. Similarly, while companies in Rwanda are required to submit their balance sheets to the RDB, this requirement is not currently being fulfilled by some businesses.
c. All mortgages issued by banks in Rwanda are reported to the RDB. Mortgages require collateral and reliable income streams. They are, therefore, an indirect measure of wealth. It is, however, worth noting that the RDB valuations are made by valuers who may have an incentive to inflate the value of land and buildings. This should be considered in the results presented in our analysis.
d. There is strong collaboration and institutional infrastructure within government that enables the sharing of information. Throughout the project, comprehensive data sharing agreements facilitated the seamless transfer of data from other government agencies to the RRA researchers. These agreements have their origin in the recognition that data has a powerful role to play in informing policy in Rwanda. Indeed, Rwanda is one of the most digitally literate economies in the region. For example, Irembo, the government’s online portal, allows citizens to increasingly access a number of government services without travelling to a physical office. Small taxpayers in Rwanda can declare and pay taxes and fees on their mobile phones. The national statistics institute, NISR, recently opened their new Data Science Campus, which has since hosted the 5th United Nations International
Conference on Big Data for Official Statistics. These technological assets greatly facilitated this research.
We have six main findings.
4.1 Rwandans do not want to be identified as HNWIs
We find that, for both political and cultural reasons, wealthy individuals in Rwanda do not want to be referred to as HNWIs. As one interviewee said: ‘There is a cultural and political sensitivity to describing someone as wealthy. Politically, making someone think that they are so rich is problematic. We do not want to encourage that kind of mindset. One of our political values in Rwanda is that we do not personalise success. We think more in terms of the contribution of the community as a whole’.
Another interviewee said: ‘Culturally, calling them HNWIs might be problematic. How can we find ways of incorporating them into the existing enforcement structure of the RRA without targeting them as individuals? There is no need of putting up a special unit for them because this could create a backlash’.
A final interviewee added: ‘In Rwanda, to be publicly known as rich is an issue. There is no pride or benefit to it. So these individuals prefer to remain hidden. In some African countries, wealthy people flash their wealth. Wealthy individuals in Rwanda are humble and secretive. This has always been the Rwandan culture. The rich people will not even go out for a drink – they will get drunk at home. They don’t want to be known as being rich’.
While wealthy Rwandans prefer to keep their economic status private, they do not object to being categorised as rich for purposes of delivering social protection programmes. This is done through a programme called Ubudehe. The Ubudehe is a country-wide categorisation
14
of households on the basis of their income (World Bank 2016). Households all over the country are given scores between 1 and 4, with 1 being the ranking for the lowest-income households and 4 for the highest-income households. The purpose of this categorisation is to help the government identify low-income households that should be supported through social protection programmes. The information included in the Ubudehe register is based on social surveys conducted by Ubudehe facilitators, who collect information on various
socioeconomic variables relating to shelter, food and the occupation of members of a
household. Information is also gathered from community members, who help with identifying members in the community who are considered to be rich, poor or vulnerable.
The Ubudehe programme was officially launched in 2001 as a partnership between the Ministry of Finance and Economic Planning and the Ministry of Local Government.9
However, the concept dates back more than a century, and was intended as a mechanism through which communities support each other to resolve issues (Ruberangeyo et al. 2011). For example, traditionally, members of the community come together to assist each other in development projects, such as building houses and engaging in agricultural projects. Equally, mitigating the effect of emergencies and natural disasters is facilitated through the
community fabric. In using Ubudehe as a government tool to categorise households based on wealth, Rwandans are more focused on the unifying factor of community support than they are on the status that comes with being identified as wealthy.
The Ubudehe categorisation gives us an oversight of the geographical concentration of wealth in Rwanda. A 2015 Ubudehe categorisation revealed that the majority of Category 1 households were found in the Western Province (29%), while Category 4 households were mostly concentrated in the City of Kigali (58%) (Ministry of Local Government 2016). This ties in both with the RDB’s finding that the majority of investment in the country is found in Kigali, and Goodfellow’s (2017) assessment that property is concentrated in Kigali. However, when we asked RRA officials whether the Ubudehe register would be useful for identifying wealthy individuals in the country, some were sceptical. They argued that the perception of wealth in rural areas is quite different to that in urban areas. For example, a person in a village may be considered wealthy because they have a brick house. Such an individual may be considered rich by village standards, but may not necessarily qualify as HNWIs for tax purposes. The RRA officials did, however, feel that examining the register – particularly category 3 and 4 households – may provide some useful information on Rwanda’s wealthy individuals. The Ubudehe categories in Table 1 are not directly comparable to the tax registry, but the upper quartiles of the PIT distribution will mostly be in Ubudehe category 4.
We take note of the strong reservations about using the term HNWIs to describe Rwanda’s wealthy. As such, our use of the term in this paper is strictly for discussion purposes, and due to the lack of an immediate alternative. It is clear to us that any strategy that the RRA puts in place to manage the affairs of these individuals will need to address and determine the appropriate terminology.
4.2 Wealthy individuals invest significantly in property
Both the data and interviews confirm that land and property are among the most important indicators of wealth in Rwanda, and that these are concentrated among a few individuals. As noted in Section 3 above, between 2013 and 2017 a significant proportion of investment in Kigali (23%) was in the construction sector (Rwanda Development Board 2017). This is
15
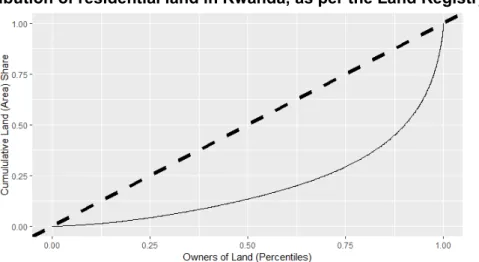
largely attributable to the rapid urbanisation of Kigali, and the influx of international capital and personnel (Goodfellow 2017). The bulk of investment is by Rwandans. Goodfellow (2014) observes that, between 2006 and 2010, 73 per cent of registered investment by the top ten domestic investors was in real estate and construction. Similarly, as demonstrated by the Lorenz curve in Figure 1, land ownership (in terms of area) is highly concentrated. Figure 1 illustrates that the lower 50 per cent of residential land owners in Rwanda own 12.5 per cent of the residential land (directly implying that the higher 50% own 87.5%). Further still, the top 1 per cent of residential landowners own approximately 15 per cent of the residential land in Rwanda.
Figure 1 Distribution of residential land in Rwanda, as per the Land Registry, 2019
Source: Authors’ own
Although property rental is a lucrative business, particularly in Kigali, this is not reflected in the revenue collected in property-related taxes. In 2018/19, RWF2.5 billion in tax, or 0.2 per cent of GDP, was collected on property, which is at the lower end of those countries who collect property tax.10 By the end of the 2000s, rent prices for houses being let out to
expatriates were as high as USD3,000 or more per month (Goodfellow 2017). While in 2007 the government identified 27,000 rented properties in a district called Nyarugenge, Kigali, rental income tax was only paid on 500 of those properties (Goodfellow 2014).
The taxation of property in African countries has often been undermined by politics (Kangave et al. 2016; Goodfellow 2014; 2015). In Rwanda, local elites have passively resisted taxes on property, with the result that historically very little revenue has been collected from this source (Goodfellow 2014; 2015). Politicians, parliamentarians and military officers are implicated in this resistance. In 2011, for example, parliamentarians resisted a Bill that was tabled to introduce property taxes at an annual rate of 0.5 per cent of the value of the property (Goodfellow 2015). The rate was subsequently reduced to 0.1 per cent. Comprehensive property tax reform did, however, pass through parliament in 2018 (N˚75/2018 of 07/08/2018). The new laws are now published and intend to tackle low compliance with property tax. A fixed asset tax has been replaced with a property tax that considers land and buildings separately – the first primary house is exempt, but the owner must still pay tax on their land, thereby enforcing regular declaration. The application of the rates on land tax is devolved to the districts, who have more information about appropriate rates.
16
4.3 Some income sources are not declared for tax purposes
Only a few wealthy individuals declare all their personal income for tax purposes. The qualitative part of the research defined intuitive criteria for identifying HNWIs. From the interviews and literature review, we found that the predominant stores of wealth in Rwanda are property, land and shares. Interviewees also highlighted that international trade is another way to accumulate wealth in Rwanda. Rwanda, as a landlocked country, relies greatly on its trade links. This has created significant investment opportunities for those with the capital to ensure the supply of in-demand goods. In this spirit, the number of vehicles, particularly trucks, owned by individuals are considered as one of the criteria.
In order to examine the information gathered from the interviews through data analysis, we define a lower wealth bound for qualification as an HNWI. The lower bound and the variables used to define it are for purposes of this paper only, and should not be interpreted to
constitute an official definition employed by the RRA or the Government of Rwanda. The lower bound is notional, and is intended as a baseline pool that the revenue administration may target. Using data from the RRA, RDB and the Rwanda Land Management and Use Authority, we identified 42 individuals as prospective HNWIs using the above criteria.11 Using
this data, the criteria in Box 1 were developed.
Interviewees claimed that HNWIs who invest in shares invest across a number of firms. This assertion is confirmed by the data. On average, an HNWI in this category holds shares in five different companies. The value of these shares is also significant, with many holding more than RWF1 billion. The data also readily confirms that wealthy individuals are millionaires (in USD).
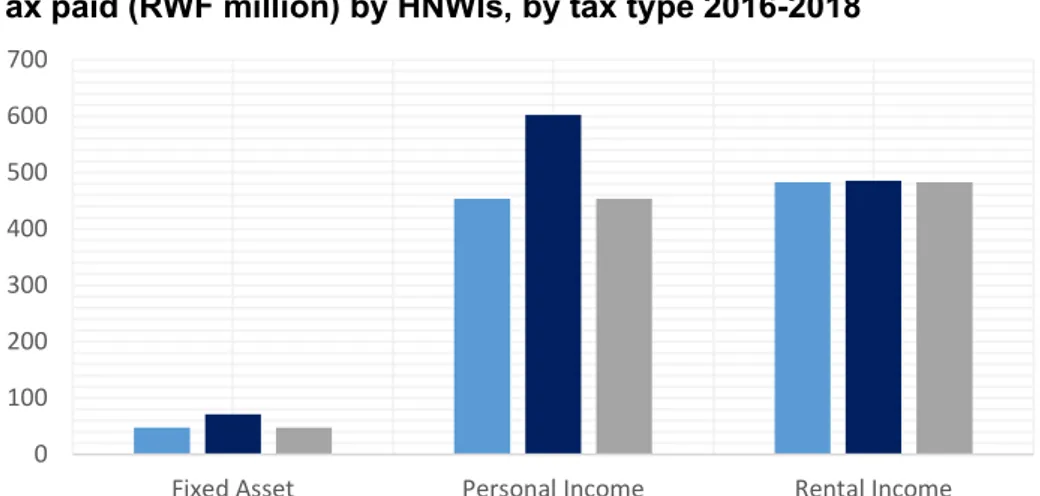
Yet an analysis of the RRA tax records reveals a low level of compliance by these individuals. In 2018, one in five of these filed a personal income tax declaration with the RRA. This is in line with the trend from previous years (see Figure 3 below). This compares to high levels of non- and nil-filing in the population generally (see Mascagni et al. 2020). The following figures indicate the amount of tax paid by HNWIs and the number of individual payers over the period 2016-2018. It is difficult to determine a clear trend in any of the taxes in Figure 2 below. This is in part because the amounts are composed of payments by few
individuals. There is no clear substantive reason for this pattern for PIT other than being an indication of a number of legislative issues, which we discuss in our next finding.
11 The criteria include the requirement of ownership in more than one asset class. This is done to prevent misclassification
based on a data anomaly.
Box 1 Criteria for classification as a HNWI in Rwanda
We define total assets for classification as - The value of land +
- The value of shares +
- The value of movable assets + - The value of property
17
Figure 2 Tax paid (RWF million) by HNWIs, by tax type 2016-2018
Source: Authors’ own
Figure 3 Number of HNWI payers, by tax type 2016-2018
Source: Authors’ own
In order to highlight the structural importance of these taxpayers, it is worth noting how the average tax paid varies among different types of taxpayers:
• For personal income tax, in 2018, the average payment by an HNWI is approximately RWF40 million compared to RWF66 thousand for all PIT taxpayers
• For fixed asset tax in 2018, the average payment by an HNWI was RWF2 million compared to RWF0.5 million for all fixed asset taxpayers
• For rental income in 2018, the average payment by an HNWI was RWF20 million compared to RWF0.6 million for all rental taxpayers.
Figure 3 shows that this collection is made from a very narrow base. Through the
identification of HNWIs, as discussed, it is improbable that all identified HNWIs are paying their fair share.
0 100 200 300 400 500 600 700
Fixed Asset Personal Income Rental Income
2016 2017 2018 0.00 5.00 10.00 15.00 20.00 25.00 30.00
Fixed Asset Personal Income Rental Income
18
4.4 Individuals are often not required to declare investment income
Related to the previous point, we also find that, due to provisions in the law, HNWIs often do not carry the responsibility for their own tax affairs, particularly in as far as declaring income earned from employment and investment. This presents opportunities for tax evasion. The relevant provision in the law is shown in Box 2.
The interpretation of the law in this setting is that all individuals for whom withholding tax has been paid are not themselves required to file an income tax declaration. As such, the
responsibility to declare and pay the correct amount of tax rests with the business in which the individual has invested, and not with the individuals themselves. This is at odds with what is provided for in the laws of other countries, where individuals who earn significant income are required to file an income tax return annually.12 It is, in fact, unusual even within the
region. In Kenya, for example, everyone with a taxpayer identification number must file a tax declaration. Similarly, in Uganda, individuals (other than employees with a single employer) who earn income over a certain threshold are required to file a tax return. The rationale for this requirement is to encourage individuals to take responsibility for their tax affairs. To the contrary, in Rwanda, investment income (on interest, dividends, royalties and capital gains) is predominantly taxed through withholding taxes. Withholding on investment is collected with varying degrees of success. Growth in withholding tax on interest is broadly in line with the expected growth of the tax base. However, taxes collected on capital gains, commissions, dividend and royalties do not adhere to the trajectory of the tax base, hinting that compliance is not constant as the tax base grows. Collection and declarations are both highly volatile.13
This suggests that very few withholding agents are withholding tax and very few taxpayers are declaring and paying tax under these tax heads. Further still, non-compliance might exacerbate the lack of predictable returns.
As one private practitioner pointed out, the absence of a requirement in the law for
individuals earning income from different sources to file a single income tax return results in the fragmentation of sources of income, and is a breeding ground for tax evasion.
12 In the UK, eg, individuals who earn more than GBP100,000 in one year are required to file an income tax return, even
when subject to PAYE. See, for example, https://www.gov.uk/income-tax-rates/income-over-100000 and
https://www.cullenwealth.co.uk/100000-earners-must-complete-tax-returns/. Similarly, individuals who are self-employed are required to file self-assessment returns, as long as they earn more than GBP1,000. See https://www.gov.uk/self-assessment-tax-returns/who-must-send-a-tax-return.
13 Administrative tax data provided by RRA.
Box 2 Personal Income Tax declaration requirement (Income Tax
Law N°16/2018)
An individual who carries out taxable income generating activities prepares an annual tax declaration in accordance with procedures specified by the Tax Administration and he/she presents the declaration to
the Tax Administration not later than 31March of the following tax period.
A taxpayer who is not required to file an annual tax declaration mentioned in Paragraph One of this Article is one who only receives:
1° employment income;
19
4.5 The wealthy earn income that is subject to lower tax rates
Wealthy individuals in Rwanda pay lower effective tax rates on their income than the average rate payed by those earning employment income. A number of these taxes are paid through a final withholding tax, which means that there is no supplementary tax due. Some examples suffice:
a. The marginal rate for a Rwandan person earning more than RWF100,001 per month is 30 per cent. For individuals earning monthly income between RWF30,000 and
RWF100,000 the marginal tax rate in 20 per cent.
b. The rate at which consultancy services are taxed is 15 per cent.
c. The rate at which investment earnings are taxed is (at maximum) 15 per cent. d. The tax rate on the disposal of shares is 5 per cent.
Furthermore, Law N˚16 of 13/04/2018 provides for the exemption of income arising to collective investment schemes. The intention of this law is to provide incentives to raise capital stock and investment in Rwanda. While investment that improves the productivity of the Rwandan economy is desirable, the RRA ought to be vigilant that this is not abused as a regressive tax exemption.
4.6 Some wealthy individuals evade taxes
We suspect that some HNWIs engage in tax evasion. Even though we do not have conclusive evidence of evasion, we find some evidence in our analysis. For example, we found some companies with improbably low company share capital in the data from the RDB. The reasons for this are unclear, though it is possible that the data is out-of-date and/or intentionally understated for tax avoidance purposes. One construction and hospitality company with known large-scale business engagements in Kigali is registered as having a share value of RWF5 million. While this valuation appears impossibly low, it is difficult to determine the true market value of shares that are not publicly traded. The RDB notes that while the law requires individuals to update their company share capital, this is difficult to enforce in practice. However, the RDB does review asset holdings when permitting large mortgage applications. Such checks are desirable, as they create incentives to provide accurate valuations for shares and subsequently total share capital.
Further evidence that reported share capital is not thoroughly considered by the reporters is found in the distribution. The most common total company share capital is found to be RWF1 million, with 15,000 observations. The next most common is RWF2 million, with 8,362
observations. It seems extremely unlikely that these are accurate reflections of the total share value. It is far more likely that companies are systematically stating their value as RWF1 million, without thorough consideration of the true value.
We also found that some wealthy individuals spread their assets across different individuals, identities or companies (Interviews with RRA officials). This may be organised in order to maintain a low tax profile. In addition, the ownership of many businesses can facilitate the use of deductible expenses to reduce taxable earnings. We observe numerous instances of this in the data:
• One example includes an individual who has spread wealth across two national
20
diverse assets. Only one of these numbers is registered on an RRA system. It is not clear how this has occurred.
• Another known HNWI, an owner of a large amount of equity, has shares and ownership of many firms. A significant amount of these firms are reporting losses.
We suspect that tax evasion is more widespread than we could identify using available data. Many interviewees – in both the public and the private sector – also indicated that HNWIs engage in tax planning schemes and have access to the services of professionals who market these schemes. Interviewees noted that, following the genocide many Rwandans built lives outside Rwanda. Many of these individuals subsequently returned to Rwanda, but continue to have investments abroad that are not declared in Rwanda.14 We were not able to
identify these tax planning schemes within the available data.
5 A comparative analysis of Rwanda and
Uganda
The decision to conduct a study on HNWIs in Rwanda was partly inspired by the URA’s success within a very short period after opening its HNWI unit. Our research found a few similarities and a number of differences between the two contexts.
There are two main similarities:
a. Perhaps the most significant similarity is the commitment that the senior management teams of both revenue authorities have towards the decision to look into the tax affairs of HNWIs. In the case of Uganda, the Commissioner General of the URA and the
Commissioner of Direct Taxes were instrumental in the strategies that the URA put in place to tax HNWIs (Kangave et al. 2018; Schreiber 2019). These leaders were involved in visits to prospective HNWIs, and contributed to the criteria for identifying these
individuals. Indeed the initial success of the HNWI project is attributable in large part to the URA’s leadership. Similarly, while Rwanda is yet to have any policies in place, the senior management team of the RRA made a collective and enthusiastic decision to support this study, and are keen to act on its findings.
b. There are also similarities in some of the compliance issues related to these individuals. In both countries, it is apparent that there is tax loss under PIT as well as rental income tax. The URA increased revenue collection by targeting these areas. The RRA also suspects that there is significant tax at risk associated with the affairs of these individuals. In both Uganda and Rwanda, a small proportion of these individuals declare income tax every year. The rectification of these low filing rates is a pre-requisite for monitoring these individuals and understanding the tax affairs of the wealthy in both contexts.
There are a number of differences between the experiences of the two countries:
a. The responsibilities that the law places on individual taxpayers in the two countries are different. As noted in Section 4, in Rwanda taxpayers earning only investment and employment income are not required to file income tax returns. The responsibility lies
21
with the person paying the income to withhold tax. In contrast, even though taxes are withheld on some of these payments in Uganda, individuals are still required to file income tax returns. The exception is for individuals who have only one employer. b. In Uganda, directors of companies are required to file personal income tax returns. This
is not a requirement in Rwanda. Similarly, while partnerships in Uganda are treated as pass-through entities, where partners are required to file PIT returns on their share of partnership profits, in Rwanda partnerships are treated much like companies, with no requirement for individual partners to file separate returns. This implies that upon distribution of profits, the taxes withheld are a final tax. These distinctions have
implications for the perceived levels of compliance in the two countries. While it was easy to identify the low levels of tax compliance in Uganda because of a failure of these
individuals to file individual income tax returns, the levels of tax evasion may be a lot higher in Rwanda, but disguised by the absence of this filing requirement.
c. In Uganda, some wealthy individuals do not pay taxes because they are either politicians or politically connected individuals who feel that they are above the law (Kangave et al. 2018). However, the opinion voiced by several interviewees in Rwanda is that those who are not paying taxes are most likely engaged in tax avoidance – not outright evasion. Many interviewees felt that the political climate in Rwanda is such that no-one is above the law, and that as long as the RRA has identified someone as a taxpayer, it does not matter what position they hold in society. They still have to pay their taxes. Consequently, while interviewees in Uganda felt that wealthy individuals engaged in outright evasion, interviewees in Rwanda felt that those who did not honour their tax obligations were involved in tax-planning schemes. Given that we could not verify the interviewees’ convictions with the available data, we can only state here that evasion in Uganda appears to be more outright than in Rwanda.
d. We note that Rwanda is very advanced in the use of digital technologies, which makes it easier for government agencies to share information. Information sharing is also easier because the RRA is a highly respected entity. As we observe in Section 4, our research was greatly supported by the responsiveness of officials in other government agencies. The RRA, as has been noted elsewhere, occupies an important position in the
restructuring of Rwanda, and enjoys significant political support and backing (Land 2004). As Land observes: ‘It has in particular enjoyed the personal support of the President, who has gone on to play a major part in the campaign to change public attitudes towards paying taxes and corruption’. In Uganda, we found that some government departments still use manual systems, and systems are not interfaced even where they are automated (Kangave et al. 2016). We also found that both within the URA and between the URA and other government agencies, there was less eagerness to share information. All of this affects the ability of the URA to adequately utilise data.
6 What should the RRA do to identify and tax
wealthy individuals?
The purpose of this research was to understand the tax landscape in Rwanda for wealthy individuals. This understanding is to feed into actionable recommendations for the RRA to support revenue mobilisation and the integrity of the tax system. This section sets out some recommendations.
22
The key requirement for the taxation of Rwanda’s wealthy is declaration of income by these individuals. The declaration of income for tax purposes allows for more engagement with these individuals, as well as providing the basis for audit and investigation. One
advantageous element of the tax law in Rwanda is that the PIT declaration requires a balance sheet declaration, as well as a declaration of income. This paper recommends two (complementary) methods of increasing the number of declarations filed by HNWIs.
First, the relationship between HNWIs and the RRA can be fostered through taxpayer sensitisation. The identified individuals can be notified that the RRA is aware that they are individuals with substantial wealth, and that going forward they expect to receive income tax declarations on their behalf. The RRA could offer to provide support by guiding those
individuals who have difficulty with filling out declarations. We feel that this approach has potential in Rwanda owing to a high level of patriotism, and a strong reverence for the country’s leadership. Indeed, there is already evidence to support the fact that, at least in Rwanda, friendly messages to large taxpayers produce more positive results than deterrence messages (Mascagni et al. 2017). In a large tax experiment conducted in 2016, researchers sought to answer the question: what are the key drivers of tax compliance in Rwanda? They sent out three messages to taxpayers: a deterrence message (detailing the penalties for non-compliance); a benefits message (showing how taxes are used to fund public services); and a reminder (which simply informed taxpayers of the deadlines for paying taxes). While they found that the deterrence message had a great impact on small-scale taxpayers, they found that among the larger taxpayers the reminder and benefits message were more effective than the deterrence message. As was the case in Uganda, a careful communication strategy may determine the success, or otherwise, of taxing the assets of Rwanda’s wealthiest. Second, as previously referenced, the legislation in Rwanda provides HNWIs with
justifications for not filing their income. Article 13 should be reviewed to consider whether the RRA should require individuals who earn income other than employment income to make declarations for income tax. This requirement would provide more information to the RRA about investment activities of HNWIs. Furthermore, it may prove to be a strong tool for increasing compliance with withholding tax, for which collection is currently low. This would align Rwanda to the practise of other authorities in the region. These declarations should subsequently be monitored by RRA staff. A desk team has the advantage of familiarity with the assets and affairs of these individuals. The emphasis in such a unit should be placed on supporting the HNWIs in compliance. The tax affairs of the wealthy are complex. The RRA and HNWIs stand to benefit when this team understands the affairs of HNWIs, and supports them in filing and paying the requisite amount of tax. Given that the initial number of
identified HNWIs is small, this team would not need to be solely dedicated to HNWIs. A similar task has been recently assigned to two staff to track the declarations of NGOs in Rwanda, a team well-suited to track the declarations of HNWIs. To verify and cross-check the legitimacy of the declaration of these individuals, the team should request bank account information of suspected cases. These cases can subsequently be used to gauge the compliance gap for individuals from whom no information is requested.
Lastly, our research revealed that there are some cases of tax evasion, and possibly cases of tax planning, which are difficult to detect due to the limited capacity of RRA’s officials. Worldwide, revenue authorities battle with the twin problems of tax evasion and tax planning. However, some have made better progress than others in detecting the same. The RRA should build the capacity of its officials, particularly in the intelligence unit and the
international tax unit, to identify cases of tax evasion and the extent to which taxpayers use tax planning schemes. The capacity-building strategy could take two forms: (a) formal
23
training, and (b) learning journeys that are established through interaction with other revenue authorities in and outside the region. These exchanges need to be held on a continuous basis to have an impact.
24
References
Allingham, M.G. and Sandmo, A. (1972) ‘Income tax evasion: A theoretical analysis’, Journal
of Public Economics 1: 323-338
Alstadsæter, A., Johannesen, N. and Zucman, G. (2017) Tax Evasion and Inequality, NBER Working Paper No. 23772, Cambridge, MA: National Bureau of Economic Research Auerbach, A.J. and Slemrod, J. (1997) ‘The Economic Effects of the Tax Reform Act of
1986’, Journal of Economic Literature 35(2): 589-632
Behuria, P. (2016) ‘Centralising rents and dispersing power while pursuing development? Exploring the strategic uses of military firms in Rwanda’, Review of African Political
Economy 43: 150, 630-647
——
(2015) ‘Between party capitalism and market reforms – understanding sector differences in Rwanda’, Journal of Modern African Studies 53(3): 415-450Booth, D. and Golooba-Mutebi, F. (2012) ‘Developmental Patrimonialism? The Case of Rwanda’, African Affairs 111: 379-403
Cohen, R.S., Lai, A.E. and Steindel, C. (2015) ‘A Replication of ‘Millionaire Migration and State Taxation of Top Income: Evidence from a Natural Experiment’ (National Tax Journal 2011), Public Finance Review 43(2): 206-225
Cooper, M., McClelland, J., Pearce, J., Prisinzano, R., Sullivan, J., Yagan, D., Zidar, O. and Zwick, E. (2015) Business In The United States: Who Owns It And How Much Tax Do
They Pay, NBER Working Paper No. 21651, Cambridge, MA: National Bureau of
Economic Research
Fairfield, T. (2013) ‘Going Where the Money Is: Strategies for Taxing Economic Elites in Unequal Democracies’, World Development 47: 42-57
——
(2010) ‘Business Power and Tax Reform: Taxing Income and Profits in Chile and Argentina’, Latin American Politics and Society 52(2): 37-71Giertz, S.H. and Mortenson, J.A. (2014) ‘Policy Uncertainty and Rent Seeking by Firms and CEOs: Implications for Efficiency and Optimal Tax Rates’, Proceedings. Annual Conference on Taxation and Minutes of the Annual Meeting of the National Tax
Association Vol. 107 pp. 1-15
Gokgur, N. (2012) Rwanda’s ruling-party owned enterprises: do they enhance or impede
development?, Discussion Paper Institute of Development Policy and Management
ISSN 2033-7329
Goodfellow, T. (2017) ‘Taxing property in a neo-developmental state: the politics of urban land value capture in Rwanda and Ethiopia’, African Affairs 116(465): 549-572
25
——
(2015) Taxing the urban boom: property taxation and land leasing in Kigali and AddisAbaba, ICTD Working Paper 38, Brighton: International Centre for Tax and
Development
——
(2014) ‘Rwanda’s political settlement and the urban transition: expropriation, construction and taxation in Kigali’, Journal of East African Studies 8(2): 311-329 Goolsbee, A. (2000) ‘What Happens When You Tax the Rich? Evidence from ExecutiveCompensation’, Journal of Political Economy 108(2): 352-378
International Monetary Fund (2020) Special Series on Fiscal Policies to Respond to COVID-19, Washington DC: International Monetary Fund
Jibao, S., Prichard, W. van den Boogaard, V. (2017) Informal Taxation in Post Conflict Sierra
Leone: Taxpayers’ Experiences and Perceptions, ICTD Working Paper 66, Brighton:
Institute of Development Studies
Kangave, J., Nakato, S., Waiswa, R., Nalukwago, M., and Lumala Zzimbe, P. (2018) What can we learn from the Uganda Revenue Authority’s Approach to Taxing High Net
Worth Individuals?, ICTD Working Paper 72, Brighton: Institute of Development Studies
—— —— ——
and Lumala Zzimbe, P. (2016) Boosting Revenue Collection through TaxingHigh Net Worth Individuals: the Case of Uganda, ICTD Working Paper 45, Brighton:
Institute of Development Studies
Keen, M. (2012) Taxation and Development – Again, IMF Working Paper WP/12/220, Washington DC: International Monetary Fund
Kogler, C., Muehlbacher, S. and Kirchler, E. (2015) ‘Testing the “Slippery Slope Framework” among Self-Employed Taxpayers’, Economics of Governance 16: 125-142
Land, A. (2004) Developing Capacity for Tax Administration: The Rwanda Revenue
Authority, Discussion Paper No 57D, Maastricht: European Centre for Development
Policy Management
Ligomeka, W. (2019) Assessing the Performance of African Tax Administrations: A Malawian
Puzzle, ICTD African Tax Administration Paper 14, Brighton: Institute of Development
Studies
Mascagni, G., Santoro, F., Mukama, D., Karangwa, J. and Hakizimana, N. (2020) Active
Ghosts: Nil-filing in Rwanda, ICTD Working Paper 106, Brighton: Institute of
Development Studies
——
Nell, C. and Monkam, N. (2017) One Size Does Not Fit All: A Field Experiment on theDrivers of Tax Compliance and Delivery Methods in Rwanda, ICTD Working Paper 58,
Brighton: Institute of Development Studies
——
Monkam. N., Nell, C. (2016) Unlocking the potential of administrative data in Africa: TaxCompliance and Progressivity in Rwanda, ICTD Working Paper 56, Brighton: Institute
26
Ministry of Local Government, Rwanda (2016) ‘Revised Ubudehe Categories are Out’, <http://www.minaloc.gov.rw/index.php?id=469&tx_ttnews%5Btt_news%5D=461&cHas h=73a0ab3f4bcf956765ddc0eb2b88b538>
Moore, M. and Prichard, W. (2020) ‘How should we tax after the pandemic?’, ICTD Blog,
<https://www.ictd.ac/blog/how-tax-after-pandemic-covid/?fbclid=IwAR25_X9z52JkgYlyUGcL26SscG_wmovnxS7arNWJjs_ZPpphtnpMnw xG3Xw>
—— ——
and Fjeldstad, O-H. (2018) Taxing Africa: Coercion, Reform and Development, London: Zed Books—— ——
(2017) How Can Governments of Low Income Countries Collect More TaxRevenue?, ICTD Working Paper 70, Brighton: Institute of Development Studies
National Audit Office (2016) HMRC’s approach to collecting tax
from High Net Worth Individuals, HC 790 SESSION 2016-17, HM Revenue and
Customs
OECD (2015) Strengthening Tax Systems to Mobilise Domestic Resources in the Post-2015
Development Agenda, OECD and Post-2015 Reflections,Element 11, Paper 2
——
(2009) Engaging with High Net Worth Individuals on Tax Compliance, OECD Publishing, Paris, <https://doi.org/10.1787/9789264068872-en>——
/ATAF/AUC (2018) Revenue Statistics in Africa 1990-2016, Paris: OECD Publishing, <http://dx.doi.org/10.1787/9789264305885-en-fr>Olken, B.A. and Singhal, M. (2011) ‘Informal Taxation’, American Economic Journal: Applied
Economics 3: 1-28
Piketty, T., Saez, E. and Zucman, G. (2013) Rethinking capital and wealth taxation, preliminary version
Prichard, W. (2020) ‘To help respond to Covid-19, African governments should prioritise taxing the rich’, ICTD Blog, <https://www.ictd.ac/blog/respond-covid19-african-governments-tax-rich/>
——
(2018) What Might an Agenda for Equitable Taxation Look Like?, ICTD Summary Brief 16, Brighton: Institute of Development StudiesRuberangeyo, T., Ayebare, C. and de Bex, A. (2011) ‘Social Protection: an Ongoing
Process’, in United Nations Development Programme, Sharing Innovative Experiences:
Successful Social Protection Floor Experiences, New York: UNDP
Rwanda Development Board. (2017) 2017 Annual Report, <https://rdb.rw/wp-content/uploads/2018/08/RDB-Annual-Report-2017-Final.pdf>
27
Saez, E., Slemrod, J.B. and Giertz, S.H. (2009) The Elasticity Of Taxable Income With
Respect To Marginal Tax Rates: A Critical Review, NBER Working Paper No. 15012,
Cambridge, MA: National Bureau of Economic Research
Schreiber, L. (2019) Bolstering Revenue, Building Fairness: Uganda Extends its Tax Reach,
2014 -2018, Innovations for Successful Societies, Princeton University,
<https://successfulsocieties.princeton.edu/>
Tanzi, V. (2012) ‘Equity, Transparency, Cooperation and the Taxation of High Net Worth Individuals’, Asia-Pacific Tax Bulletin 299-307
United Nations (2015) Resolution Adopted by the General Assembly on 27 July 2015: Addis Action Agenda of the Third International Conference on Financing for Development Agenda Item 18
van den Boogaard, V. (2018) Gender and the formal and informal systems of local public
finance in Sierra Leone, ICTD Working Paper 87, Brighton: Institute of Development
Studies
World Bank (2016) Identification for Development Country Diagnostic: Rwanda, Washington DC: World Bank
Young, C. and Varner, C. (2014) ‘Do millionaires migrate when tax rates are raised?’,