Inland Waters (2016) 6, pp.509-522 © International Society of Limnology 2016 DOI: 10.5268/IW-6.4.866
Article
Quantifying pelagic phosphorus regeneration using three methods
in lakes of varying productivity
Lesley B. Knoll,1,2* Anne Morgan,3 Michael J. Vanni,3 Taylor H. Leach,3 Tanner J. Williamson,3 and Jennifer
A. Brentrup3
1 Lacawac Sanctuary Field Station, Lake Ariel, PA, USA
2 University of Minnesota Itasca Biological Station and Laboratories, Lake Itasca, MN, USA 3 Department of Biology, Miami University, Oxford, OH, USA
*Corresponding author: [email protected]
Received 2 May 2015; accepted 27 June 2016; published 2 November 2016
Abstract
Phosphorus (P) is often a limiting nutrient in freshwater ecosystems, and understanding P dynamics in lakes is critical
for eutrophication management. Pelagic P regeneration can support a large fraction of primary production in stratified
freshwaters. Various techniques have been used to quantify pelagic P regeneration including (1) P mass balance supply– demand, (2) regression using total P as a predictor, and, more recently, (3) whole-lake metabolism calculated from high-frequency dissolved oxygen (DO) data. To our knowledge no study comparing these methods in multiple lakes has been performed. To compare these 3 approaches, we investigated 3 Global Lake Ecological Observatory Network (GLEON) lakes that differ in productivity: Acton, a Midwestern USA hypereutrophic reservoir; and 2 Northeastern USA glacial lakes, oligotrophic Giles and mesotrophic/dystrophic Lacawac. In Acton, we used all 3 methods, but for Giles and Lacawac we used only the total P regression and metabolism techniques. Our results show the best agreement among methods in the mesotrophic lake, whereas the metabolism approach underestimated regeneration in the oligo-trophic lake and overestimated regeneration in the hypereuoligo-trophic reservoir compared with other methods. P regenera-tion rates for the hypereutrophic reservoir were the most sensitive to the metabolism-based input parameters. Our study illustrates a novel use of high-frequency DO data, which are commonly collected on many GLEON buoys, to understand lake nutrient dynamics.
Key words: GLEON, high-frequency sensors, lakes, metabolism, nutrient recycling, phosphorus regeneration, primary production
Introduction
Early limnologists noted little variation in epilimnetic phosphorus (P) concentrations as summer progressed, whereas epilimnetic phytoplankton biomass was constant
or even increased (Juday et al. 1927). This finding was
unexpected because P limitation is prevalent in freshwater aquatic ecosystems (Schindler 1977, Smith 1979, Elser et al. 1990), and bioavailable P concentrations in lakes are often low during summer when phytoplankton biomass is maximal. Thus, efforts have been made to understand how
primary production is maintained at high levels in the
epilimnion of thermally stratified lakes during the summer,
despite low new P inputs (e.g., from the catchment or deep
P-rich waters). One important flux is P regeneration from
zooplankton and pelagic bacteria. Nutrients regenerated (i.e., recycled, mineralized) by planktonic organisms are
capable of supplying a quantitatively significant portion of
the nutrients needed for phytoplankton growth (Sterner et al. 1995, Vanni 2002). Nutrient regeneration by smaller planktonic organisms, including heterotrophic microbes and zooplankton, can supply much of the epilimnetic
dissolved P in low-nutrient lakes during summer thermal
stratification (Dodds et al. 1991), and zooplankton nutrient
excretion has been shown to support 4–58% of lake phyto-plankton P demand (Vanni 2002).
Various techniques exist to quantify epilimnetic P re-generation. The radioisotope phosphate 33PO
4 has been
used to label plankton communities to quantify the transfer of P from the particulate pool to the dissolved pool (i.e., P regeneration) via egestion, excretion, decay, cell lysis, cellular exudates, and sloppy feeding (Hudson and Taylor 1996, Hudson et al. 1999, Nowlin et al. 2007). In one radioisotope study, the authors developed a predictive regression for steady-state phosphate (hereafter ssPO4-P) regeneration rates based on total phosphorus
(TP) concentrations from lakes spanning a productivity gradient (Hudson et al. 1999). P budgets accounting for epilimnetic P supply and demand have also been used to estimate P regeneration (Caraco et al. 1992, Domine et al. 2010). These studies showed that both new P (i.e., from outside the euphotic or mixed zone) and regenerated P are important in sustaining phytoplankton production.
A new approach to quantify P regeneration takes advantage of high-frequency dissolved oxygen (DO) data used to estimate phytoplankton primary production as well as autotrophic and heterotrophic respiration (Kamarainen et al. 2009). Ecosystem respiration is measured directly and apportioned into that by autotrophs and heterotrophs. Once heterotrophic respiration is estimated, P regeneration can be calculated by assuming that planktonic heterotrophs regenerate P as a function of their respiration rate and the carbon to phosphorus ratios (C:P) in seston. P demand can also be calculated using estimated net primary production divided by the seston
C:P ratio (which is assumed to reflect phytoplankton
C:P). This newly developed metabolism method was used in a eutrophic lake (Kamarainen et al. 2009) but to our knowledge has not been tested in lakes of varying trophic status. Instrumented buoys capable of collecting high-fre-quency DO data that can be used to obtain metabolism estimates are becoming more common in lakes worldwide. Thus, this approach may prove useful for un-derstanding the relative importance of nutrient regenera-tion in supporting phytoplankton growth in diverse lakes and how this varies seasonally.
We took advantage of 3 lakes with instrumented buoys within the Global Lake Ecological Observatory Network (GLEON), a network of lakes, high-frequency sensor data, and people (Weathers et al. 2013); many recent studies have contributed insights into lake ecosystem function using GLEON data in diverse lakes (Jennings et al. 2012, Klug et al. 2012, Read et al. 2012, Solomon et al. 2013). Using 3 lakes that represented a productivity gradient, we compared 3 methods of
estimating P regeneration: (1) P mass-balance supply– demand (P budget), (2) regression using TP as a predictor, and, (3) whole-lake metabolism calculated from high-fre-quency DO data. We used the TP regression and metabolism approaches over 1 summer in 2014 for 2 glacial lakes in Northeastern USA, 1 oligotrophic, and 1 mesotrophic/dystrophic. For a hypereutrophic constructed
reservoir in Midwestern USA, we used the first 2
approaches as well as a P budget over 2 summers in 2011 and 2012. We addressed 3 questions: (1) in the 2 natural lakes, how do P regeneration rates compare across the 2 methods (TP regression and metabolism); (2) in the hy-pereutrophic reservoir, how do P regeneration rates compare across the 3 methods; and (3) using the metabolism method, does estimated pelagic P regenera-tion supply an important proporregenera-tion of estimated pelagic P demand, and does this vary among the 3 lakes? We were also interested in understanding how the approaches compare given that P regeneration derived from the
metabolism method and budget methods is quantified as
soluble reactive phosphorus (SRP) but as ssPO4-P in the
TP regression approach. Studies have shown that ssPO4-P
concentrations from steady state bioassays are ~2.5 orders of magnitude lower than corresponding SRP con-centrations (Hudson et al. 2000, Nowlin et al. 2007). Our overarching objective was to better understand the utility of the new P regeneration approach in comparison to the other methods in lakes of varying productivity.
Methods
Study lakes
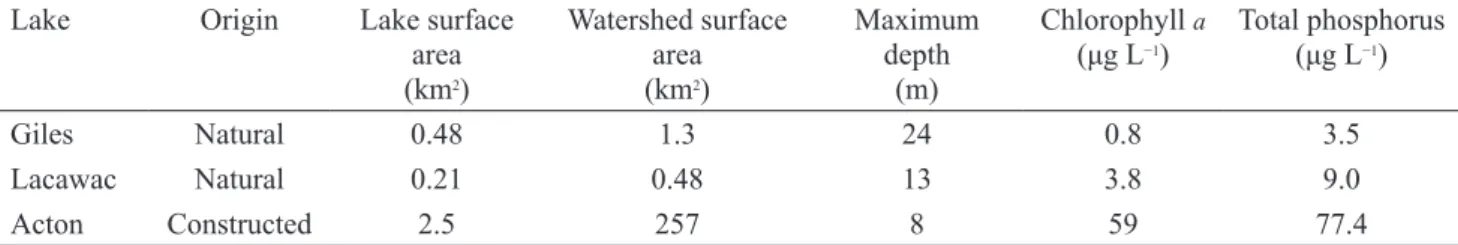
Acton Lake is a hypereutrophic reservoir in southwestern Ohio, USA (Table 1). The portion of the reservoir near the
stream inflows is shallow (~1 m) and does not thermally
stratify during the summer, whereas near the dam, the reservoir is deep enough to stratify during the summer months (~8 m when the lake is at full pool). Mean depth is ~3.9 m. For this study, we focused only on samples collected at a deep site near the dam, but we estimated
fluxes for the entire mixed layer. As a productive reservoir,
most primary production occurs in the upper portion of
the reservoir, and the euphotic zone depth (as defined by
the depth of 1% photosynthetically active radiation [PAR]) is generally shallower than or equal to the mixed layer. Acton’s watershed is 89% agricultural land, the vast majority of which is cropland dominated by soy and corn
(Knoll et al. 2003). Acton has 3 main inflow streams,
Little Four Mile Creek, Four Mile Creek, and Marshall’s Branch, that are gauged and collectively represent 86% of the watershed drainage (Vanni et al. 2001). Acton has one
Acton are mostly P limited during the stratified period
(Vanni et al. 2006a, Hayes et al. 2015).
Lake Giles and Lacawac are small, natural, glacially formed lakes in northeastern Pennsylvania, USA (Table 1). Giles is a deep oligotrophic lake that thermally
stratifies each summer. The euphotic zone of Giles is
much deeper than the mixed layer (~12 vs. ~4 m), and a sub-epilimnetic peak of phytoplankton biomass occurs during summer months. Giles has a forested watershed with minimal anthropogenic disturbance (Williamson et al. 2014). Giles receives water by rainfall, seepage, and to a lesser extent by a small stream draining a forested wetland, and has only one small outlet stream. Lake Lacawac is a mesotrophic and moderately dystrophic lake
that thermally stratifies each summer. Similar to Giles,
the euphotic zone of Lacawac is deeper than mixed layer (~5 vs. ~2 m), and at times a sub-epilimnetic peak of phy-toplankton biomass occurs during summer months. Lacawac has a forested watershed located within a nature preserve and has been protected since the 1960s (Williamson et al. 2014). Lacawac receives water by rainfall and seepage and has one small outlet stream. Lacawac and Giles phytoplankton are at times co-limited by P and N (L.B. Knoll, unpubl. data).
TP regression approach – Giles, Lacawac, Acton For all lakes, weekly TP samples were collected at the deepest spot of the waterbody using an integrated tube
sampler when stratification was well established (Jun–
mid-Aug). In Giles and Lacawac, samples were collected from the epilimnion as determined by a temperature
profile (YSI-57, YSI Inc., Yellow Springs, OH, USA). In
Acton, samples were collected in the euphotic zone as
determined by a PAR profile (LI-COR spherical sensor,
LI-COR Biosciences, Lincoln, NE, USA). TP was
estimated on unfiltered and acidified (pH < 2) water
samples preserved at 4 °C. Samples were analyzed on a Lachat autoanalyzer (QC 8000 FIA or QC 8500 FIA; Lachat Instruments, Loveland, CO, USA) using the acid molybdate method following potassium persulfate digestion. We estimated ssPO4-P regeneration rates weekly
from integrated TP concentrations and an established regression (Hudson et al. 1999):
log10 P regeneration rate (ng ssPO4-P L−1 h−1) =
1.0077(log10TP (μg L−1)) + 0.7206) (1)
We then converted rates to ssPO4-P mg m−2 d−1. This
regression was developed by Hudson et al. (1999) using a method in which the release of dissolved P by the plankton community is measured using plankton labeled with radiophosphate.
Metabolism approach – Giles, Lacawac, Acton We used metabolic inference to calculate SRP regenera-tion from high-frequency measurements of whole-lake metabolism: gross primary production (GPP) and ecosystem respiration (ER; Kamarainen et al. 2009). We collected free-water DO measurements (at 1 m for Giles and Lacawac and at 1.5 m for Acton), water temperature
profiles, PAR, and wind speed data with fully automated
instrumented buoys at 15-minute intervals in Acton and at 10-minute intervals in Giles and Lacawac. In Acton,
DO profiles were used to determine mixing depth,
assumed to be where DO was >1 mg L−1, and mixing
depth was truncated at mean lake depth (3.9 m). For the 2 Pennsylvania lakes, mixing depth was determined by
high-frequency temperature profile data. For all lakes,
we used a maximum likelihood model within the metab function in the R package LakeMetabolizer to calculate GPP, NEP, and ER (R Development Core Team 2013, Winslow et al. 2015, 2016). Air–water gas exchange
velocity and gas flux coefficient used in the calculation
of GPP, ER, and NEP were calculated using the methods
derived from Cole and Caraco (1998), as specified in the
cole method in the LakeMetabolizer package (Winslow et al. 2016). Similar to other studies, data were screened before analysis to remove out-of-range or instrument error measurements (33–56% of data), and we aggregated daily values to the weekly scale (Staehr and Sand-Jensen 2007). GPP, ER, and NEP were converted from mg L−1 d−1 of O
2 to mg m−2 d−1 of C by multiplying
by 0.375 (mass ratio of O2 to C, assuming a
photosyn-thetic quotient of 1) and then using the mean depth of the lake to convert rates to areal units (Kamarainen et al. 2009).
Lake Origin Lake surface area (km2) Watershed surface area (km2) Maximum depth (m) Chlorophyll a (μg L−1) Total phosphorus (μg L−1) Giles Natural 0.48 1.3 24 0.8 3.5 Lacawac Natural 0.21 0.48 13 3.8 9.0 Acton Constructed 2.5 257 8 59 77.4
We estimated net primary production (NPP) by subtracting autotrophic respiration (Rauto) from GPP. Rauto
varies among lakes, and its importance relative to ER has been shown to increase with lake productivity; Biddanda et al. (2001) found that Rauto is ~2–18% of planktonic ER
in oligotrophic lakes and ~90% in eutrophic lakes. Another study estimated that Rauto can range from 35 to 60% of total
respiration, with lower percentages in oligotrophic lakes and higher percentages in eutrophic lakes (del Giorgio and Peters 1993). For Acton, we estimated the relative contri-bution of Rauto to ER by comparing data from 14C
incubations (which provides rates close to NPP) with data from the O2 method (which provides GPP) obtained
simul-taneously over 3 field seasons (2010–2012). 14C-based
NPP was usually estimated at 2-week intervals between late April and late September but occasionally more frequently. The 14C method interpolates NPP between
measurement dates using the photosynthesis–irradiance curves from the incubations and intervening data on
depth-specific chlorophyll a (Chl-a) and PAR (Knoll et al. 2003). Thus, for each date on which NPP was measured using 14C
(41 dates), we obtained a weekly mean NPP estimate using the measurement date as well as 3 days before and after the rate measurement. Then we obtained mean GPP from the O2 method using the same dates.
The 2 rates were significantly correlated, indicating
that the methods were in good general agreement (log GPP = 1.689 + 0.693*logNPP, r2 = 0.444, p < 0.0001, n = 37).
For each of these weekly estimates, we also calculated
Rauto as GPP − NPP and then obtained the Rauto:ER ratio for
each week. We also calculated this ratio as mean Rauto
(using all dates) divided by mean ER (using all dates). These analyses showed that the Rauto:ER ratio was 0.688
(using the mean of weekly ratios) or 0.722 (using the ratio of mean Rauto to mean ER). Thus, we assumed Rauto was
70% for Acton, implying that heterotrophic respiration
(Rhetero) is 30% of ER, which is within the range reported
by Biddanda et al. (2001), and it brackets estimates for eutrophic lakes found by Biddanda et al. (2001) and del Giorgio and Peters (1993; ~10 and 40%, respectively). Because of these differences, however, we also present average regeneration rates over the summer based on 90% Rauto (Biddanda et al. 2001). We do not have NPP (14C)
data for the 2 natural lakes; therefore, based on previous studies we estimated that in the lower productivity Lacawac and Giles, Rauto was 30% of total respiration.
Estimates vary for Rauto in lower productivity lakes, so we
also present average regeneration rates over the summer based on a high estimate for Rauto of 50%. In all lakes,
Rhetero was estimated as ER − Rauto.
We estimated P regeneration (equation 2) and P demand (i.e., uptake; equation 3) following Kamarainen et al. (2009) as:
P regeneration = Rhetero ÷ seston C:P, and (2)
P demand = NPP ÷ seston C:P, (3) where NPP is net primary production from DO metabolism estimates, seston C:P is the seston carbon to phosphorus ratio, and Rhetero is the respiration attributed to
heterotrophic bacteria. For P regeneration, this calculation assumes zero net heterotrophic growth and that the C:P of regeneration corresponds with the C:P of the seston available for mineralization (Kamarainen et al. 2009). The P demand calculation assumes that seston C:P represents the C:P of the phytoplankton community.
P budget approach - Acton
We also used an SRP budget supply–demand approach to estimate SRP regeneration for Acton in 2011 and 2012. New sources of SRP to the mixed layer included watershed loading, SRP excretion by sediment-feeding
fish (gizzard shad [Dorosoma cepedianum]), and entrainment from anoxic water. SRP export via the dam outlet was considered a loss from the system. Phyto-plankton P demand and bacteria P demand were also
quantified. SRP regeneration was calculated as (Domine
et al. 2010):
SRP regeneration = (phytoplankton P demand + bacteria P
demand + SRP loss from dam) − (SRP watershed loading
+ SRP gizzard shad excretion + SRP entrainment). (4)
We quantified Acton watershed loading on the 3 afore -mentioned streams that drain 86% of the watershed (Vanni
et al. 2001, Renwick et al. 2008). Briefly, we employed a high-frequency, flow-dependent sampling regime utilizing
ISCO automated water samplers (Teledyne ISCO, Lincoln, NE, USA) located on each stream. We collected
samples ~3 times per week during baseflow and every 8
hours during storm events, when nutrient concentrations (including SRP) change rapidly (Vanni et al. 2001).
Stream SRP samples were filtered through Gelman A/E glass fiber filters, acidified (pH < 2) and then preserved at
4 °C and analyzed as described above for TP. Stream stage was recorded every 10 minutes using data logging pressure transducers (Vanni et al. 2001, Renwick et al. 2008, Knoll et al. 2013). Hourly nutrient concentrations
were obtained using flow-proportionate interpolation
methods (Vanni et al. 2001). SRP loading was calculated from the product of hourly SRP concentration and hourly
stream discharge, scaled to daily fluxes for the entire
watershed (see Vanni et al. 2001 for detailed nutrient export calculations).
Non-larval gizzard shad are facultative detritivores, and during mid to late summer young-of-year and adult gizzard shad are detritivorous in Ohio reservoirs (Higgins
et al. 2006). These fish make up ~94% of the fish biomass and represent a quantitatively important flux of nutrients
from the sediments to the pelagic zone of lakes during summer months (Vanni et al. 2006b). To estimate gizzard
shad SRP excretion rates, we used size-specific data on fish abundance from hydroacoustics and per-fish excretion rates that are a function of fish wet mass and temperature
(Vanni et al. 2006b).
SRP entrainment into the mixed layer from anoxic
waters was estimated using weekly DO profiles and weekly depth-specific SRP concentrations taken at 1 m
intervals with a Van Dorn water sampler. We used DO
profiles rather than temperature profile data because lateral flows of water in reservoirs affect thermal stratifi
-cation, and oxygen profiles offer a better estimate of mixed layer depth than temperature profiles (Melack
1978, Dickman et al. 2006). An entrainment event occurred when there was an increase in the mixed layer depth by 0.5 m or more. This change in mixing depth
could cause an influx of hypolimnetic P representing a
new input of P to the mixed layer. We used the volume of water represented by this increase and the SRP concentra-tion of the entrained depths to calculate weekly
entrainment SRP fluxes. SRP concentrations were quantified as described earlier.
SRP loss from the dam was quantified as the product
of SRP concentration and discharge over the dam (Domine et al. 2010). Water for SRP was collected weekly from the
outflow site in the 0–1 m layer using a Van Dorn water
sampler. SRP was analyzed as described earlier. We linearly interpolated SRP concentrations for days when samples were not collected. Discharge over the dam was estimated hourly by using a water budget that takes into account all water inputs and outputs (Knoll et al. 2013). We considered the following water inputs: (1) stream discharge from the 3 gauged streams scaled up to the entire watershed, and (2) hourly precipitation; and the following water outputs: (1) potential evapotranspiration using hourly precipitation and temperature data, and (2) change in lake volume calculated using hourly lake level data (continuously recorded via a lake level gauge) and lake bathymetry.
Phytoplankton P demand was calculated using phyto-plankton primary production from 14C fixation rates and
seston C:P ratios (Vanni et al. 2006b). We divided primary production rate (C: mg m−2 d−1) by seston C:P (mg C to mg
P) to estimate P demand (P: mg m−2 d−1), assuming that seston C:P ratios reflect phytoplankton C:P ratios (Sterner
and Elser 2002). Primary production experiments were conducted every other week using integrated water
collected from the euphotic zone at the outflow site
following previous methods (Knoll et al. 2003, Vanni et al.
2006b). Briefly, we quantified phytoplankton 14C uptake at
a range of PAR levels in an environmental chamber kept at lake temperatures. We generated Chl-a–specific photosyn -thesis–irradiance curves, which were then used with
depth-specific in-lake PAR (every 0.5 m) and Chl-a concentra-tions (every 1 m) to obtain daily lake-wide primary production rates, corrected for lake morphometry.
Depth-specific water samples were collected for Chl-a
concentration. Water was filtered onto Gelman A/E glass fiber filters, frozen in the dark until analysis. Chl-a was extracted with ethanol in the dark at 4 °C for 2–24 hours
and quantified with a fluorometer (Turner Designs, Sunnyvale, CA, USA). Depth-specific PAR was collected
as described earlier. Water for particulate C and particulate P was collected weekly with an integrated tube sampler
from the euphotic zone at the outflow site and screened with a 63 μm mesh to remove large zooplankton. Particulate C samples were filtered onto pre-combusted 25 mm Gelman A/E glass fiber filters and particulate P onto pre-combusted 47 mm Gelman A/E glass fiber filters.
Particulate C samples were analyzed on a CN elemental analyzer (CE Elantech Flash EA 1112, Lakewood, NJ,
USA), and particulate P filters were digested with HCl and
analyzed for SRP as described earlier.
We estimated bacteria P demand using previous data
collected on Acton (Caston et al. 2009). Specifically,
bacterial production was found to be ~10.4% of primary
production, and the C:P of bacteria-sized particles (<1 μm) was 40.1 (mass:mass). Using primary production
rates described earlier and these values, we estimated bacteria P demand (P: mg m−2 d−1) by dividing estimated
bacteria production (C: mg m−2 d−1) by 40.1 (estimated C:P < 1 μm).
Statistics
Bootstrapping was used to provide error estimates on P regeneration rates calculated from the TP regression approach, metabolism approach, and the P budget approach. Bootstrap values represent bias corrected mean (±1 standard error) summer values (Jun–mid-Aug) generated by blocked time series bootstrapping (block length = time series length1/3, iterations = 10 000).
All simulations were run using the using the tsboot function in the boot R package (Kunsch 1989, R Development Core Team 2013).
We also used a simple deterministic sensitivity analysis procedure (Loucks and van Beek 2005) to examine the sensitivity of P regeneration rates calculated from metabolism approach to changes in the input parameters (i.e., Rhetero and seston C:P). We restricted our
sensitivity analyses to only Rhetero and C:P parameters. We
did not vary all of the parameters that go into metabolism estimates (e.g., wind, gas exchange) because understand-ing metabolism model assumptions is an active research area (Dugan et al. 2016). For our analyses, we varied each parameter individually by using all possible values in our dataset. For example, to examine the sensitivity of P re-generation to changes in C:P, we calculated the percent increase of all possible values on C:P from the mean of C:P for each lake. We then held Rhetero constant at the mean
Rhetero value and calculated P regeneration (equation 2) for
each variation of C:P across the range of values of that parameter within each lake. We ran sensitivity analyses
twice for each lake and for each year of Acton data because, as described previously, the percentage of ER composed of Rhetero and Rauto varies. Thus, we ran analyses
under 2 scenarios; where we assumed Rhetero was either 70
or 50% in Lacawac and Giles and either 30 or 10% in Acton. Note that these Rhetero scenarios are different from
running the sensitivity analysis with variable Rhetero. The
sensitivity analysis takes the range of Rhetero values in the
dataset, and this range varies depending on whether we set the percentage of Rhetero to ER high (70% in Lacawac and
Giles and 30% in Acton) or low (30% in Lacawac and Giles and 10% in Acton). All analyses were performed in R (R Development Core Team 2013).
Fig. 1. Summer trends in chlorophyll a, SRP, seston C:P, gross primary production (GPP, black circles and line), and ecosystem respiration (ER, gray circles and line) for the 3 study lakes. Each circle represents a weekly average. Note the different y-axis scales.
Results
In all 3 lakes over the well-stratified summer period, Chl-a and SRP concentrations were generally sustained or increased (Fig. 1). Chl-a was higher in Acton in 2012 than in 2011. Seston C:P was relatively constant within all lakes expect for one early date in Lacawac (Fig. 1). GPP and ER were low in Giles and Lacawac; Acton had much higher values, with the highest in 2012 (Fig. 1). Acton GPP and ER were similar to rates reported for this lake in 2008 (Solomon et al. 2013).
In the 2 natural lakes, P regeneration rates calculated from the metabolism and TP regression approaches were more similar in mesotrophic/dystrophic Lacawac than oli-gotrophic Giles (Table 2, Fig. 2). During summer, rates calculated by the 2 approaches followed the same temporal trends in Lacawac, but only toward late July did they begin to coincide in Giles (Fig. 2). For Giles, the TP regression predicted average summer P regeneration rates 2.7–3.9 times higher than the metabolism approach using
Rhetero 70 and 50%, respectively, whereas in Lacawac,
metabolism rates were similar to those from the TP regression using Rhetero 70% and 1.5 times higher using
Rhetero 50% (Table 2).
For the P budget approach in hypereutrophic Acton, we were able to examine the relative importance of P
re-generation versus the new fluxes of SRP from stream
loading, entrainment, and excretion and nutrient
transloca-tion by a sediment-feeding fish. In both years, stream SRP
loading was negligible by midsummer (Fig. 3 and 4).
Average summer entrainment represented a small flux of
SRP into the epilimnion (Fig. 4), but entrainment events provided pulses of SRP at high rates, particularly in 2012 (Fig. 3). In both years, SRP excretion by gizzard shad increased in magnitude and importance as the summer progressed (Fig. 3). Gizzard shad excretion represented
the second largest average summer flux of SRP, with
higher rates in 2012 than in 2011 (8.0 and 13.5 mg m−2 d−1,
respectively; Fig. 4). Average summer P regeneration was
the largest SRP flux in both summers, and rates were
higher in 2011 than in 2012 (Fig. 4). Temporally during summer, P regeneration often represented the largest SRP
flux, but at times entrainment and excretion by gizzard
shad were larger (Fig. 3). Phytoplankton P demand (calculated from 14C primary production and seston C:P)
was remarkably similar between years (36.7 and 36.3 mg m−2 d−1), and bacterial P demand was slightly higher in
2011 than in 2012 (Fig. 4).
Fig. 2. P regeneration as quantified by TP regression (Hudson et al. 1999), P budget (Acton only; Domine et al. 2010), and a metabolism-based
Fig. 4. Average summer fluxes of new SRP into Acton’s epilimnion (stream loading, gizzard shad excretion, and entrainment) and P regenera -tion as determined by P budgets for 2011 (upper numbers) and 2012 (lower numbers). The horizontal line represents the thermocline. Units of SRP are in mg m−2 d−1.
Fig. 3. Temporal trends in new fluxes of SRP into Acton’s epilimnion (stream loading, gizzard shad excretion, and entrainment) and P regener -ation as determined by P budgets for 2011 (left) and 2012 (right).
Method Giles P regeneration (mg m−2 d−1 of P) Lacawac P regeneration (mg m−2 d−1 of P) Acton (2011) P regeneration (mg m−2 d−1 of P) Acton (2012) P regeneration (mg m−2 d−1 of P) TP regression (as ssPO4-P) 4.3 (0.5) 6.1 (0.7) 40.9 (1.0) 36.7 (9.8)
P budget (as SRP) — — 34.0 (5.1) 25.4 (2.9)
Metabolism
Rhetero = 70%, 70%, 30% 1.6 (0.3) 5.8 (0.6) 73.7 (6.4) 123.2 (11.1)
Metabolism
Rhetero = 50%, 50%, 10% 1.1 (0.2) 4.1 (0.4) 24.4 (2.3) 41.1 (3.7)
Table 2. P regeneration as quantified by TP regression (Hudson et al. 1999), P budget (Acton only; Domine et al. 2010), and a
metabolism-based approach (Kamarainen et al. 2009) using 2 sets of values for Rhetero:ER, as described in methods. P regeneration units for ssPO4-P using
the TP regression approach are mg m−2 d−1 and for SRP using the metabolism and P budget approach are mg m−2 d−1. Values represent bias corrected mean (±1 standard error) summer values (June–mid-August).
In Acton, average summer P regeneration rates estimated from the 3 approaches were generally lowest using the P budget, with the exception of the metabolism method using 10% Rhetero (Table 2). Metabolism P
regener-ation rates estimated using 30% Rhetero and 10% Rhetero
differed greatly (Table 2). For example in 2012, P regen-eration was 123 mg m−2 d−1 assuming 30% R
hetero but was
41 mg m−2 d−1 when assuming 10% R
hetero. Compared to
the TP regression and P budget approaches, P regeneration from the metabolism method was more similar using 10%
Rhetero than 30% Rhetero (Table 2). Temporal P regeneration
rates also show that the TP regression and P budget approaches were similar, with exceptions in mid-July in 2011 and late July to early August 2012 (Fig. 2). Metabolism estimates, however, were higher than the other methods, a mismatch especially pronounced in 2012 (shown with 30% Rhetero; Fig. 2).
Phytoplankton P demand calculated by the metabolism method (70% Rauto for Acton and 30% Rauto
for Giles and Lacawac) was highest in Acton (max = 147 mg m−2 d−1) followed by Lacawac (max = 11.5 mg m−2 d−1)
and then Giles (max = 3.3 mg m−2 d−1). In Giles, P
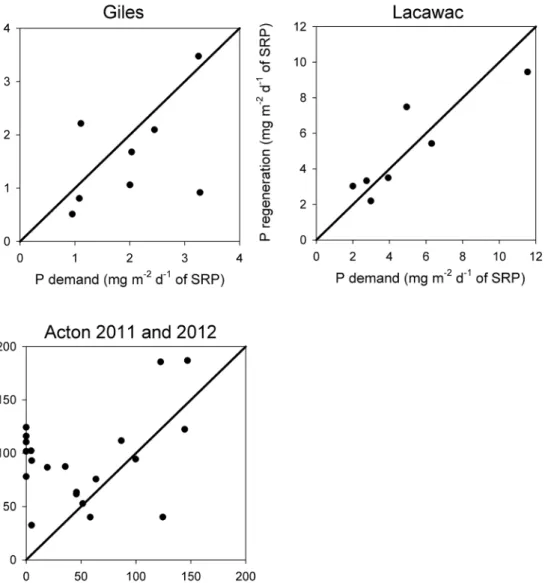
regen-eration was estimated to supply a large portion of the phytoplankton P demand (28–200%), and in 2 of the 8 weeks, regeneration was estimated to fully support P demand (Fig. 5; i.e., when points fall along and above the 1:1 line, indicating that P regeneration can support P demand). Estimated P regeneration rates were high enough to fully support P demand in 3 of the 7 weeks in Lacawac (Fig. 5) and over the summer represented 73–151% of P demand. For Acton, 5 of the 22 weeks (over both years) resulted in estimates of no P demand (Fig. 5) because, for these weeks, Rauto was greater than
NPP. Including the weeks for Acton with no demand, P
Fig. 5. P demand and P regeneration as estimated by the metabolism-based method. Values for Acton 2011 and 2012 are combined. The solid black line in each panel indicates the 1:1 line. Points that fall along and above the 1:1 line indicate that P regeneration can support P demand.
regeneration was estimated to fully support P demand in 13 of 22 weeks (Fig. 5) and over the summer represented a large range of P demand (0–2239%).
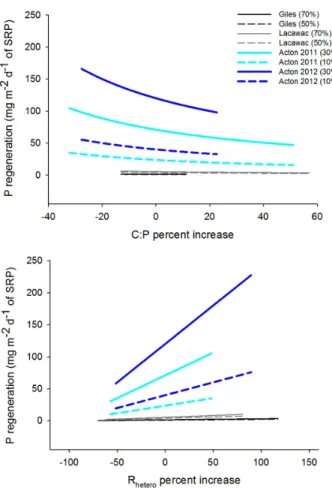
Our sensitivity analyses for the metabolism method
revealed several interesting results about the influence of
input parameters on estimated P regeneration rates. P re-generation versus the percent change in Rhetero displayed a
linear relationship, whereas P regeneration versus the percent change in C:P was nonlinear (Fig. 6). Slopes from P regeneration versus the percent change in Rhetero showed
highest values in Acton, followed by Lacawac and then Giles, suggesting that P regeneration rates in Acton are the most sensitive to changes in Rhetero and least sensitive in
Giles (Fig. 6, Table 3). P regeneration, as influenced by
variable C:P, also seems to be most sensitive in Acton. In general, changing the percentage of ER attributed to Rhetero
(Rhetero:ER) influences P regeneration more in Acton than
in either of the lower productivity Pennsylvania lakes. For example, the change in P regeneration rates was larger when considering Rhetero at 30% than at 10% Rhetero in
Acton, whereas changes to Rhetero:ER in Giles and Lacawac
had a smaller effect (Fig. 6, Table 3).
Discussion
P regeneration rates estimated from these methods show several important trends. When comparing within a lake, the TP regression and metabolism approaches produced similar P regeneration rates for the mesotrophic/dystrophic lake. In the hypereutrophic lake, metabolism-based rates were much higher or lower than either the TP regression or P budget rates, depending on percentage of ecosystem respiration attributed to Rhetero.
In addition, sensitivity analyses showed that Acton P regeneration rates estimated by the metabolism method were the most sensitive to changes in Rhetero.
Metabo-lism-based P regeneration rates in the oligotrophic lake were lower than with the TP regression approach. Sensitivity analyses showed that varying Rhetero in
oligo-Fig. 6. Sensitivity analysis of P regeneration when calculating the percent increase of all possible values on C:P (upper panel) or Rhetero
(lower panel) from the mean for each lake. We ran analyses for each lake twice because we assumed the percentage of ecosystem respiration attributed to Rhetero was either 70 or 50% in Lacawac and
Giles and either 30 or 10% in Acton. Steeper slopes indicate higher sensitivity and also reveal whether relationships are nonlinear (as in upper panel) or linear (as in lower panel). X-axis values indicate the range of variation for that parameter in each dataset.
Lake Slopes from P regeneration vs. percent change in Rhetero*
Slopes from P regeneration vs. percent change in Rhetero**
Giles 0.02 0.01
Lacawac 0.06 0.04
Acton 2011 0.71 0.24
Acton 2012 1.20 0.40
* Assumes Rhetero is 70% in Giles and Lacawac and 30% in Acton
** Assumes Rhetero is 50% in Giles and Lacawac and 10% in Acton
Table 3. Slopes as calculated from the sensitivity analysis of P regeneration when calculating the percent increase of all possible values Rhetero
from the mean for each lake. Analyses were run twice for each lake because we assumed the percentage of ecosystem respiration (ER) attributed to Rhetero was either 70 or 50% in Lacawac and Giles and either 30 or 10% in Acton. Steeper slopes indicate a greater sensitivity of P
trophic Lake Giles had a relatively small effect on estimated P regeneration rates. These results highlight the potential for sensitivity based on the model assumptions of this method, suggesting that determining a realistic estimate for the contribution of Rauto and Rhetero
to ER is important across productivity types and has the
potential to greatly influence the absolute values of
estimated P regeneration rates in a metabolically active system like hypereutrophic Acton. Interestingly, in a previous study on eutrophic Lake Mendota, the authors concluded that varying Rauto and Rhetero had a small
influence on P regeneration rates (Kamarainen et al.
2009). Our sensitivity analyses revealed that this only seems to be the case in the 2 lower productivity lakes. Although GPP and ER rates are not presented for Lake Mendota in Kamarainen et al. (2009), they are provided in another study, and these O2 rates did not exceed 9 mg L−1 d−1 for GPP and
5 mg L−1 d−1 for ER (Solomon et al. 2013). By comparison,
GPP and ER (as O2) in Acton were higher (up to 24 mg L−1 d−1
for GPP and 25 mg L−1 d−1 for ER), particularly so in 2012
when we documented a greater mismatch in P regenera-tion rates between the metabolism-based and other approaches. Seston C:P was relatively constant seasonally in Acton. Although work has been done to estimate Rauto and Rhetero in a variety of systems (del
Giorgio and Peters 1993, Biddanda et al. 2001), more work is needed to improve the conversion of GPP calculated from free-water DO measurements to NPP.
The efficacy of the metabolism approach is influenced by several other factors. In the present study,
we assumed that both the photosynthetic quotient (PQ) and respiratory quotient (RQ) were 1.0. This assumption is often made, but PQ has been shown to vary from 0.8 to 1.2 (del Giorgio and Peters 1993). In the Kamarainen
et al. (2009) study, varying PQ and RQ influenced the
magnitude of P demand and P regeneration but had a greater overall impact on the extent of P demand met by P regeneration. The metabolism method for estimating P regeneration also assumes that P is the limiting nutrient. This assumption is generally true for all 3 lakes; for Acton, nearly 10 years of data show that phytoplankton are usually P limited (Vanni et al. 2006a, Hayes et al. 2015), and both Lacawac and Giles phytoplankton are at times co-limited by P and N (L.B. Knoll, unpubl. data). Further, SRP concentrations in Acton are typically low and near detection limit except after storms, and P is in-corporated into phytoplankton quickly (Vanni et al. 2006a). The metabolism approach also assumes that bacteria are not net consumers of P. If, however, bacteria are net consumers of P in these lakes, then P regenera-tion rates using the metabolism method will be overesti-mated (Kamarainen et al. 2009). In the Lake Mendota study using the metabolism approach, the authors
support this bacteria assumption by illustrating how bacteria P uptake rates are likely near zero because Lake Mendota bacterial biomass in the summer is generally constant and because previous work suggested that bacteria are typically unable to store P (Cotner and Wetzel 1992, Kamarainen et al. 2009). Finally, the metabolism approach was developed using epilimnetic buoy and nutrient data. In lakes like Lacawac and Giles, with sub-epilimnetic peaks in phytoplankton biomass, using only epilimnetic oxygen data for the metabolism approach may misrepresent water column metabolism (Staehr et al. 2012, Obrador et al. 2014), and advances
in automated profiling buoys may help to alleviate these
issues and improve our ability to understand these systems with vertical heterogeneity (Brentrup et al. 2016).
P demand and P regeneration rates estimated from the metabolism method show that on a weekly basis, 0–2000% of P demand was supplied by regeneration; however, when considered for the entire summer, P re-generation did not meet all P demand requirements. We would not expect regeneration to fully support P demand
over the long-term because other fluxes are known to be
important in sustaining phytoplankton production (e.g., catchment inputs, entrainment). Data from the P budget in Acton highlight the relative importance of new sources of P in meeting P demands. Gizzard shad excretion
represented a significant source of SRP, particularly in late
summer. In the present study, P regeneration was 2.7–4.5 times greater than gizzard shad excretion, results similar to a previous Acton study (Domine et al. 2010). Note that SRP from gizzard shad excretion represents a new source of P, whereas regenerated P is recycled within the epilimnion. Thus, new sources of P are critical in sustaining phytoplankton production and also represent an increase in the P available to become part of the epilimnetic recycling P pool (Vanni 2002). In Acton,
entrainment also represented a significant pulse of SRP during the summer, a finding supported by other studies
(Auer et al. 1993, Soranno et al. 1997, Nowlin et al. 2005, Kamarainen et al. 2009). For Giles and Lacawac, we were unable to calculate P budgets, but we expect that entrainment may also represent an important new source of P, particularly in Lacawac. Historically, Giles has been well oxygenated throughout the water column in the summer, but in recent years the bottom waters have become anoxic in the summer with concomitant accumulation of P in the hypolimnion (L.B. Knoll, unpubli. data). Thus, entrainment in Giles is likely to support some P demand. In lakes like Lacawac and Giles, with sub-epilimnetic chlorophyll maxima, migrating zooplankton may also play a role in transport-ing nutrients to the epilimnion. These zooplankton feed
in deep chlorophyll maxima during the day and have the potential to transport SRP upward at night via excretion.
Preliminary data in Giles suggest that this flux can
supply ~3% of phytoplankton P demand during midsummer (T.H. Leach, unpubl. data). Without new SRP inputs, such as those by gizzard shad, entrainment, and migrating zooplankton, TP would decline in the epilimnion as phytoplankton die and become part of the sediment P pool (Baines and Pace 1994).
Our results show general agreement between the different methods used to estimate P regeneration in the 3 lakes of varying productivity, especially noteworthy considering the number of estimated parameters. However, our results also highlight the variability between the methods and the sensitivity of the metabolism approach to the relative contribution of Rauto
and Rhetero to ER in a hypereutrophic lake. We also show
that compared with the TP regression approach, the me-tabolism-based method underestimated P regeneration in the oligotrophic lake, was nearly equivalent in the mesotrophic/dystrophic lake, and overestimated P re-generation in the hypereutrophic lake. These results are intriguing given that the TP regression approach provides P regeneration as ssPO4-P rather than SRP, and
ssPO4-P concentrations are often orders of magnitude
lower than corresponding SRP concentrations (Hudson et al. 2000, Nowlin et al. 2007). Further, maximum TP values in the Hudson et al. (1999) regression were about
80 μg L−1, Acton’s mean summer TP concentrations in 2011 and 2012 were similar (77 μg L−1), and the
regression approach matches well with the P budget and metabolism approaches (when Rhetero is 10%).
Taken together, our results suggest that the metabolism approach may be easier to implement in oli-gotrophic to mesotrophic lakes (this study) and eutrophic lakes (e.g., Lake Mendota studied by Kamarainen et al. 2009) when using model assumptions based on current literature values. This method may be most sensitive to model assumptions in hypereutrophic lakes that are extremely biologically active; thus, more
research is needed to fine-tune these assumptions in
such systems. As high-frequency DO data become more common within GLEON and beyond, and as models for estimating GPP and ER improve along with technologi-cal advances in high-frequency measurements of other parameters like phosphorus concentrations, limnologists will be able continue efforts to understand lake
dynamics on a finer temporal scale.
Acknowledgements
We thank E. Mette, E. Overholt, R. Pilla, and T. Ratliff for
assistance in the field and lab. We thank Lacawac
Sanctuary Field Station for access to Lake Lacawac and their research facilities and Blooming Grove Hunting and
Fish Club for access to Lake Giles. This work benefited
from participation in the Global Lake Ecological Observatory Network (GLEON). We also thank 2 anonymous reviewers for their valuable comments. Funding for this research was partially supported by the National Science Foundation (DEB: 0743192) to M.J. Vanni.
References
Auer MT, Johnson NA, Penn MR, Effler SW. 1993. Measurement and verification of rates of sediment phosphorus release for a hypereu -trophic urban lake. Hydrobiologia. 253:301–309.
Baines SB, Pace ML. 1994. Relationships between suspended
particulate matter and sinking flux along a trophic gradient and impli -cations for the fate of planktonic primary production. Can J Fish Aquat Sci. 51:25–36.
Biddanda B, Ogdahl M, Cotner J. 2001. Dominance of bacterial metabolism in oligotrophic relative to eutrophic waters. Limnol Oceanogr. 46:730–739.
Brentrup JA, Williamson CE, Colom-Montero W, Eckert W, de Eyto E,
Grossart HP, Huot Y, Isles P, Knoll LB, Leach TH, et al. 2016. The potential of high-frequency profiling to assess vertical and seasonal
patterns of phytoplankton dynamics in lakes: an extension of the Plankton Ecology Group (PEG) model. Inland Waters. 6:565–580. Caraco NF, Cole JJ, Likens GE. 1992. New and recycled primary
production in an oligotrophic lake - insights for summer phosphorus dynamics. Limnol Oceanogr. 37:590–602.
Caston CB, Nowlin WH, Gaulke A, Vanni MJ. 2009. The relative importance of heterotrophic bacteria to pelagic ecosystem dynamics varies with reservoir trophic state. Limnol Oceanogr. 54:2143–2156. Cole JJ, Caraco NF. 1998. Atmospheric exchange of carbon dioxide in
a low-wind oligotrophic lake measured by the addition of SF6. Limnol Oceanogr. 43:647–656.
Cotner JB, Wetzel RG. 1992. Uptake of dissolved inorganic and organic phosphorus-compounds by phytoplankton and bacterioplankton. Limnol Oceanogr. 37:232–243.
del Giorgio PA, Peters RH. 1993. Balance between phytoplankton production and plankton respiration in lakes. Can J Fish Aquat Sci. 50:282–289.
Dickman EM, Vanni MJ, Horgan MJ. 2006. Interactive effects of light and nutrients on phytoplankton stoichiometry. Oecologia. 149:676– 689.
Dodds WK, Priscu JC, Ellis BK. 1991. Seasonal uptake and regenera-tion of inorganic nitrogen and phosphorus in a large oligotrophic lake - size-fractionation and antibiotic-treatment. J Plankton Res. 13:1339–1358.
Domine LM, Vanni MJ, Renwick WH. 2010. New and regenerated primary production in a productive reservoir ecosystem. Can J Fish Aquat Sci. 67:278–287.
Dugan HA, Woolway RI, Santosa AB, Corman JR, Jaimes A, Nodine ER, Patil VP, Zwart JA, Brentrup JA, Hetherington AL, et al. 2016.
Consequences of gas flux model choice on the interpretation of
metabolic balance across 15 lakes. Inland Waters.6:581–592. Elser JJ, Marzolf ER, Goldman CR. 1990. Phosphorus and nitrogen
limitation of phytoplankton growth in the fresh-waters of North America - a review and critique of experimental enrichments. Can J Fish Aquat Sci. 47:1468–1477.
Hayes NM, Vanni MJ, Horgan MJ, Renwick WH. 2015. Climate and land use interactively affect lake phytoplankton nutrient limitation status. Ecology. 96:392–402.
Higgins KA, Vanni MJ, Gonzalez MJ. 2006. Detritivory and the
stoi-chiometry of nutrient cycling by a dominant fish species in lakes of
varying productivity. Oikos. 114:419–430.
Hudson JJ, Taylor WD. 1996. Measuring regeneration of dissolved phosphorous in planktonic communities. Limnol Oceanogr. 41:1560–1565.
Hudson JJ, Taylor WD, Schindler DW. 1999. Planktonic nutrient
regen-eration and cycling efficiency in temperate lakes. Nature. 400:659–
661.
Hudson JJ, Taylor WD, Schindler DW. 2000. Phosphate concentration in lakes. Nature. 406:54–56.
Jennings E, Jones SE, Arvola L, Staehr PA, Gaiser E, Jones ID,
Weathers KC, Weyhenmeyer GA, Chiu C-Y, De Eyto E. 2012.
Effects of weather-related episodic events in lakes: an analysis based on high-frequency data. Freshwater Biol. 57:589–601.
Juday C, Birge EA, Kemmerer GI, Robinson RJ. 1927. Phosphorus content of lake waters of northeastern Wisconsin. T Wisc Acad Sci Arts Lett. 23:233–248.
Kamarainen AM, Penczykowski RM, Van de Bogert MC, Hanson PC, Carpenter SR. 2009. Phosphorus sources and demand during summer in a eutrophic lake. Aquat Sci. 71:214–227.
Klug JL, Richardson DC, Ewing HA, Hargreaves BR, Samal NR,
Vachon D, Pierson DC, Lindsey AM, O’Donnell DM, Effler SW, et
al. 2012. Ecosystem effects of a tropical cyclone on a network of lakes in northeastern North America. Environ Sci Technol. 46:11693–11701.
Knoll LB, Vanni MJ, Renwick WH. 2003. Phytoplankton primary production and photosynthetic parameters in reservoirs along a gradient of watershed land use. Limnol Oceanogr. 48:608–617. Knoll LB, Vanni MJ, Renwick WH, Dittman EK, Gephart JA. 2013.
Temperate reservoirs are large carbon sinks and small CO2 sources: results from high-resolution carbon budgets. Glob Biogeochem Cy. 27:52–64.
Kunsch HR. 1989. The jackknife and the bootstrap for general stationary observations. Ann Stat. 17:1217–1241.
Loucks DP, van Beek E. 2005. Model sensitivity and uncertainty analysis. In: Water resources systems planning and management: an introduction to methods, models and applications. Paris (France): UNESCO. p. 255–290.
Melack JM. 1978. Morphometric, physical and chemical features of the volcanic crater lakes of western Uganda. Arch Hydrobiol. 84:430–453.
Nowlin WH, Davies JM, Mazumder A. 2007. Planktonic phosphorus
pool sizes and cycling efficiency in coastal and interior British
Columbia lakes. Freshwater Biol. 52:860–877.
Nowlin WH, Evarts JL, Vanni MJ. 2005. Release rates and potential fates of nitrogen and phosphorus from sediments in a eutrophic reservoir. Freshwater Biol. 50:301–322.
Obrador B, Staehr PA, Christensen JPC. 2014. Vertical patterns of
metabolism in three contrasting stratified lakes. Limnol Oceanogr.
4:1228–1240.
R Development Core Team. 2013. R: a language and environment for statistical computing. Vienna (Austria): R Foundation for Statistical Computing.
Read JS, Hamilton DP, Desai AR, Rose KC, MacIntyre S, Lenters JD, Smyth RL, Hanson PC, Cole JJ, Staehr PA, et al. 2012. Lake-size dependency of wind shear and convection as controls on gas exchange. Geophys Res Lett. 39.
Renwick WH, Vanni MJ, Zhang Q, Patton J. 2008. Water quality trends and changing agricultural practices in a Midwest US watershed, 1994–2006. J Environ Qual. 37:1862–1874.
Schindler DW. 1977. Evolution of phosphorus limitation in lakes. Science. 195:260–262.
Smith VH. 1979. Nutrient dependence of primary productivity in lakes. Limnol Oceanogr. 24:1051–1064.
Solomon CT, Bruesewitz DA, Richardson DC, Rose KC, Van de Bogert MC, Hanson PC, Kratz TK, Larget B, Adrian R, Babin BL, et al. 2013. Ecosystem respiration: drivers of daily variability and background respiration in lakes around the globe. Limnol Oceanogr. 58:849–866.
Soranno PA, Carpenter SR, Lathrop RC. 1997. Internal phosphorus loading in Lake Mendota: response to external loads and weather. Can J Fish Aquat Sci. 54:1883–1893.
Staehr PA, Christensen JPA, Batt RD, Read JS. 2012. Ecosystem
metabolism in a stratified lake. Limonl Oceanogr. 57:1317–1330.
Staehr PA, Sand-Jensen K. 2007. Temporal dynamics and regulation of lake metabolism. Limnol Oceangr. 52:108–120.
Sterner RW, Chrzanowski TH, Elser JJ, George NB. 1995. Sources of nitrogen and phosphorus supporting the growth of bacterioplankton and phytoplankton in an oligotrophic Canadian shield lake. Limnol Oceanogr. 40:242–249.
Sterner RW, Elser JJ. 2002. Ecological stoichiometry: the biology of elements from molecules to the biosphere. Princeton (NJ): Princeton University Press.
Vanni MJ. 2002. Nutrient cycling by animals in freshwater ecosystems. Annu Rev Ecol Syst. 33:341–370.
Vanni MJ, Andrews RS, Renwick WH, Gonzalez MJ, Noble SE. 2006a. Nutrient and light limitation of reservoir phytoplankton in relation to storm-mediated pulses in stream discharge. Arch Hydrobiol. 167:421–445.
Vanni MJ, Bowling AM, Dickman EM, Hale RS, Higgins KA, Horgan MJ, Knoll LB, Renwick WH, Stein RA. 2006b. Nutrient cycling by
fish supports relatively more primary production as lake productivity
increases. Ecology. 87:1696–1709.
Vanni MJ, Renwick WH, Headworth JL, Auch JD, Schaus MH. 2001.
Dissolved and particulate nutrient flux from three adjacent agricul
-tural watersheds: a five-year study. Biogeochemistry. 54:85–114.
Weathers KC, Hanson PC, Arzberger P, Brentrup J, Brooks J, Carey CC, Gaiser E, Hamilton DP, Hong GS, Ibelings B, et al. 2013. The Global Lake Ecological Observatory Network (GLEON): the evolution of grassroots network science. Limnol Oceanogr Bull. 22:71–73.
Williamson CE, Brentrup JA, Zhang J, Renwick WH, Hargreaves BR, Knoll LB, Overholt EP, Rose KC. 2014. Lakes as sensors in the landscape: optical metrics as scalable sentinel responses to climate change. Limnol Oceanogr. 59:840–850.
Winslow LA, Zwart JA, Batt RD, Dugan HA, Woolway RI, Corman JR, Hanson PC, Read JS. 2016. LakeMetabolizer: an R package for estimating lake metabolism from free-water oxygen using diverse statistical models. Inland Waters. 6:622–636
Winslow L, Zwart J, Batt R, Corman J, Dugan H, Hanson P, Holtgrieve G, Jaimes A, Read J, Woolway R. 2015. LakeMetabolizer. R package version 1.1 https://CRAN.R-project.org/package=LakeMetabolizer.