Evidence for profit-shifting with
tax sensitive capital stocks
Simon loretz and Socrates Mokkas
Oxford University Centre for Business Taxation Saïd Business School, Park End Street, Oxford, Ox1 1HP
Evidence for prot shifting
with tax sensitive capital stocks
Simon Loretz∗ and Socrates Mokkas† November 6, 2011
Abstract
This paper contributes to the literature providing indirect evidence for prot shifting within multinational companies. In contrast to the previous studies we account for the tax responsiveness of the capital stock and analyse the impact of corporate taxes on both pre- and post-tax protability. Evidence from our large panel dataset of European subsidiaries supports the prot shifting hypothesis. We nd that a 10 percentage point decrease in the tax rate increases post-tax protability by up to 1.1 percentage points. Further, our results suggest that nancial prots and losses are particularly responsive to taxes, which indicates that a large part of prot shifting takes places via debt shifting.
JEL classication: H25, H87
Keywords: Corporate Taxation; Prot Shifting;
∗University of Bayreuth and Oxford University Centre for Business Taxation; Universitätsstr.
30, 95447 Bayreuth Germany, e-mail: simon.loretz@uni-bayreuth.de
†Oce of the Gas and Electricity Markets (OFGEM) and Oxford University Centre for Business
1 Introduction
Policy makers have been concerned about dierences in corporate tax rates world-wide for some time, because these dierences create incentives for multinational companies to move real activity to countries with lower taxes. Furthermore, even if multinationals do not move real capital in response to tax dierentials, they may shift income to low-tax countries, by manipulating the geographical distribution of their taxable prots. Multinational groups can shift income among aliates resi-dent in dierent countries in two main ways, namely through transfer pricing, i.e. strategic mispricing of internal transactions, and through debt shifting, i.e. nancial transactions between aliated subsidiaries. Although policy makers are targeting such strategies by setting limits to intra-rm borrowing and lending and by apply-ing the arm's length principle in intra-group trade, there is widespread belief that multinationals succeed in transferring prots via tax planning.
Prot shifting activities by multinational companies have been in the focus of a growing empirical literature. For example Huizinga and Laeven (2008) and We-ichenrieder (2009) investigate the eects of corporate taxes on prot levels. While this provides indirect evidence for prot shifting, the prots level might at the same time be aected by tax-induced relocation of capital. Therefore we extend the work of Grubert and Mutti (1991) and model the eects of taxes on protability, dened as the ratio of prots over assets. However, in order to derive empirically testable predictions about protability one should look at capital movements as well as at prot movements. In our model we show that in the absence of prot shifting pre-tax protability should be positively associated with corporate tax rates, whereas post-tax protability should be equalised across countries. If, on the other hand, prot shifting is important, then post-tax protability will be unambiguously negatively associated with the tax rate.
We use a large sample consisting of 253,106 observations on 39,110 rms from 2002-2009 from the Amadeus dataset to test our theoretical predictions. Our results favour the prot shifting hypothesis over the non-prot shifting hypothesis. The rm xed eects estimates show that a 10 percentage point increase in the tax rate decreases post-tax protability between 0.6 and 1.1 percentage points depending on the measure of prot used. Prot measures including nancial prots and losses, most notably interest deductions are more responsive to tax rate changes, which indicates that prot shifting is to a large extent done via debt shifting. This nding is strengthened by the large inuence of debt on reported protability.
The remainder of the paper is structured as follows. Section 2 provides a short review of related literature. Section 3 develops a stylized theoretical model to moti-vate the empirical estimation. Section 4 describes the data, and Section 5 presents and discusses the results and some robustness analysis. Section 6 concludes.
2 Related Literature
Empirical prot shifting literature can be broadly distinguished into studies provid-ing direct and indirect evidence. Direct evidence in this context refers to the fact that a specic channel of prot shifting, i.e. debt shifting or transfer pricing, is
analyzed. In contrast, indirect evidence describes the approach where the outcome of prot shifting, i.e. tax induced dierences in prots, is interpreted as evidence for the existence of prot shifting. Whereas studies providing direct evidence can shed more light on the dierent channels of prot shifting and rule out some alterna-tive explanations, these studies typically demand more detailed data on intra-group transactions.1 More importantly, direct evidence for prot shifting by its nature
analyses only particular aspects of prot shifting, and therefore can never capture the full impact of taxation on prot shifting activities. We therefore follow the strand of literature providing indirect evidence for prot shifting.2
The earliest study directly related to our approach is Grubert and Mutti (1991). They use country level aggregate data for foreign aliates of US parents and nd strong evidence of a negative relationship between the statutory corporate tax rate and post-tax protability. Similarly Hines and Rice (1994) use country-level aggre-gate data of US non-bank aliates for a larger set of host countries including tax havens. Analysing the prot levels in the host countries a one percentage point higher host country tax rate is associated with a reduction of reported prots by 3 percent. In a more recent paper, Bartelsman and Beetsma (2003) suggest that prot-shifting activity is also signicant within the OECD countries. Using industry level aggregate data they disentangle the eects of prot shifting from changes in productivity and real economic activity.
More recent contributions make increasingly use of rm level data. Two early studies are motivated by the observation of near zero protability of foreign-controlled US domestic corporations. Collins et. al. (1997) use data from the wholesale sector but fail to nd a signicant dierence in protability between domestically and for-eign owned companies. Grubert (1997) nds a signicant dierence in protability, however, the eect vanishes over time and can not be attributed to prot shifting. In contrast Mintz and Smart (2004) nd evidence for prot shifting using Canadian data. The identication strategy of Mintz and Smart (2004) is to compare the tax elasticity of rms which choose not to consolidate their accounts with rms electing formula apportionment. One common feature of these papers is that they treat dif-ferences in protability between domestic and multinational companies as evidence for prot shifting. However, this approach can be compromised by the fact that more productive rms are more likely to become multinationals. See Mani and Mokkas (2011) for an empirical analysis of measured protabilities in domestic and multinational companies.
A number of recent papers overcomes this problem with international datasets, which allows them to use the cross-country variation in the tax rates to identify prot shifting. Huizinga and Laeven (2008) for example use the Amadeus database to nd the prot levels of multinational subsidiaries negatively aected by a weighted tax dierential. Weichenrieder (2009) uses condential data on German inbound and 1While there is an increasingly large number of international studies on debt shifting, the lit-erature providing direct evidence for transfer pricing is typically based on condential US data. Examples include Swenson (2001) using US Department of Census trade data, Clausing (2003) using Bureau of Labour Statistics data and Bernard et al. (2006) using the Linked/Longitudinal Firm Trade Transactions Database.
2For a comprehensive survey of the other strands of empirical prot shifting literature see Dev-ereux (2007).
outbound FDI to nd a signicant eect of host country tax rates on after tax prof-itability. However, due to data restrictions he can not analyse pre-tax protability. Finally, Dischinger (2010) is also related to our approach investigating the impact of tax dierentials between parent and subsidiaries on the pre-tax protability in the subsidiary. Scaling protability by the number of employees he nds evidence for prot shifting.
Interestingly, Dischinger (2010) also argues in line with our paper stating '[...] tax rate eects on pre-tax prots might not be conned solely to prot shifting ac-tivities, as the incentive to invest in a given country also decreases with the corporate tax rate' (p. 4). Given the widespread and conclusive empirical evidence that rms investment decisions are aected by corporate taxation, we think that it is important to incorporate the impact of the investment decision into the analysis of prot shift-ing.3 Therefore the next section introduces a stylized model which allows us to derive
predictions about the impact of tax rates on both pre- and post-tax protability.
3 Theoretical Background
This section presents a stylized model of a multinational enterprise (MNE) to moti-vate the subsequent empirical analysis. The algebra and proofs of the equations are included in the appendix.4
Consider a MNE consisting of two entities 1,2, which operate in two dierent countries 1,2. Without loss of generality we assume that the statutory tax rate in country1is higher than in country2, i.e. τ1 > τ2. Denote the prot functions of the
two subsidiaries as F1, F2, which are a function of capital K1, K2 respectively and
are assumed to be homogeneous of degreea.5 Further the MNE can transfer a part
of its protsS < F1 from subsidiary1to subsidiary 2. However, this prot shifting
activity comes at a cost of:
C= b 2 S F1 2 F1 (1)
Although the real costs of prot shifting are not known, we follow the literature (Hines and Rice (1994), Huizinga and Laeven (2008)) in approximating the prot shifting cost by a convex function ofSso that additional prot shifting becomes more
costly. Further, the costs depend only onF1 for simplicity. An intuitive explanation
for this can be, that the MNE needs to defend the level of prots in particular in the high tax country. More generally, costs of prot shifting may be resource costs, such as hiring tax and transfer price experts to allocate eciently accounting prots, or they can represent costs that the rm pays only if they are caught by the tax authorities. A consequence of this functional form is that the bigger the operation of an MNE in country 1, the cheaper it is to shift a given level of prots between the 3See De Mooij and Ederveen (2008 and 2003) for a comprehensive overview of the empirical literature.
4The theoretical model in this paper, and the general idea of this paper, builds on Chapter 3 from Mokkas (2009).
5If a function F(K) is homogeneous of degree a, then ∂F(K)
∂K K = aF(K). In addition, it is
assumed thata <1, otherwise the model does not have a solution for optimal levels of capital in
two subsidiaries; and that the higher the level of prots already shifted, the more costly it is to shift the next unit of prots.
The MNE maximises its overall post-tax prots with respect to the capital stock
K1,K2 and prot shifting S:
max K1,K2,S Π = (1−τ1) (F1−S) + (1−τ2) (F2+S)−r(K1+K2)− b 2 S2 F1 (2)
whereris the cost of capital which is determined on the world market and
there-fore equal in both locations. The rst two terms are the after tax prots made in each location after prot shifting. The third term represents the opportunity cost of capital. Finally, the fourth term catches the prot shifting costs. Note that we assume that the prot shifting costs are not deductible from the tax base of any of the subsidiaries.6
The rst order conditions yield:
∂Π ∂K1 ! = 0⇒F1K = r 1−τ1+2b S F1 2 (3) ∂Π ∂K2 ! = 0⇒F2K = r 1−τ2 (4) ∂Π ∂S ! = 0⇒S= τ1−τ2 b F1 (5)
Equation (5) combined with the restriction for an internal solution (S < F1)
dictates that b > τ1−τ2. Inspection of the rst order condition for prot shifting
shows that prots are shifted from the high tax country to the low tax country. In addition, the level of prots shifted is proportional to the true pre-tax prots of the subsidiary where prots are shifted out of, which is a direct consequence of the specic functional form chosen for the costs of prot shifting. With regard to the rst order conditions for capital, the marginal product of capital in country 1 is decreasing in the ratio of prots shifted and increasing in b. Hence, in the specic model, the
MNE invests more capital in the high tax country relative to the non prot shifting case, because by shifting prots to a lower tax country the MNE reduces the eective tax rate faced in the high tax country. In contrast, the rst order condition for the low tax country does not include the capital stock, because we assume that prot shifting costs do not depend onF2.
3.1 Empirical Predictions
Marginal products of capital, FiK, and prot shifting levels, S, usually can not be
observed. Rather, we observe total reported prots, F1−S andF2+S, and average
protability, π1 = F1K−1S and π2 = FK2+2S. This section describes the relative level of
average protability of the two subsidiaries and how changes in the tax rates aect pre- and post-tax protability.
6This assumption is more plausible if one interprets prot shifting as an illegal activity and the costs involved the potential nes if caught. Alternatively the prot shifting costs might simply be borne by parent companies and are thus not included at the subsidiary level.
No prot shifting
In order to derive the alternative hypothesis of the absence of prot shifting we rst consider the case where prot shifting is not possible (b → ∞, S → 0). This implies that (3) and (4) simplify to:
F1K = r 1−τ1 , F2K = r 1−τ2 (6)
Given that F1, F2 are assumed to be homogenous of degree athen (6) yields:
Average pre-tax protability: π1 =
r a(1−τ1)
, π2 =
r a(1−τ2)
Average post-tax protability: (1−τ1)π1 =
r
a,(1−τ2)π2 = r
a (7)
Hence, pre-tax protability must be higher in the high tax country1to to achieve the equalisation of post-tax protabilities. To show the eects of a change in the tax rates on the average protabilities we partially dierentiate (6) with respect to the tax rates.
Average pre-tax Protability Firm 1: ∂π1
∂τ1 = r a(1−τ1)2 ,∂π1 ∂τ2 = 0 Average pre-tax Protability Firm 2: ∂π2
∂τ1
= 0,∂π2 ∂τ2
= r
a(1−τ2)2
Average post-tax Protability Firm 1: ∂[(1−τ1)π1]
∂τ1
= ∂[(1−τ1)π1]
∂τ2
= 0 Average post-tax Protability Firm 2: ∂[(1−τ2)π2]
∂τ1
= ∂[(1−τ2)π2]
∂τ2
= 0 (8) The derivatives in (8) highlight two direct eects of taxes on protabilities. First the pre-tax protabilities react positively to a tax rate change in the own country, because a higher tax rate reduces the capital stock and therefore increases the prof-itability. The second direct eect is the direct reduction of the post-tax protability due to the higher tax rate. Under the non prot shifting hypothesis, this second eect exactly compensates for the increased pre-tax protability to ensure the equalisation of after tax rate of return. In consequence, the level of average post-tax protabil-ity is equalised (see equation 7) across subsidiaries resident in dierent countries no matter the tax rate. Intuitively, if entrepreneurs eliminate any dierences in post-tax protability, pre-tax protability needs to compensate for the tax disadvantage of a high tax location.
Prot shifting
Under the alternative hypothesis of prot shifting, we can use the assumption of homogeneity of degree ato show that the reported average pre-tax protabilities
are: π1 = 1 aF1K− S K1 (9)
π2 =
1
aF2K+ S
K2 (10)
While it is not possible to draw any general predictions about the relative level of reported average pre-tax protability, it can be shown that pre-tax protability will be higher in the low tax country under the following condition
π2 > π1⇔ τ1−τ2 2b + 1 b(1−τ2) K1 K2 + 1 >1 (11) Inequality (11) is a function of the relative capital stock K1
K2, the tax rates and
prot shifting cost parameter b. And, if prot shifting is not too costly (b −→
(τ1−τ2)),7 then reported pre-tax protability will be higher in the low tax country.
With regard to average reported post-tax protability it is straightforward to show that8:
(1−τ2)π2>(1−τ1)π1 (12)
Therefore, if multinationals engage in prot shifting, subsidiaries in low tax coun-tries should report higher average post-tax protability than subsidiaries resident in countries with higher tax rates.
Eects on protabilities in subsidiary 1
To illustrate the eects of a tax rate change on the average pre-tax protability of subsidiary 1 we dierentiate (9) with respect to the two tax rates. Some rearranging yields ∂π1 ∂τ1 = 2r h 2b(b−1−τ1+ 2τ2) + (τ1−τ2)2 i a h 2b(1−τ1) + (τ1−τ2)2 i2 (13) ∂π1 ∂τ2 = 2r h 2b(1−τ2)−(τ1−τ2)2 i a h 2b(1−τ1) + (τ1−τ2)2 i2 (14)
Unfortunately, one cannot make unambiguous predictions about the sign of (13). This is due to the fact, that additionally to the direct eect of increased protabil-ity due to the reduction in the capital invested in this subsidiary, there are now two counteracting eects. First, the capital reduction is mitigated by the fact that higher prots in subsidiary 1 are not fully subject to the higher tax rate and additionally the cost of prot shifting will be cheaper the higher the level of prot. Therefore the level of capital invested in subsidiary 1 will be higher under the prot shifting hypothesis, compared to the case without prot shifting. More directly, an increase of the tax rate in country 1 will induce more prot shifting and thereby reduces the protability in subsidiary 1. The smaller the cost parameter of prot shifting,b, the
7Equation (5) combined with the restriction for an internal solution (S < F
1) dictates that
b > τ1−τ2.
stronger the latter eect. Hence, if prot shifting is not too costly, i.e. b→(τ1−τ2),
(13) will be unambiguously negative.
The increase of the tax rate in the low tax country has more clear cut eects. First, the incentive to shift prots out of the high tax country decreases. In addi-tion, the reduction in the prot shifting capability increases the eective tax rate of the subsidiary in location 1 and thus, reduces the capital size. Both of these eects increase pre-tax protability, which is evident in equation (14). Taking into account that b > τ1−τ2 and (1−τ2) >(τ1−τ2), it is immediate that the numerator, and
therefore the whole term, is positive.
The eects of the tax changes on the average reported after-tax protability, are similar, as it can be shown that:
∂[(1−τ1)π1] ∂τ1 =− 2r h 2b(1−τ1) (1−τ2)−(1−τ2−b) (τ1−τ2)2 i a h 2b(1−τ1) + (τ1−τ2)2 i2 (15) ∂[(1−τ1)π1] ∂τ2 = 2r(1−τ1) h 2b(1−τ2)−(τ1−τ2)2 i ah2b(1−τ1) + (τ1−τ2)2 i2 (16)
In addition to the above described eects there is the direct negative eect of the tax rate change on the after tax protability. Therefore, given that b > τ1−τ2, (15)
is unambiguously negative. Hence, an increase in the tax rate of country1decreases average reported post-tax protability of subsidiary 1.
The eect of a tax change in the low tax country on the post-tax protability in country 1 is in line with the eect on the pre-tax prot. In fact, the derivative in (16) is just scaled down by the factor(1−τ1)and therefore unambiguously positive
like (14). This is due to the fact the increased prot shifting incentives apply to the pre-tax prots in subsidiary 1. Consequently they are equally applicable to the post tax prots, only reduced because of the higher tax rate in country 1. Thus, the average reported after-tax protability of subsidiary 1 is positively aected by an increase in the tax rate of country 2.
Eects on protability in subsidiary 2
The protability of the subsidiary in country 2 depends on the capital stock there, the prots shifted into the country and consequently also on the capital stock in country 1 which determines the cost of prot shifting. Hence, in order to make progress with respect to the comparative statics of the reported protability of sub-sidiary2one needs to to solve for the capital in both countriesK1, K2and substitute
into (10). We assume prot functions are of the functional form Fi =AiKia, where
Ai is the total factor productivity of the subsidiary.9 Dierentiation of (10) with
9Using (3), (4) and (5) one can solve for the relative capital stock
K1 K2 = A1 A2 1/1−a" 1−τ1+(τ1−τ2) 2 2b 1−τ2 #1/1−a
respect to τ1 then yields: ∂π2 ∂τ1 = r ab(1−τ2) 1 1−a A1 A2 1−a1 " 1−τ1+ (τ1−τ2)2 2b #1−aa 1 +a(τ1−τ2) 1−a 2(τ1−τ2−b) 2b(1−τ1) + (τ1−τ2)2 (17) The most intuitive eect of a tax rate change in country1 on the protability in subsidiary 2 is via prot shifting. A higher tax rate in the high tax country ceteris paribus leads to more prot shifted to the subsidiary in the low tax country and therefore increases protability there. However, at the same time the increased tax in country 1 will reduce the capital stock invested and therefore decreases the total amount of prot and consequently the prot which will be shifted to the low tax subsidiary. The latter eect will be mitigated because the costs of prot depend on the prots made in subsidiary 1which will increase the capital stock relative to the no prot shifting case. The overall eect of a tax rate in country 1 on the pre-tax protability of subsidiary2will be positive if prot shifting is not very expensive, as can be seen in equations (17), which will be unambiguously positive ifb−→(τ1−τ2).
Given that the unambiguous sign for the eect of a tax rate change for pre-tax protability, the eect of a tax rate change in country1 on the post-tax protability in country2will be equally unambiguously positive. This is evident from (18) which is identical to (17) but scaled down with(1−τ2).
∂[(1−τ2)π2] ∂τ1 = r ab(1−τ2) a 1−a A1 A2 1 1−a " 1−τ1+ (τ1−τ2)2 2b #1−aa 1 +a(τ1−τ2) 1−a 2(τ1−τ2−b) 2b(1−τ1) + (τ1−τ2)2 (18) The eect of a tax rate change in country 2 on the pre-tax protability of sub-sidiary 2 is ambiguous. On the one hand there is the direct positive eect via the reduced capital, while at the same time reduced prot shifting lower protability in the subsidiary. The latter eect will be reinforced because of less capital invested in country 1 because, the eective tax burden increases. A dierent explanation for the same eect is that the incentive to lower costs for prot shifting is reduced. Con-sequently the eect of a tax rate change in country 2 will directly increase pre-tax protability in subsidiary2which is captured in the rst term in (19) and indirectly reduce protability which is captured in the second term.
∂π2 ∂τ2 = r a(1−τ2)2 − r ab(1−τ2) A1 A2 1−a1 "1−τ 1+ (τ1 −τ2)2 2b 1−τ2 #1−aa 1 + 1 1−a 2a(τ1−τ2)2 2b(1−τ1) + (τ1−τ2)2 −τ1−τ2 1−τ2 (19) In contrast, the ambiguity disappears in the eect of a tax rate change in country two on the reported post-tax protability of subsidiary2. This is due to the fact that
the reduction in capital and the resulting increase in pre-tax protability exactly compensates for the higher tax burden. This eect is the one described in non prot shifting case above. Hence we are left with the eects an increase inτ2 has on prot
shifting. There is the direct eect of reduced prot shifting, because of the smaller tax dierential and the indirect eect of less capital in subsidiary 1. Both reduce the level of prots in subsidiary2. At the same time, because of the reduced capital in subsidiary 2, the denominator also decreases which could increase the overall protability. However, equation (20) shows that the negative eect of the reduced prot shifting dominates, since the last term in the brackets can be never larger than -1 for τ1 <1. ∂[(1−τ2)π2] ∂τ2 = −r ab A1 A2 1/1−a"1−τ 1+(τ1−τ2) 2 2b 1−τ2 # a 1−a 1 + a 1−a 2 (b−τ1+τ2) (τ1−τ2) 2b(1−τ1) + (τ1−τ2)2 −τ1−τ2 1−τ2 (20) To sum up, if prot shifting is possible, then a reduction in the host country tax rate will bring an ambiguous change to average reported pre-tax protability, although the model suggests that if prot shifting is not very costly it will reduce pre-tax protability. On the other hand, a reduction in the host country tax rate will unambiguously increase average reported post-tax protability.
The predictions of the model are summarized in Table 1. In the empirical analysis, we will be focusing on the eects of the tax rate on reported pre- and post-tax protability, which are the shaded areas in the Table 1. We restrict our analysis on these direct eects of tax rates on protabilities of subsidiaries located there, because the data does not necessarily cover all subsidiaries of multinational groups. In consequence we do not have reliable information on the distribution of the tax rates in other countries where the group has aliates.
Table 1: Comparative Statics of Average Protabilities
No Prot Shifting Prot Shifting Tax Rateτ1 Tax Rateτ2 Tax Rateτ1 Tax Rateτ2
Pre-tax average
protability of positive independent ambiguous (-) positive Subsidiary 1
Pre-tax average
protability of independent positive ambiguous (+) ambiguous Subsidiary 2
Post-tax average
protability of independent independent negative positive Subsidiary 1
Post-tax average
protability of independent independent ambiguous (+) negative Subsidiary 2
Signs in parentheses hold if prot shifting is not a costly option for multinationals. The stylized model presented in this section highlights that, if one is to test
empirically the eect of the tax rate on average protability, then both the numerator (prots) and the denominator (assets) should be taken into account. If the tax rate increases then prots decrease due to prot shifting and because less capital is located there. However, because capital decreases, due to the marginal conditions, pre-tax protability may increase or decrease. The predictions for post-tax protability are unambiguous, hence a negative coecient can be interpreted as evidence for prot shifting. If in addition, pre-tax protability is negatively aected by the tax rate, then this is a signal of prot shifting being relatively cheap, and strictly inconsistent with the alternative predictions of this model in the absence of prot shifting.
4 Data Description
The data on subsidiaries of multinational companies are taken from the Amadeus database provided by Bureau van Dijk (BvD). Since Bureau van Dijk database has been used extensively in this strand of research, for example in Huizinga and Laeven (2008) and Dischinger (2010) we do not present the data in detail, but rather high-light where we use the data dierently.10
We start with a download of the large and very large companies from the online version of Amadeus dataset. The use of the online version allows us to use more recent data, with ownership information updated up to February 2011 and full data coverage up to the end of 2009. At the time of the download the Amadeus sample of large and very large companies included 540,832 companies in 44 European countries. We then identify the group structures using information about immediate shareholder with more than 50 percent ownership and the reported global ultimate shareholders. Table 2 splits the downloaded sample into dierent categories according to the group structure. The rst column lists the total number of rms in each country of our nal sample and sums the number of rms in other European countries.11 The next three
columns show the number of rms we exclude for the purpose of this study. First there are standalone companies, i.e. rms which report neither a corporate subsidiary nor a majority corporate shareholder. Further we exclude parent companies, because for most of them we only have the consolidated accounts. Further even if we have the unconsolidated accounts parent companies very often perform mostly holding activities, which might imply very dierent prot shifting possibilities. We also exclude subsidiaries in domestic groups because they do not have the prot shifting opportunities we want to investigate in this empirical analysis.
10A detailled description of the construction of the sample is available from the authors upon request.
11For some important countries, e.g. Switzerland, Norway or Ireland, we end up with insucient rms to include them in our regressions. This is due to missing information in key variables like tax payments and/or prots.
Table 2: Geographical Distribu tion of Firms/Observ ati on s T otal Subsidiaries Subsidiaries Final Sample Coun try Do wnlo ad Standalones P aren ts in domestic groups in MN E groups Fi rms Observ ations Belgium 16,387 6,751 943 3,416 5,277 2,679 18,760 Bulgaria 3,041 1,504 101 901 535 34 2 2,067 Croatia 1,927 939 95 337 556 384 2,846 Czec h Republic 10,469 6,831 238 677 2,723 1,001 6,759 Denmark 7,159 2,572 824 1,798 1,965 887 3,869 Estonia 1,765 313 38 539 875 368 2,640 Finland 7,367 1,867 804 2,298 2,398 513 2,673 France 71,535 12,804 3,714 32,537 22,480 6,281 42,487 German y 55,616 18,999 2,925 18, 073 15,619 2,215 10,991 Greece 3, 855 2,032 289 603 931 531 3,871 Hungary 3,9 72 3,161 22 49 740 109 320 Italy 54,365 26,917 4,056 15,962 7,430 3,431 24,212 Latvia 1,635 789 50 235 561 144 958 Lith uania 2,132 1,042 81 380 629 120 754 Netherlands 18,177 9,013 1,270 3,065 4,829 137 793 P oland 19, 731 10,470 605 2,708 5,948 1,579 10,373 P ortugal 8,428 3,118 450 2,785 2,075 1,099 4,417 Romania 6,458 5,625 49 170 614 350 2,325 Russia 39,406 17,979 979 13,641 6,807 1,949 10,348 Serbia 3,181 2,208 95 36 7 511 275 1,824 Slo vak Republic 3,231 2,147 51 85 948 252 1,41 6 Spain 45,085 19,250 2,690 13,334 9,811 2,870 20,240 Sw eden 23,488 2,995 2,758 11,322 6,413 3,332 23,895 Ukraine 12,733 10,074 161 1,328 1,170 852 5,559 United Kingdom 71,32 5 20,286 6,255 20,908 23,876 7,410 48, 709 Other coun trie s a 48,364 24,254 3,013 11,017 10,080 n.a. n.a. T otal 540,832 213,940 32,556 158,535 135,801 39,110 253, 106 Notes: aThe sum of 19 other Europ ean coun tries, most no tably Norw ay ,Switzerland and Ireland . Final sample only includ es unconsolidated accoun ts.
Column ve reports the number of subsidiaries in MNE groups. This includes all companies which report a corporate owner, which owns more than 50 percent. Fur-ther the corporate group must have subsidiaries in at least two dierent countries, in order to allocate the subsidiary to this category. Note, that this also includes subsidiaries in the same country as the headquarter. Finally, the last two columns compare the number of rms and the corresponding number of observations, which remain in our nal sample.12 At the rst glance the drop to 39,460 rms appears
dramatic. However, to the best of our knowledge, this is one of the largest samples - both in terms of rms and countries - used for an empirical study of this type.
This study investigates the eects of host country corporate tax rates on pre-and post-tax protability. The model outlined in section 3 predicts that under the hypothesis of prot shifting post-tax protability should be unambiguously nega-tively aected by a tax rate increase in the subsidiary country. We use two measures of post-tax protability. The rst measure of post-tax protability is the ratio of earnings before interest and after taxes over total assets (EBI/T A). For
robust-ness, we use prots and losses after taxes over total assets (P LAT /T A) as a second
measure of post-tax protability, which is a measure of net-of-tax return on assets. The numerator of the latter measure is equal to the the earnings before interest and taxation (EBIT) plus the net nancial prots and losses minus taxation. The
net nancial prots include interest payments and receipts, thusP LAT /T A, unlike EBI/T A, subtracts interest payments from the measure of the prots. Since this is
the prot attributable to shareholders, one may argue that the denominator of the latter measure of post-tax protability should have been equity capital, which would make the ratio a measure of after-tax return on equity. We do not do this here in order for the results to be comparable with other studies (e.g. Weichenrieder (2009)). Regarding pre-tax protability, we use the ratio of earnings before interest and taxes over total assets (EBIT /T A). Alternatively we also use the reported prot before
taxation over total assets (P LBT /T A), which includes nancial prots and losses
and therefore corresponds to theP LAT /T Ameasure.
In the descriptive statistics in Table 3 one can see that both measures of pre-tax protability are on average close to 0.09 and range from -0.55 to 0.71. This indi-cates that we include negative protabilities in our analysis.13 It is not a priori clear
whether prot shifting remains an issue if a subsidiary is in a loss making position, but we prefer to initially include loss making subsidiaries to restrict the censoring of the data. We will return to the issue of loss making companies in the robustness checks. After tax protabilities are above 0.06 on average and range from -0.51 to 0.61. This lower average and the reduced variation primarily on the positive side appears plausible because the part of prots which is taxed away is larger for prot making rms.
The primary regressor we are interested in is the host country tax rate. This includes the top corporate tax rate plus local prot taxes. For the local taxes we 12The detailled description of the data cleaning criteria are available from the authors upon request.
13We treat observations which deviate more than one half of the standard deviation from the mean as outliers. Admittedly, this criteria is rather arbitrary, but the results do not change much with alternative cut o points.
use the unweighted average of the local prot tax rates.14 Over the sample period
from 2002 to 2009 corporate tax rates were signicantly reduced. The extent of tax rate reductions varies from minor reductions in France due to the abolition of the tax professionelle to signicant drops from 23.5% to 10% in Bulgaria or from 31% to 20% in the Czech Republic.
Table 3: Descriptive Statistics
Variable Observations Mean St. Dev Min Max
EBI/T A 265,717 0.063 0.105 -0.512 0.617 P LAT /T A 265,717 0.062 0.109 -0.517 0.619 EBIT /T A 265,717 0.089 0.132 -0.554 0.713 P LBT /T A 265,717 0.088 0.137 -0.559 0.716 log(T A) 265,717 9.668 1.666 0.000 22.147 log(EM P) 253,704 4.494 1.539 0.000 12.471 Leverage 265,717 0.627 0.241 0.000 1.000 Growth rate 265,717 1.246 3.524 -17.616 12.954 Interest rate 265,717 4.065 3.064 0.398 27.310 Ination 265,717 102.987 10.004 70.417 178.605
Notes: Leverage is dened as the current plus non-current liabilities over total assets. Growth rate is the annual growth rate of GDP per capita. Interest rate denotes the 3-month money market rate. Ination is the consumer price index.
Apart from the host country tax rate we will use several control variables to cap-ture the eects of observed factors that might be related to protability. The control variables are the logarithm of total assets (log(T A)) and several country variables. The logarithm of total assets may reect that larger companies are more mature and less risky and hence, have lower protability. On the other hand, it may capture that larger companies have superior technology and market power and thus, higher protability. We also include the logarithm of the number of employees (log(EM P)) as an alternative measure of rm size. The country control variables include GDP per capita growth, which is expected to be positively related to protability. In addition, the ination rate as measured by the consumer price index is included to control for the impact of general price ination on measured prots and assets. Financial statements are prepared on the historical basis accounting. This method does not take into account the level of prices when valuing assets. Ignoring changes in the general price level may understate the economic value of assets to a rm as well as overstate rms' prots. Thus, ination is expected to be positively related to rm protability (cf. Feldstein and Summers (1979)). Finally, the money market interest rate is included, which may capture the eects of credit conditions in a coun-try. This is the annual average of the 3-month interest rate for the domestic money market. A higher interest rate means that rms will only undertake projects with higher returns and thus the money market interest rate is expected to be positively related to protability. Data on GDP per capital growth and ination is provided by the World Bank, and the money market interest rate by Eurostat and the national banks of the countries in question.
14The information on the tax rates is an extension of the data used in Loretz (2008). Addi-tional information stems mostly from the Global Tax Surveys of the InternaAddi-tional Bureau of Fiscal Documentation (IBFD), and the KPMG corporate tax rates surveys.
5 Results
This section presents the econometric results. First, we present our baseline re-gression of the four protability measures on corporate tax rates and several control variables in detail. We will use a panel xed eect approach as our workhorse model. We then run several robustness checks to account for the potential impact of debt, loss making companies or dierent circumstances in transition countries.
Before starting the presentation and the discussion of the results, we illustrate the relationship between the tax rate and each of the protability measures, using average values of the rm-level measures in each host country averaged over all eight years. Figure 5 is the scatter plot of each country's average pre-tax protability (EBIT /T A) and post-tax protability (EBI/T A) versus the average tax rate over
the period of 2002-2009. BE BG CZ DE DK EE ES FI FR GB GR HR HU IT LT LV NL PL PT RO RS RU SE SK UA BE BG CZ DE DK EE ES FI FR GB GR HR HU IT LT LV NL PL PT RO RS RU SE SK UA 0 .05 .1 .15 Average profitability (2002-2009) .1 .15 .2 .25 .3 .35
Average tax rate (2002-2009)
average EBIT/TA average EBI/TA
The black circles displaying pre-tax protability and the gray diamonds repre-senting post-tax protability show considerable variation across countries. Apart from the outlier Serbia (including Montenegro before 2008) Figure 5 indicates that subsidiaries in high tax countries tend to be less protable than those in low tax coun-tries. In addition, the slope of the relationship in the post-tax protability graph is slightly steeper than that of the pre-tax protability. Although the graphs do not control for characteristics of aliates or country characteristics that are unrelated to tax rates, there is indicative evidence that favours the prot shifting hypothesis. 5.1 Baseline Results
The benchmark for our empirical study are the xed eects regressions for all coun-tries. The dependent variables presented areEBIT /T AandP LBT /T Aas measures
for pre-tax protability and EBI/T A, and P LAT /T A for post-tax protability. In
addition to the host country tax rate, which is our regressor of primary interest we include several control variables. The logarithm of total assets and the logarithm of the number of employees are intended to capture the impact of the size of the rm. GDP per capita growth, the ination rate, and the money market interest rate
further control for the investment opportunities in the host countries. Given some of our control variables vary only at a higher level, all the standard errors correct for clustering of errors across country/industry cells. Table 4 reports the results for four baseline regressions.
Table 4: Baseline Results
pre-tax protability post-tax protability Dependent variable EBIT/TA PLBT/TA EBI/TA PLAT/TA Host Tax 0.020 -0.036 -0.056*** -0.108***
(0.027) (0.032) (0.021) (0.026) Log Total Assets -0.002 -0.001 0.001 0.002* (0.001) (0.002) 0.001 (0.001) Log Number of Employees 0.006*** 0.003** 0.003*** 0.000
(0.001) (0.001) (0.001) (0.001) GDP Growth 0.001*** 0.001*** 0.002*** 0.001*** (0.000) 0.000 (0.000) 0.000 Log Ination 0.025** 0.022 0.028*** 0.012 (0.013) (0.014) (0.010) (0.012) Money Rate 0.000 0.000 0.000 0.000 (0.000) (0.000) (0.000) (0.000) Time Dummies Y Y Y Y
Firm Fixed eects Y Y Y Y
Firms 39,110 39,110 39,110 39,110 Observations 253,106 253,106 253,106 253,106
R2 0.015 0.016 0.011 0.014
Notes: All regressions are estimated by panel data within groups estimators and includeyear dummies. Host Tax is the country's statutory tax rate including local taxes. GDP Growth is the GDP per capita growth rate provided by the World Bank. Ination is the logarithm of the consumer price index provided by the World Bank. Money Rate is the annual average of the 3 month interest rate for the domestic money market provided by Eurostat. Robust standard errors that correct for clustering of errors within country/industry cells are presented in the parentheses. * signicant at 10%; ** signicant at 5%; *** signicant at 1%.
Starting with pre-tax protability, Table 4 shows that the coecient on the tax rate is ambiguous and insignicant for both measures of protability. This is in stark contrast to the regressions on post-tax protability where the coecient for the host country tax rate has a signicant negative sign. Further the coecient al-most doubles in size from -0.056 forEBI/T A to -0.108 forP LAT /T A, which hints
at a special role for nancial prots and losses. We will return to the role of debt instruments for prot shifting in the robustness checks below. Overall, the eect of a change in the tax rate on reported protability is negative for after-tax protability and ambiguous for pre-tax protability. This is consistent with the prot shifting hypothesis, under which the reported post- and possibly pre-tax protability of sub-sidiaries in high tax countries should be lower than that of subsub-sidiaries in low tax countries. Furthermore, it is certainly inconsistent with the alternative theory of no prot shifting under which the tax rate should have a positive impact on pre-tax protability and no impact on post-tax protability.
The size of the company measured by the number of employees is found to have a signicant positive impact for most pre- and post-tax protability measures, while the log of total assets is only signicant forP LAT /T A. The fact that at most one of
the size measures turns out to be signicant is mostly due to the positive correlation between the two variables. Further the division bias (Borjas (1980)) potentially contributes to the employees being signicant rather than the total assets.15 Out
of the coecients on the country controls the GDP growth rate has the expected positive sign in all regressions. Further the ination turns out to be signicant in both regressions using protability measures excluding the nancial prots.
5.2 The role of debt
The fact that the tax eect on reported post-tax protability is twice as large for the measure of protability including nancial prots and losses indicates that the use of debt as a mean of prot shifting is potentially very important. To control for the use of debt as a mean of prot shifting we include the rm leverage as an additional control variable. First, there is the non-tax related impact of protabil-ity on the nancing decision of the rm. According to the pecking order theory (cf. Myers and Majluf (1984)), companies will nance investment projects rst with retained earnings and then with debt. Thus, one expects less protable rms to nance investment using debt and thus the leverage ratio and protability should be negatively associated. However, there may be a limit to the above channel. There is now a growing literature on the use of debt to shift prots, which indicates that rms with high pre-tax protabilities may strategically use debt in order to bene-t from bene-the deducbene-tion of inbene-teresbene-t for bene-tax purposes.16 Both arguments imply that
causality runs from protability to leverage.17 Before discussing the results, we want
the reader to be aware that there may be a degree of simultaneity in one of our regressions. Specically, the level of leverage may aect the concurrent measure of post-tax protability, P LBT /T A, through interest deductions, i.e. causality may
also run from leverage to protability. However, we believe that the level of leverage drives primarily the level of future interest deductions and thus simultaneity should be weak.
15For example, if the value of total assets is over-estimated in the reported accounts, this would tend to reduce each of the protability measures.
16Early empirical studies based on Canadian data (Jog and Tang (2001)) or US data (Desai et al. (2004)) indicate that debt plays an important role in prot shifting. Using an international dataset Huizinga et al (2008) provide further evidence for debt reacting to tax dierentials. For more recent evidence on the role of internal debt in prot shifting and a review of the literature see Buettner and Wamser (2009).
17This assumption is supported by recent evidence for a one-way Granger causality from prof-itability to leverage by Bartoloni (2011).
Table 5: The role of debt
pre-tax protability post-tax protability Dependent variable EBIT/TA PLBT/TA EBI/TA PLAT/TA Host Tax 0.070** 0.026 -0.017 -0.056**
(0.029) (0.032) (0.023) (0.026) Debt ratio -0.160*** -0.200*** -0.126*** -0.166***
(0.004) (0.005) (0.004) (0.004) Log Total Assets 0.004*** 0.007*** 0.006*** 0.009***
(0.002) (0.002) (0.001) (0.001) Log Number of Employees 0.007*** 0.004*** 0.004*** 0.001
(0.001) (0.001) (0.001) (0.001) GDP Growth 0.001*** 0.001*** 0.002*** 0.001*** (0.000) (0.000) (0.000) (0.000) Log Ination 0.032** 0.030** 0.033*** 0.019 (0.013) (0.014) (0.011) (0.012) Money Rate 0.000 0.000 0.000 0.000 (0.000) (0.000) (0.000) (0.000) Time Dummies Y Y Y Y
Firm Fixed eects Y Y Y Y
Firms 39,110 39,110 39,110 39,110 Observations 253,106 253,106 253,106 253,106
R2 0.059 0.080 0.051 0.014
Notes: All regressions are estimated by panel data within groups estimators and include year dummies. Host Tax is the country's statutory tax rate including local taxes. GDP Growth is the GDP per capita growth rate provided by the World Bank. Ination is the logarithm of the consumer price index provided by the World Bank. Money Rate is the annual average of the 3 month interest rate for the domestic money market provided by the Eurostat. Debt ratio is the sum of current and non-current liabilities over total assets. Robust standard errors that correct for clustering of errors within country/industry cells are presented in the parentheses. * signicant at 10%; ** signicant at 5%; *** signicant at 1%.
The results in Table 5 are rather strong. The newly included debt variable is highly signicant in all specications. Additionally, accounting for the strong nega-tive eect of the debt level on protability the signs of the tax rate in the regressions with the EBIT protability measures change. Controlling for the level of debt the tax rate now has a positive eect on EBIT /T A and no eect on EBI/T A. These
signs are in line with the prediction of the no prot shifting case in our stylized model. Put dierently, this would indicate that debt shifting is the primary form of prot shifting. However, the results for the regressions which use protability measures after nancial prots and losses remain unaected by the inclusion of the debt level as an additional control. The host country tax rate still has a signicant negative sign for post-tax protability and no eect on pre-tax protability. This is in line with our predictions for the presence of prot shifting. Hence, the inclu-sion of the debt level indicates that while prot shifting may to a large extent be organized through debt shifting, there are other potential ways to reallocate prots via nancial transactions. One of the potential channels, which has recently gained some considerable attention is the use of royalty payments.18
5.3 Robustness checks
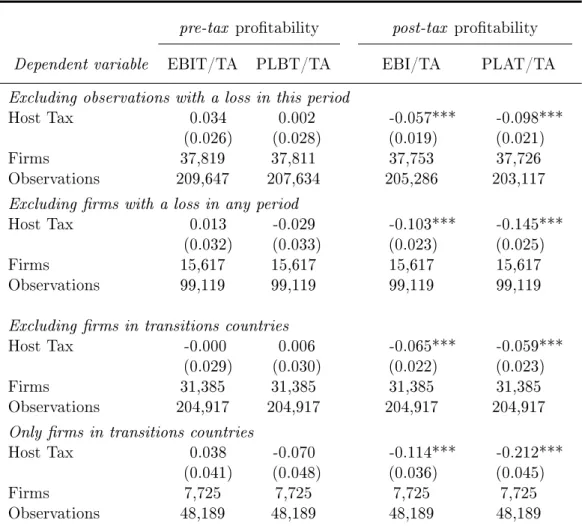
One immediate concern which may arise is the role of loss making subsidiaries. Ar-guably rms have little incentive to shift prots out of a country if they are already in a loss making position there. Furthermore, if the subsidiary has been in a signicant loss position it may also have the possibility to reduce its tax burden by means of loss carry forward. Therefore we might also expect rms which were in a loss position in previous years to be less inclined to use prot shifting. The rst two robustness checks in Table 6 address this issue. The top block excludes the observations, which have a loss in the current year. This reduces the sample size by roughly 50,000 ob-servations, but aects the number of rms much less with a reduction of only about 2,000 rms. In contrast the second block in Table 6 excludes all rms which have a loss in any of the periods we observe. This reduces the number of rms rather dramatically to only 15,617. This reects that a very large number of companies reported losses in the recent economic crises.
Table 6: Robustness checks
pre-tax protability post-tax protability Dependent variable EBIT/TA PLBT/TA EBI/TA PLAT/TA Excluding observations with a loss in this period
Host Tax 0.034 0.002 -0.057*** -0.098*** (0.026) (0.028) (0.019) (0.021) Firms 37,819 37,811 37,753 37,726 Observations 209,647 207,634 205,286 203,117 Excluding rms with a loss in any period
Host Tax 0.013 -0.029 -0.103*** -0.145*** (0.032) (0.033) (0.023) (0.025) Firms 15,617 15,617 15,617 15,617 Observations 99,119 99,119 99,119 99,119 Excluding rms in transitions countries
Host Tax -0.000 0.006 -0.065*** -0.059*** (0.029) (0.030) (0.022) (0.023) Firms 31,385 31,385 31,385 31,385 Observations 204,917 204,917 204,917 204,917 Only rms in transitions countries
Host Tax 0.038 -0.070 -0.114*** -0.212*** (0.041) (0.048) (0.036) (0.045) Firms 7,725 7,725 7,725 7,725 Observations 48,189 48,189 48,189 48,189
Notes: All regressions are estimated by panel data within groups estimators and include the same con-trol variables (including the debt ratio) as the previous regressions. Robust standard errors that correct for clustering of errors within country/industry cells are presented in the parentheses. * signicant at 10%; ** signicant at 5%; *** signicant at 1%.
The results for the subsamples without loss making observations or loss making rms conrm the nding of the baseline results. When excluding only the observa-tions with losses the results closely resemble our benchmark results, both in terms of
sign and magnitude of the tax eects. This is a striking result since these robustness checks also include the debt level as an additional control. The previous result of no prot shifting once the debt level is controlled for disappears, if we exclude the observations with negative prots. Further, when excluding all the rms with a loss arising in any period the magnitude of the coecient for tax rate increases substan-tially. Excluding all the companies which have losses at some point during 2002 and 2009 implies using only the most protable companies. It certainly appears consis-tent with the general concept of prot shifting that these companies react stronger to tax rate changes.
The second concern we are addressing in the robustness checks is the fact that the transition countries made the most aggressive tax cuts. At the same time the transition process could have been an important factor leading to higher protabil-ity. While the inclusion of country xed eects accounts for the country specic characteristics, it could still be the case that the negative sign for the host country tax rate is primarily driven by a few subsidiaries in the transition economies. To overcome these concerns we split the sample into the transition economies and the developed economies.19 The results in the third block of Table 6 show the eects for
the subsidiaries in the developed economies and the fourth block for the subsidiaries in the transition. The results conrm the suspicion that the tax eect is larger in the transition countries. However, the results are still line with the predictions for the prot shifting hypothesis, even after excluding the transition economies from the sample. One interesting feature of this nal robustness check is that the tax eect on the EBI/T A prot measure is roughly in line with the coecient for tax in the P LAT /T A regression once we only use the developed economies. In contrast using
only the transition countries we can see a stronger eect of a tax rate change on the P LAT /T A measure. A tentative conclusion can be that the use of nancial
instruments plays a more important role in the transition countries.
6 Conclusion
This paper investigates the extent to which subsidiaries of multinational rms in 25 countries engage in prot shifting. In contrast to the preceding theoretical literature, which has modelled the eects of taxes on the level of reported prots, we model the eects of corporate taxes on protability measured as the ratio of prots to total assets. It becomes apparent that theoretical predictions in the case of prot shifting are not clear cut with regard to pre-tax protability. If a country increases its tax rate, then the aliate will decrease its capital stock to satisfy the marginal condi-tion, which will tend to raise pre-tax protability. In addicondi-tion, it will transfer prots to lower-taxed aliates. Hence, pre-tax protability, which is the ratio of reported pre-tax prots over total assets, may not decrease if prot shifting is a suciently costly activity and the former eect dominates. On the other hand, if there is prot shifting, then reported post-tax protability should denitely be reduced in reaction to an increase in the tax rate.
The empirical work extends the existing literature by looking at both pre- and 19For the purpose of this paper we dene the following countries as transition countries: Bulgaria, Croatia, Czech Republic, Estonia, Hungary, Latvia, Lithuania, Poland, Romania, Serbia, Slovak Republic and the Ukraine.
post-tax protability of the same sample of multinational subsidiaries, as opposed to the papers which look at either pre- or post-tax protability but not in conjunc-tion. The primary results come from a sample on 39,110 rms over the period of 2002-2009 inclusive. Results are consistent with the hypothesis that multinationals transfer prots between their foreign subsidiaries for tax reasons. Our results suggest that a 10 percentage point increase in the host country corporate tax rate decreases post-tax protability excluding nancial prots by 0.6 percentage points. For prots measures including nancial prots the tax elasticity is even higher with a 1.1 per-centage point increase. Extensive robustness checks show that protable rms tend to shift more prots and that debt shifting appears to be a key channel for prot shifting. The latter is especially true with respect to the transition countries where the tax dierential is larger.
References
Bartoloni, E. (2011), Capital Structure and Innovation: Causality and Determi-nants, Empirica, Online rst: DOI 10.1007/s10663-011-9179-y.
Bartelsman, E. J. and R. M. W. J. Beetsma (2003), Why pay more? Corporate tax avoidance through transfer pricing in OECD countries, Journal of Public Eco-nomics, Vol. 87, pp. 2225-2252.
Bernard, A. B., Jensen, J. B. and P. K. Schott (2006), Transfer Pricing by US-Based Multinational Firms, Tuch School of Business Working Paper No. 2006-2233.
Borjas, G. J. (1980), The relationship between Wages and Weekly Hours of Work: the Role of Division Bias, The Journal of Human Resources, Vol. 15, (3), pp. 409-423.
Buettner T. and G. Wamser (2009), Internal Debt and Multinationals' Prot Shift-ing: Empirical Evidence from Firm-Level Panel Data, Oxford University Centre for Business Taxation Working Papers WP 09/18.
Clausing, K. A. (2003), Tax motivated transfer pricing and the US intra-rm trade prices, Journal of Public Economics, Vol 87, pp. 2207-2233.
Collins, J. H., Kemsley D. and D. A. Shackelford (1997), Transfer Pricing and the Persistent Zero Taxable Income of Foreign-Controlled US Corporations, The Journal of the American Taxation Association, Vol. 19, pp. 68-83.
De Mooij, R. A. and S. Ederveen (2003), Taxation and Foreign Direct Investment: A Synthesis of Empirical Research, International Tax and Public Finance, Vol. 10, (6), pp. 673-693.
De Mooij, R. A. and S. Ederveen (2008), Corporate Tax Elasticities: A Reader's Guide to Empirical Findings, Oxford Review of Economic Policy, Vol. 24, (4), pp. 680-697.
Desai, M. A., Foley, C. F., and J. R. Hines (2004), A multinational perspective on capital structure choice and internal capital market, Journal of Finance, Vol. 59, (6), pp. 2451-2488.
Devereux, M. P. (2007), The Impact of Taxation on the Location of Capital, Firms and Prot: A Survey of Empirical Evidence, Oxford University Centre for Busi-ness Taxation Working Paper No. 07/02.
Dischinger, M. P. (2010), Prot Shifting by Multinationals: Evidence from Euro-pean Micro Panel Data, Munich Economics Discussion Papers.
Dischinger, M. P. and N. Riedel (2011), Corporate taxes and the location of intan-gible assets within multinational rms, Journal of Public Economics, Vol. 95, (7-8), pp. 691-707.
Feldstein, M. and L. Summers (1979), Ination and the Taxation of Capital Income in the Corporate Sector, NBER Working paper No. 312.
Grubert, H. (1997), Another Look at the Low Taxable Income of Foreign-Controlled Companies in the United States, Oce of Tax Analysis Paper 74.
Grubert, H. and J. Mutti (1991), Taxes, Taris and Transfer Pricing in Multina-tional Corporate Decision Making, The Review of Economics and Statistics, Vol. 73, (2), pp. 285-293.
Hines, J. R. and E. M. Rice (1994), Fiscal paradise: Foreign Tax Havens and Amer-ican Business, The Quarterly Journal of Economics, Vol. 109, (1), pp. 149-182. Huizinga, H. and L. Laeven (2008), International prot-shifting within multination-als: a multi-country Perspective, Journal of Public Economics Vol. 92, (5-6), pp. 1164-1182.
Huizinga, H., Laeven, L. and G. Nicodeme (2008), Capital structure and interna-tional debt shifting, Journal of Financial Economics Vol. 88, pp. 80-118. Jog, V. M. and J. Tang (2001), Tax Reforms, Debt Shifting and Tax Revenues:
Multinational Corporations in Canada, International Tax and Public Finance Vol. 8, (1), pp. 5-25.
Karkinsky, T. and N. Riedel (2009), Corporate Taxation and the Choice of Patent Location within Multinational Firms, Oxford University Centre for Business Taxation Working Papers No. 0931.
Loretz, S. (2008), Corporate taxation in the OECD in a wider context, Oxford Re-view of Economic Policy, Vol. 24 (4), pp 639-660.
Mani, G. and S. Mokkas (2011), Transfer-pricing and measured productivity of multinational rms, Oxford Bulletin of Economics and Statistics, Vol. 71, (1), pp. 1-20.
Mintz, J. and M. Smart (2004), Income Shifting, Investment, and tax competition: theory and evidence from provincial taxation in Canada, Journal of Public Eco-nomics, Vol. 88, pp. 1149-1168.
Mokkas, S. (2009), Corporate taxation and the behaviour of multinational rms, University of Oxford. Dept. of Economics, University of Oxford. Division of Social Sciences, St. Antony's College (University of Oxford).
Myers, S.C. and N.S. Majluf (1984), Corporate nancing and investment decisions when rms have information that investors do not have, Journal of Financial Economics, Vol. 13, pp. 187-221.
Swenson, D. L. (2001), Tax Reforms and Evidence of Transfer Pricing, National Tax Journal, Vol. 54, (1), pp. 7-25.
Weichenrieder, A. J. (2009), Prot Shifting in the EU: Evidence from Germany, In-ternational Tax and Public Finance, Vol. 16, (3), pp. 281-297.
Appendix
A.1 Theoretical Model
In this section we present a stylized model of a multinational enterprise (MNE). The MNE consists of two entities 1,2, which operate in two dierent countries 1,2 with statutory tax rates τ1 > τ2. The prot functions of the two subsidiaries are given
by F1, F2, which are a function of capital K1, K2 respectively and are assumed to
be homogeneous of degree a <1.1 In addition, we assume that the MNE transfers prots S < F1 from subsidiary 1to subsidiary2. We assume that the prot shifting
activity comes at a cost of:
C= b 2 S F1 2 F1 (A.1)
The MNE is maximising its overall post-tax prots with respect to the capital stockK1,K2 and prot shiftingS:
max K1,K2,S Π = (1−τ1) (F1−S) + (1−τ2) (F2+S)−r(K1+K2)− b 2 S2 F1 (A.2)
wherer is the cost of capital which is assumed to be equal in both locations.
The rst order conditions yield:
∂F1 ∂K1 =F1K= r 1−τ1+ b2 S F1 2 (A.3) ∂F2 ∂K2 =F2K = r 1−τ2 (A.4) S = τ1−τ2 b F1 (A.5)
Equation (A.5) combined with the restriction for an internal solution (S < F1)
dictates thatb > τ1−τ2.
In the case of no prot shifting (b→ ∞, S →0), from (A.3) and (A.4):
F1K = r 1−τ1 , F2K = r 1−τ2 (A.6)
Given that F1, F2 are assumed homogeneous of degreeathen (A.6) yields:
Average pre-tax Protability: F1
K1 = r a(1−τ1) ,F2 K2 = r a(1−τ2) (A.7)
Average post-tax Protability: F1
K1 (1−τ1) = r a, F2 K2 (1−τ2) = r a
1If a function F(K) is homogeneous of degree a, then ∂F(K)
∂K K = aF(K). In addition, it is
assumed thata <1, otherwise the model cannot have a solution for the optimal capital level of
Hence, pre-tax protabilities must vary with the local tax rate to achieve the equalisation of post-tax protability. Partial dierentiation of (A.7) with respect to the tax rates yields:
Average pre-tax Protability Firm 1:∂
F1 K1 ∂τ1 = r a(1−τ1)2 ,∂ F1 K1 ∂τ2 = 0 (A.8) Average pre-tax Protability Firm 2:∂
F2 K2 ∂τ2 = r a(1−τ2)2 ,∂ F2 K2 ∂τ1 = 0
Average post-tax Protability Firm 1:∂ h F1 K1(1−τ1) i ∂τ1 = ∂hF1 K1 (1−τ1) i ∂τ2 = 0
Average post-tax Protability Firm 2: ∂ h F1 K1 (1−τ2) i ∂τ1 = ∂ h F1 K1(1−τ2) i ∂τ2 = 0 Under the alternative hypothesis of prot shifting (τ1−τ2< b <∞,S >0), the
reported average pre-tax protabilities are:
F1−S K1 = 1 aF1K− S K1 (A.9) F2+S K2 = 1 aF2K+ S K2 = 1 aF2K+ S K1 K1 K2 (A.10)
Pre-tax protability in country 2 is higher than pre-tax protability in country 1 if: F2+S K2 > F1−S K1 ⇔ 1 aF2K+ S K1 K1 K2 > 1 aF1K− S K1 ⇔ 1 a(F2K−F1K) > − S K1 K1 K2 + 1 ⇔ F1K a F2K F1K −1 > −τ1−τ2 b F1 K1 K1 K2 + 1 ⇔ 1−τ1+2b S F1 2 1−τ2 −1 > −τ1−τ2 b K1 K2 + 1 ⇔ 1−τ1+b2 τ1−bτ2 2 1−τ2 + τ1−τ2 b K1 K2 + 1 > 1⇔ 1 1−τ2 − τ1 1−τ2 + 1 2b (τ1−τ2)2 1−τ2 + τ1−τ2 b K1 K2 + 1 > 1⇔ (τ1−τ2) 1 2b τ1−τ2 1−τ2 +1 b K1 K2 + 1 > τ1−τ2 1−τ2 ⇔ τ1−τ2 2b + 1 b(1−τ2) K1 K2 + 1 > 1 (A.11) With regard to average reported post-tax protabilities of the two subsidiaries:
(1−τ2) F2+S K2 −(1−τ1) F1−S K1 > 0⇔ (1−τ2) 1 aF2K+ S K1 K1 K2 −(1−τ1) 1 aF1K− S K1 > 0⇔ r a−(1−τ1) r a 1 1−τ1+2b S F1 2 + S K1 (1−τ2) K1 K2 + (1−τ1) > 0⇔ r a 1− 1−τ1 1−τ1+2b S F1 2 + S K1 (1−τ2) K1 K2 + (1−τ1) > 0 (A.12)
Both terms of inequality (A.12) are positive and thus after-tax protability in the low tax country 2is unambiguously higher than in the high tax country, 1.
Passing on to comparative statics, we dierentiate (A.9) with respect to the two tax rates: ∂F1−S K1 ∂τ1 = ∂h1aF1K−KS1 i ∂τ1 ⇒ ∂F1−S K1 ∂τ1 = ∂ h 1 aF1K− τ1−τ2 b F1 K1 i ∂τ1 ⇒ ∂F1−S K1 ∂τ1 = ∂ 1 aF1K 1− τ1−τ2 b ∂τ1 ⇒ ∂F1−S K1 ∂τ1 = r a ∂ 1 1−τ1+21b(τ1−τ2)2 1− τ1−τ2 b ∂τ1 ⇒ ∂F1−S K1 ∂τ1 = r a ∂h 2(b−τ1+τ2) 2b(1−τ1)+(τ1−τ2)2 i ∂τ1 ⇒ ∂F1−S K1 ∂τ1 = 2r a h −2b(1−τ1) + (τ1−τ2)2 −(b−τ1+τ2) (−2b+ 2 (τ1−τ2)) i h 2b(1−τ1) + (τ1−τ2)2 i2 ⇒ ∂F1−S K1 ∂τ1 = 2rh2b(b−1−τ1+ 2τ2) + (τ1−τ2)2 i ah2b(1−τ1) + (τ1−τ2)2 i2 (A.13)
If costs of prot shifting are not too high (b ⇒ (τ1 −τ2) it can be shown that
2rh2b(b−1−τ1+ 2τ2) + (τ1−τ2)2 i ah2b(1−τ1) + (τ1−τ2)2 i2 < 0⇔ 2b(b−1−τ1+ 2τ2) < −(τ1−τ2)2 ⇒ 2 (τ1−τ2) (τ1−τ2−1−τ1+ 2τ2) < −(τ1−τ2)2 ⇒ 2 (τ1−τ2−1−τ1+ 2τ2) < −(τ1−τ2)⇒ −2 (1−τ2) < −(τ1−τ2)⇒ 2 (1−τ2) > (τ1−τ2)⇒ 2 > (τ1+τ2) ∂F1−S K1 ∂τ2 = r a ∂ h 2(b−τ1+τ2) 2b(1−τ1)+(τ1−τ2)2 i ∂τ2 ⇒ ∂F1−S K1 ∂τ2 = 2r a 2b(1−τ1) + (τ1−τ2)2 −(b−τ1+τ2) (−2 (τ1−τ2)) h 2b(1−τ1) + (τ1−τ2)2 i2 ⇒ ∂F1−S K1 ∂τ2 = 2r h 2b(1−τ2)−(τ1−τ2)2 i a h 2b(1−τ1) + (τ1−τ2)2 i2 (A.14)
As regards average reported after-tax protability of subsidiary 1:
∂h(1−τ1)F1K−1S i ∂τ1 = r a ∂ h 2(b−τ1+τ2)(1−τ1) 2b(1−τ1)+(τ1−τ2)2 i ∂τ1 ⇒ ∂h(1−τ1)F1K−1S i ∂τ1 = 2r a (−1−b−τ2+ 2τ1) h 2b(1−τ1) + (τ1−τ2)2 i h 2b(1−τ1) + (τ1−τ2)2 i2 + 2r a −(b−τ1+τ2) (1−τ1) (−2b+ 2 (τ1−τ2)) h 2b(1−τ1) + (τ1−τ2)2 i2 ∂ h (1−τ1)F1K−1S i ∂τ1 = − 2r a h 2b(1−τ1) + (τ1−τ2)2 i2 h b(2−(2−τ1)τ1−(2−τ2)τ2)−(1−τ2) (τ1−τ2)2 i (A.15)
∂h(1−τ1)FK1−1S i ∂τ2 = r a ∂h2(b−τ1+τ2)(1−τ1) 2b(1−τ1)+(τ1−τ2)2 i ∂τ2 ⇒ ∂ h (1−τ1)FK1−1S i ∂τ2 = 2r a (1−τ1) h 2b(1−τ1) + (τ1−τ2)2 i h 2b(1−τ1) + (τ1−τ2)2 i2 + 2r a −(b−τ1+τ2) (1−τ1) (−2 (τ1−τ2)) h 2b(1−τ1) + (τ1−τ2)2 i2 ∂h(1−τ1)FK1−1S i ∂τ2 = 2r(1−τ1) h 2b(1−τ2)−(τ1−τ2)2 i ah2b(1−τ1) + (τ1−τ2)2 i2 (A.16) With regard to equation (A.15), given that b > τ1−τ2 then for the numerator
to be positive it suces to prove that:
2−2τ1+τ12−2τ2+τ22 > (1−τ2) (τ1−τ2)⇒
2 (1−τ1) +τ12−2τ2+τ22 > τ1−τ2−τ2τ1+τ22⇒
2 (1−τ1) +τ12−τ2 > τ1−τ2τ1 ⇒
2 (1−τ1) > τ1(1−τ1) +τ2(1−τ1)⇒
2 > τ1+τ2
which holds for any conceivable tax rates. Equally, in equation (A.16) the nu-merator is positive since b > τ1−τ2 and(1−τ2)>(τ1−τ2).
In order to make progress with respect to the comparative statics of the reported protability of subsidiary 2 one needs to solve for the ratio of K1/K2 using
(A.3)-(A.5) and substitute into (A.10). We, rstly, assume prot functions of the form
Fi = AiKia, where Ai is the total factor productivity for each of the subsidiaries.
Combinations of equations (A.3), (A.4) and (A.5) yield:
K1 K2 = A1 A2 1/1−a"1−τ 1+(τ1−τ2) 2 2b (1−τ2) #1/1−a
Equation (A.10) then yields:
F2+S K2 = r a 1 1−τ2 + A1 A2 1/1−a τ1−τ2 b h 1−τ1+(τ1−τ2) 2 2b ia/1−a (1−τ2) 1/1−a (A.17) Dierentiation of (A.17) with respect to τ1, τ2 yields:
∂F2+S K2 ∂τ1 = r ab(1−τ2) 1/1−a A1 A2 1/1−a h 1−τ1+(τ1−τ2) 2 2b ia/1−a + a(τ1−τ2) 1−a h 1−τ1+ (τ1−τ2) 2 2b i1−aa −1 τ1−τ2 b −1 ∂F2+S K2 ∂τ1 = r ab(1−τ2) 1/1−a A1 A2 1/1−a" 1−τ1+ (τ1−τ2)2 2b #a/1−a " 1 +a(τ1−τ2) 1−a τ1−τ2 b −1 1 1−τ1+(τ1−τ2) 2 2b # (A.18) ∂F2+S K2 ∂τ2 = r a(1−τ2)2 − r ab A1 A2 1/1−a h 1−τ1+(τ1−τ2) 2 2b ia/1−a (1−τ2) 1/1−a + r a A1 A2 1/1−a τ1−τ2 b (1−τ2) 1/1−a a 1−a h 1−τ1+(τ1−τ2) 2 2b i1−aa −1 −τ1−τ2 b (1−τ2) 2/1−a + r a A1 A2 1/1−a τ1−τ2 b h 1−τ1+(τ1−τ2) 2 2b i1−aa 1 1−a(1−τ2) a/1−a (1−τ2) 2/1−a (A.19)
Below are the partial derivatives of the average reported post-tax protability of subsidiary 2with respect to the tax rates:
∂ h (1−τ2)FK2+2S i ∂τ1 = r ab(1−τ2) a/1−a A1 A2 1/1−a h 1−τ1+(τ1−τ2) 2 2b ia/1−a + a(τ1−τ2) 1−a h 1−τ1+(τ1−τ2) 2 2b i1−aa −1 τ1−τ2 b −1 ∂h(1−τ2)FK2+2S i ∂τ1 = r ab(1−τ2) a/1−a A1 A2 1/1−a" 1−τ1+ (τ1−τ2)2 2b #a/1−a ∗ " 1 +a(τ1−τ2) 1−a τ1−τ2 b −1 1 1−τ1+(τ1−τ2) 2 2b # (A.20)
∂h(1−τ2)FK2+2S i ∂τ2 = − r ab A1 A2 1/1−a"1−τ 1+ (τ1 −τ2)2 2b 1−τ2 #a/1−a + r a A1 A2 1/1−a τ1−τ2 b a 1−a h 1−τ1+(τ1−τ2) 2 2b i1−aa −1 τ1−τ2 b −1 (1−τ2)( 2a 1−a)−( a 1−a) + r a A1 A2 1/1−a τ1−τ2 b a 1−a h 1−τ1+(τ1 −τ2)2 2b i1−aa (1−τ2) a 1−a−1 (1−τ2) 2a/1−a ∂ h (1−τ2)FK2+2S i ∂τ2 = − r ab A1 A2 1/1−a"1−τ 1+ (τ1−τ2) 2 2b 1−τ2 #a/1−a " 1 + a 1−a(τ1−τ2) 1− τ1−τ2 b 1−τ1+(τ1−τ2) 2 2b − a 1−a(τ1−τ2) (1−τ2) # (A.21)