August 2017
Costs and utilization of corn in seven Iowa counties
H. L. Thomas
Iowa State College
John A. Hopkins Jr.
Iowa State College
Follow this and additional works at:
http://lib.dr.iastate.edu/bulletin
Part of the
Agricultural Economics Commons
This Article is brought to you for free and open access by the Extension and Experiment Station Publications at Iowa State University Digital Repository. It has been accepted for inclusion in Bulletin by an authorized editor of Iowa State University Digital Repository. For more information, please [email protected].
Recommended Citation
Thomas, H. L. and Hopkins, John A. Jr. (2017) "Costs and utilization of corn in seven Iowa counties,"Bulletin: Vol. 25 : No. 289 , Article 1.
June, 1932 Bulletin No. 289
1
|
and Utilization o f Corn in
Seven Iowa Counties
By H . L . Th o m a s a n d Jo h n A . Ho p k i n s, Jr.
AGRICULTURAL, E X P E R IM E N T STATIO N IO W A ST A T E COLLEGE OF AGRICU LTUR E
AN D M ECH ANIC A R TS
C. F . Cu r t i s s, D irector AGRICULTURAL ECONOMICS SECTION
, SUMMARY
1. The importance of corn varies markedly in different parts of Iowa. The portion of land occupied by corn depends on the relative advantage of other crops and on the requirements of livestock enterprises.
2. Labor requirement is one of the most important costs in producing corn. The amount required depends upon:
a. The cultural sequence used. The results of this study indicate that two discings (one before and one after plowing), two harrowings (one before and one after planting) and three cultivations is. the most common
sequence used. ^ ^
b. The method of planting. Where listing is feasible, it reduces the amount of labor to produce the crop. c. The size of the machines and of the power units used. d. Performing tillage operations at the right time, j Most
cultural operations are performed during a period of several weeks, but during a few days two-thirds or three-fourths of the work is accomplished.
3. The number of man hours required to grow an acre of corn ranged from about 5 in Palo Alto and Mills counties to about 10 in Fayette and Iowa counties. The number of man hours required in picking an acre of corn varied from 5 hours in Mills County to 8 in Fayette and Cedar counties.
4. Operating costs'per acre ranged from $11.00 or $12.00 m Mills and Van Buren counties to $19.00 or $20.00 in Iowa Coun ty. These variations can be attributed to differences in cost of labor, equipment and manure. The average cost per bushel showed a variation from 40 cents in Mills County to 77 cents m Van Buren County.
5. Farmers in Iowa County fed 91 percent of their corn to livestock and sold 8 percent for cash. In Webster County, only 74 percent was fed to livestock and the balance was sold for
cash. ,
6. The amount of corn produced affects all phases of tne
farm business. Farms raising an average of 2,000 b u s h e l s of
corn had a net income of about $4,300 and those raising 6,00(1 bushels had an income of about $5,000.
aH
W
M
M
Costs and Utilization o f Corn
in Seven Iowa Counties
By H . L . Th o m a s a n d Jo h n A . Ho p k i n s, Jr.*
The demand for information on the cost of producing an acre or a bushel of corn has increased greatly during the past few years. This is especially true in Iowa, where corn is the basic crop.
Inquiring individuals are often disappointed when they learn that corn cost data are not available in simple terms of dollars and cents. This is so because they fail to realize the difficulties encountered in attempting to evaluate (measure the quantity as well as the quality of) some of the more important elements of cost. They also overlook the fact that the cost of producing corn depends largely on local soil, climatic and economic condi tions and that these factors vary from one section of the state to another.
This publication presents a study of the use of land, equip ment, power, labor and other factors of production in the rais ing of corn in order to determine the range and normal require ments of these physical cost elements in the several type-of- farming areas of the state, and to ascertain, as nearly as pos sible, the money-equivalent cost of corn production.
SOURCES OF MATERIAL AND METHODS
The primary data used in this publication were obtained from detailed crop history and labor records kept by cooperat ing farmers during 1927 and 1928. About 25 farms were- se lected in each of five counties representing the main type-of- farming areas of the state as follows : South half of Palo Alto and north half of Pocahontas, the Cash Grain A rea; Fayette, the Northeastern Dairy Area; Cedar, the Eastern Meat Area; Van Buren, the Southern Pasture A rea; and Mills, the Western Meat Area. These data have been supplemented with similar information from the Iowa County Cost Route for the years 1925 to 1927, and from the Webster County Cost Route for the years ¿928 to 1930.
*The writers wish to acknowledge the work of Cleon E. Herriott of the Iowa Ex tension Service, who conducted the field work and assisted in summarizing the original records. Professor H. D. Hughes o f the Farm Crops and Soils Section gave valuable assistance and suggestions in the preparation of the manuscript.
THE PLACE OF CORN IN THE CROPPING SYSTEMS OF IOWA
Corn occupies one-third of the total farm land in Iowa—more than any other crop.
The farmer cannot plant his entire farm in corn because this would soon reduce yields to an unprofitable level, because he needs other crops and pasture to feed in conjunction with the corn, and because the highly seasonal labor requirements of the crop would leave him no work during the greater part of the year.. He, therefore, attempts to achieve an equilibrium be tween the different crop and livestock enterprises which will give him the greatest net income for the use of the land and labor.
The most profitable combination of crops varies with soil, topography and climatic conditions as well as with the market demands and prices of crop and livestock products. As between the various farming areas of Iowa, therefore, the percentage of land in corn varies considerably as shown in figs. 1 and 2.
In the north central part of Iowa, commonly referred to as the Cash Grain Area, corn has its greatest relative advantage in its competition with other crops. Here yields of corn are rela tively high. The land is easy to till. There is little rough land which it is necessary to keep in the less valuable pasture crops. Therefore the number of cattle per farm tends to be smaller
WEBSTER PALO ALTO F A Y E T T E CEDAR h IOWA E 3 VAN BUREN O M IL L S
lllllllilllllllllllll h a y • llt e a K i ROTATION PASTURE
i I I i I I I
Mise. CROPS E£5£B!;BI P E R M A N E N T P ASTUR E
30 40 50 60 7Ô 80 90 100 PERCENT
GRAIN
Fig. 2. The disposition o f farm land in seven Iowa counties.
than in other parts of the state, and more of the corn crop is sold as grain. The area of hay land is small to conform to the size of the cattle enterprise. All of these influences make for a relatively large acreage of corn, which in this section, occupies from 40 to 45 percent of the land farmed. The crop rotation tends to approach a two-year alternation between corn and small grains of which the latter is mostly oats.
Near the northern boundary of the. state the yield of oats tends to increase relative to that of corn. Here it is necessary to raise varieties of corn which mature in a shorter growing sea son to avoid injury by frost. Also seasonal peaks of the labor on corn tend to become more acute and more closely crowded together. The crop therefore occupies a less favorable relative position and a smaller percentage of the land.
In the northeastern part of the state is an area with a greater percentage of rough pasture land than in the central area. Also the soil and climate encourage a relatively large acreage of oats which fit better into the dairy ration than for fattening hogs or cattle. To complement the pasture, a relatively large acreage of hay is raised for winter roughage. The crop system, as shown in fig. 2 comprises approximately 30 percent of corn, 25 percent of oats, 14 percent of hay and 28 percent of pasture.
In the Southern Pasture Area, typified in the present study by Van Burén County, we find the highest percentage in pasture of any area of the state. The topography is rolling to rough and about 35 percent of the farmed land is in pasture. The soil in this section is less productive than in the Northeastern Dairy Area. The pasture tends to dry up in the middle of the summer so that it would not support as constant a milk flow if it were used for dairy production. Also the temperature is warmer during the crop season, so that oats do not do so well as in the northern sections.
In this Southern Pasture Area corn occupies slightly over 30 percent of the land farmed and oats only 12 t'o 14 percent, while hay occupies about the same percentage as oats. The large supply of pasturage and the advantage of corn over oats on the smaller available acreage of crop land provides advan tageous conditions for raising beef cattle. Therefore the corn is used for fattening the cattle and hogs raised. Very little is available for sale, and, in fact, the smaller apreage per farm and the lower yield than in most other parts of the state result in an insufficiency of corn to fatten all the cattle raised in some sections.
In the western and in the east central part of the state are two areas of rolling land adapted to the production of hogs and beef cattle. Both of these areas consist of loessial soil, but the eastern or Mississippi loess area is of older formation, more leached out and more commonly acid. In this section, typified in fig. 2 by Iowa and Cedar counties, approximately 30 percent of the land is in pasture. Corn occupies between 35 and 40 per cent, and small grains about half the acreage of corn. The hay which occupies from 8 to 15 percent of, the land is mostly timo thy and clover and is not highly satisfactory.
In the western Meat Producing Area most of the land contains enough lime so that alfalfa can be grown for hay, and sweet clover for pasture. The area in hay and pasture tends to run lower than in the eastern section, partly because the higher yielding alfalfa crop requires a relatively smaller acreage to produce the roughage needed by the cattle. The yields of corn give that crop an advantage over any other, and it occupies, roughly, one-half of the land in crops or pasture, while small grains take only about one-third as much land as corn. The large amounts of corn and alfalfa provide the essential feeds for the production of hogs and beef cattle, Many feeder cattle are shipped into this section for winter feeding.
Thus, in each area of the state corn is the chief crop. Only in the northern counties where oats yield about two-thirds as many pounds per acre, is corn’s supremacy even threatened by another crop. The proportion of land occupied by corn depends on its advantage relative to other crops which must be included in the system and on the requirements of livestock enterprises needed under each specific set of conditions to, round out the most profitable farm organization.
THE LABOR REQUIREMENT OF CORN
The production of an acre of corn requires more labor than any other common Iowa crop. The demand of the corn crop for labor at certain critical seasons is, in Iowa, one of the most
important considerations affecting the choice of farm enter prises. When this study was undertaken it was thought that variations in practices were likely to come to light which might suggest methods of conserving labor without proportionately reducing the yield of corn. The following few pages summarize the data obtained on the variation in practices and contain some suggestions as to their effect on costs and on yields.!
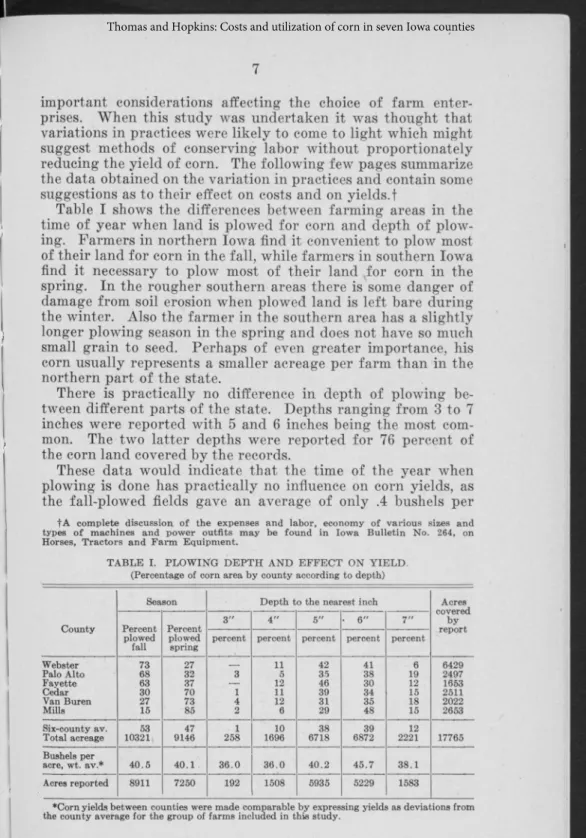
Table I shows the differences between farming areas in the time of year when land is plowed for corn and depth of plow ing. Farmers in northern Iowa find it convenient to plow most of their land for corn in the fall, while farmers in southern Iowa find it necessary to plow most of their land vfor corn in the spring. In the rougher southern areas there is some danger of damage from soil erosion when plowed land is left bare during the winter. Also the farmer in the southern area has a slightly longer plowing season in the spring and does not have so much small grain to seed. Perhaps of even greater importance, his corn usually represents a smaller acreage per farm than in the northern part of the state.
There is practically no difference in depth of plowing be tween different parts of the state. Depths ranging from 3 to 7 inches were reported with 5 and 6 inches being the most com mon. The two latter depths were reported for 76 percent of the corn land covered by the records.
These data would indicate that the time of the year when plowing is done has practically no influence on corn yields, as the fall-plowed fields gave an average of only .4 bushels per
tA complete discussion, o f the expenses and labor, economy o f various sizes and types o f machines and power outfits may be found in Iowa Bulletin No. 264, on Horses, Tractors and Farm Equipment.
TABLE I. PLOWING DEPTH AND EFFECT ON YIELD. (Percentage of corn area by county according to depth)
County
Season Depth to the nearest inch Acres covered by report Percent plowed fall Percent plowed spring 3 " 4 " 5" • 6 " 7 " percent percent percent percent percent
Webster 73 27 ___ 11 42 41 6 6429 Palo Alto 68 32 3 5 35 38 19 2497 Favette 63 37 — 12 46 30 12 1653 Cedar 30 70 1 11 39 34 15 2511 Van Buren 27 73 4 12 31 35 18 2022 Mills 15 85 2 6 29 48 15 2653 Six-county av. 53 47 1 10 38 39 12 Total acreage 10321^ 9146 258 1696 6718 6872 2221 17765 Bushels per acre, wt. av.* 40.5 40.1 36.0 36.0 40.2 45.7 38.1 Acres reported 8911 7250 192 1508 5935 5229 1583
*Corn yields between counties were made comparable by expressing yields as deviations from the county average for the group of farms included in this study.
acre more than those spring-plowed. The yield of corn in creased with the depth np to 6 inches and then declined with a depth of 7 inches. The results of this investigation indicate that 5 and 6 inches are'the most practicable depths to plow'. Ex perimental investigation, however, in almost all cases, has shown little difference in yield with depths between 4 and 8 inches.
DISCING
This operation serves a number of purposes during the pro cess of seedbed preparation. Before the field is plowed the disc is ordinarily used to cut up old cornstalks so that these can be easily covered by the plow. After plowing it is customary to disc to destroy young webds, and to put the land in final condi tion for planting. The number of times a given field is disced will depend on the physical condition of the soil and the num ber and kind of weeds, as well as the amount of time and labor available for the preparation of the seedbed.
An examination of table II shows that two discings (one be fore and one after plowing) is the usual practice in most of these areas. Mills County, which showed 52 percent of the corn was disced only once, is the outstanding exception. Fayette and Palo Alto counties show a large percentage of the land disced only once, while three and four discings are common in the southeastern part of the state.
P T f f H TABLE II. DISCING— TIMES OVER AND EFFECT ON YIELD. (Percentage of corn area by county according to times disced)
County
Times disced Acres
reported
1 2 3 4
percent percent percent percent
Webster 6 80 9 5 8171 Palo Alto 37 45 12 6 2439 Fayette 33 57 . 7 3 1588 Cedar 17 56 18 9 2514 Iowa ‘ 10 33 30 27 4213 Van Buren 19 46 26 9 1817 Mills 52 ' 43 5 — 4035 Seven-county av. 21 56 14 9 Total acreage 5163 13947 3578 2089 24777 Bushels per acre, wt. av. 38.8 37.7 38.4 41.1 Acres reported 3476 12136 2819 1715 20146
More discing is required on some fields than on others because of differences in soil types, the number and kind of weeds* etc. The land disced several times required relatively more tillage and was undoubtedly put in better physical condition with each
additional discing, but the effects on corn yields fail to appear if we compare these yields with those on land requiring only one discing.
H A R R O W IN G
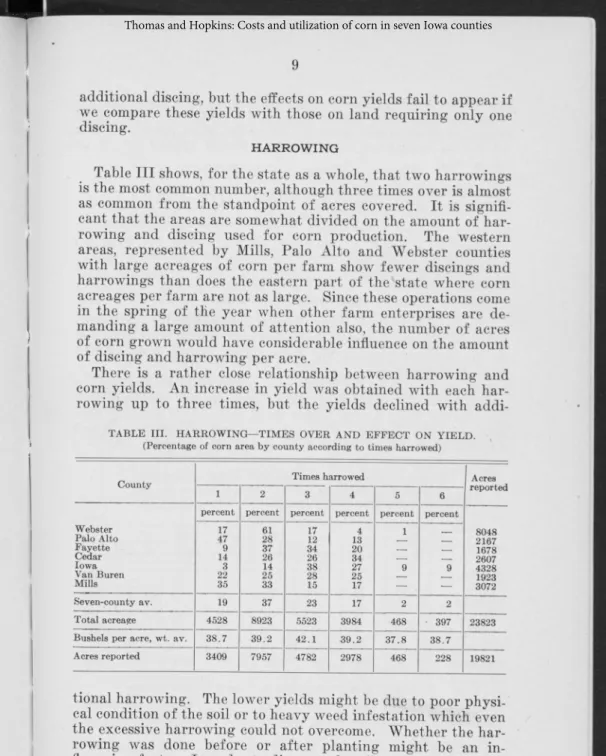
Table III shows, for the state as a whole, that two harrowings is the most common number, although three times over is almost as common from the standpoint of acres covered. It is signifi cant that the areas are somewhat divided on the amount of har
rowing and discing used for corn production. The western
areas, represented by Mills, Palo Alto and Webster counties with large acreages of corn per farm show fewer discings and harrowings than does the eastern part of the'state where corn acreages per farm are not as large. Since these operations come in the spring of the year when other farm enterprises are de manding a large amount of attention also, the number of acres of corn grown would have considerable influence on the amount of discing and harrowing per acre.
There is a rather close relationship between harrowing and corn yields. An increase in yield was obtained with each har rowing up to three times, but the yields declined with
addi-TABLE III. HARROWING— TIMES OVER AND EFFECT ON YIELD. (Percentage of corn area by county according to times harrowed)
County Times harrowed [ Acres reported
1 2 3 4 5 6
percent percent percent percent percent percent
Webster 17 61 17 4 1 8048 Palo Alto 47 28 12 13 __ 2167 Fayette 9 37 34 20 __ __ 1678 Cedar 14 26 26 34 __ __ 2607 Iowa 3 14 38 27 9 9 4328 Van Buren 22 25 28 25 1923 Mills 35 33 15 17 — . — 3072 Seven-county av. 19 37 23 17 2 2 Total acreage 4528 8923 5523 3984 468 - 397 23823 Bushels per acre, wt. av. 38.7 39.2 42.1 39.2 37.8 38.7 Acres reported 3409 7957 4782 2978 468 228 19821
tional harrowing. The lower yields might be due to poor physi cal condition of the soil or to heavy weed infestation which even the excessive harrowing could not overcome. Whether the har rowing was done before or after planting might be an in fluencing factor. In order to discover the effect the time of har rowing has on yield we have differentiated land harrowed be fore and after planting. The results, shown in table IV, indicate that three-fourths of the corn area reported was harrowed after
as well as before planting. One harrowing after planting was much more common than two. Corn yields were consistently higher in fields which were not harrowed after planting. The additional harrowing after planting would appear not to be beneficial.
TABLE IV. HARROWING—THE TIM E AND EFFECT ON YIELD.
Before planting After p [anting Times harrowed Total acreage Bushels per acre wt. av. 1 1960 45 2 962 44 3 702 49 1 7307 38 2 3135 40 D E P T H OF P L A N T IN G
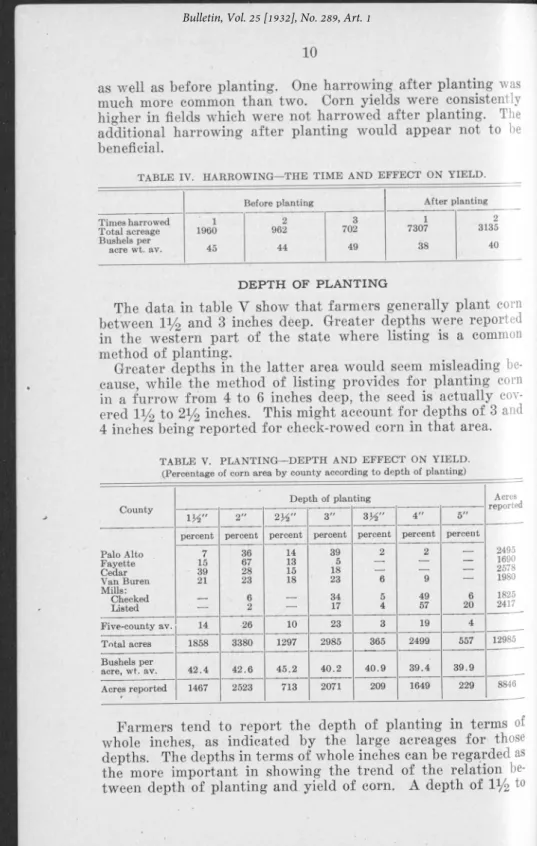
The data in table V show that farmers generally plant corn
between 1
y
2and 3 inches deep. Greater depths were reportedin the western part of the state where listing is a common method of planting.
Greater depths in the latter area would seem misleading be cause, while the method of listing provides for planting corn in a furrow from 4 to 6 inches deep, the seed is actually cov
ered 1 y2 to 2y2 inches. This might account for depths of 3 and
4 inches being reported for check-rowed corn in that area.
TABLE V. PLANTING— DEPTH AND EFFECT ON YIELD.
County
Depth of planting Acres reported W 2" 2 W 3" 3 ^ " 4" 5" Palo Alto Fayette Cedar Van Buren Mills: Checked Listed
percent percent percent percent percent percent percent 2495 1690 2578 1980 1825 2417 7 15 39 21 36 67 28 23 6 2 14 13 15 18 39 5 18 23 34 17 2 6 5 4 2 9 49 57 6 20 Five-county av. 14 26 10 23 3 19 4 ___ _ Total acres 1858 3380 1297 2985 365 2499 557 .12985 Bushels per acre, wt. av. 42.4 42.6 45.2 40.2 40.9 39.4 39.9 Acres reported 1467 2523 713 2071 209 1649 229 8846
Farmers tend to report the depth of planting in terms of whole inches, as indicated by the large acreages for those depths. The depths in terms of whole inches can be regarded as the more important in showing the trend of the relation be
2 inches would seem to be the best practice from the stand point of yields and acres covered. With the greater depths of
3 and 4 inches there is a steady decline in yield as the depth
increases.!
L IS T IN G VERSUS C H E C K IN G CORN
The greatest difference in cultural methods found was be tween check-rowing corn and listing it. The latter practice was found only in southwestern Iowa.
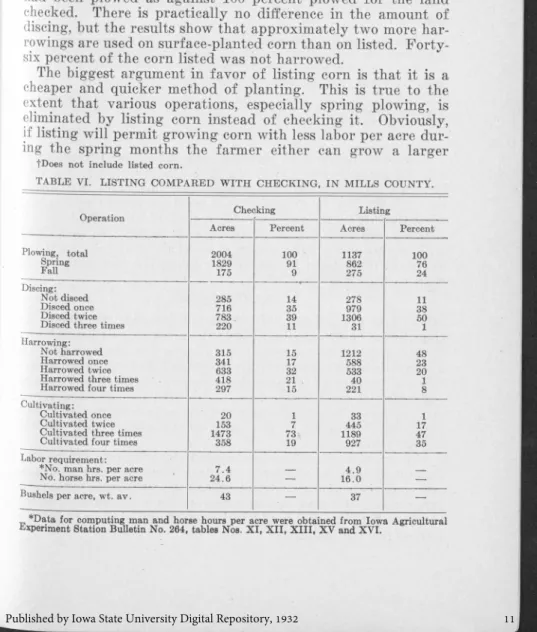
Table VI shows that 56 percent of the corn area in Mills County was listed as against 44 percent checked. In the seed bed preparation we note that only 43 percent of the land listed had been plowed as against 100 percent plowed for the land checked. There is practically no difference in the amount of discing, but the results show that approximately two more har- rowings are used on surface-planted corn than on listed. Forty- six percent of the corn listed was not harrowed.
The biggest argument in favor of listing corn is that it is a cheaper and quicker method of planting. This is true to the extent that various operations, especially spring plowing, is eliminated by listing corn instead of checking it. Obviously, if listing will permit growing corn with less labor per acre dur ing the spring months the farmer either can grow a larger
tDoes not include listed corn.
TABLE VI. LISTING COMPARED W ITH CHECKING, IN MILLS COUNTY.
Operation Che<iking Listing Acres Percent Acres Percent
Plowing, total 2004 100 1137 100 Spring 1829 91 862 76 Fall 175 9 275 24 Discing: Not disced 285 14 278 11 Disced once 716 35 979 38 Disced twice 783 39 1306 50
Disced three times 220 11 31 1
Harrowing:
Not harrowed 315 15 1212 48
Harrowed once 341 17 588 23
Harrowed twice 633 32 533 20
Harrowed three times 418 21 , 40 1
Harrowed four times 297 15 221 8
Cultivating:
Cultivated once 20 1 33 1
Cultivated twice 153 7 445 17
Cultivated three times 1473 73- 1189 47 Cultivated four times 358 19 927 35 Labor requirement:
*No. man hrs. per acre 7.4 — 4.9 __ No. horse hrs. per acre 24.6 — 16.0 — Bushels per acre, wt. av. 43 . — 37 —
acreage of corn or devote relatively more of his time to other farm enterprises at that time of year.
In calculating the labor requirements for the two methods of planting corn, we have assumed that plowing is unnecessary if the seed is listed and that two harrowings are saved by using this method. This saving in labor is partly overcome by the fact that the job of planting requires about one-third more man labor and twice as much horse labor with listing as with check ing. After considering the normal labor requirement for all operations connected with growing corn, the net saving in labor
from listing amounted to about 2y2 man hours and 8y2 horse
hours per acre. Such a saving in labor during the busy spring months means more to the farmer than these amounts would indicate.
TABLE VII. PLANTING— MAN AND HORSE LABOR PER ACRE. Checking' I Listing (Mills County)
Team, no. horses 2 3 4
Number o f rows 2 1 2
Total acres 10,567 268 1,768
Man hours per acre 0.7 | 1.5 0.9
Horse hours per acre 1.4 1
5.9 4.1
These two methods of planting corn are adapted to different soil and climatic conditions. In Mills County surface planting gave an average yield of 6 bushels per acre more than listed corn in 1927-28. The value of that many bushels of corn would more than offset the value of the amount of labor saved by list ing and suggests that such advantages as may be associated
J with listing came from growing more acres of corn, or from
devoting more time to livestock enterprises rather than the mere saving of labor..
C U L T IV A T IN G
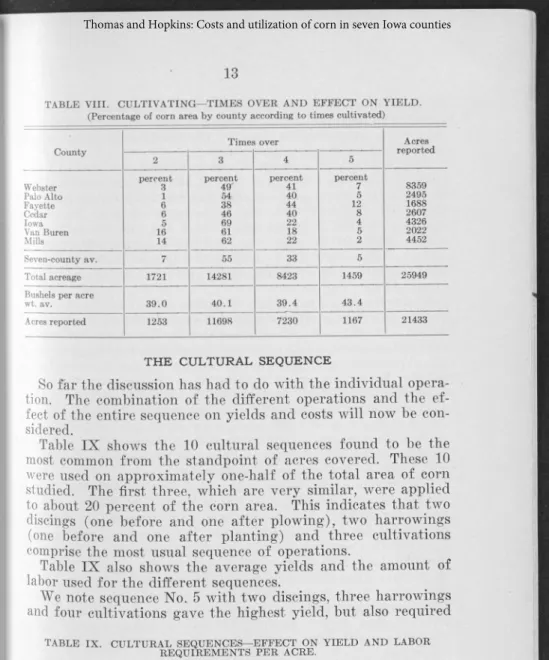
The data presented in table VIII indicate that the number of times corn is cultivated varies but little between different parts of the state. The range is from two to five cultivations, but approximately 87 percent of the corn land was cultivated either three or four times. Ninety-three percent of the corn area was cultivated at least three times in addition to one discing and one harrowing before planting and one or two harrowings after planting. This gives an indication of the cost of weed control in producing corn.
The amount of cultivation needed depends entirely on the amount of weed infestation. The data indicate that under nor mal conditions nothing is to be gained by cultivating more than three times. In some cases, however, the weed growth might be such that the crop would be benefited sufficiently to justify four or five cultivations.
TABLE VIII. CULTIVATING—TIMES OVER AND EFFECT ON YIELD. (Percentage of corn area by county according to times cultivated)
County
Times over Acres
reported
2 3 4 5
percent percent percent percent
8359 Webster 3 49" 41 7 Palo Alto 1 54 40 5 2495 Fayette 6 38 44 12 1688 Cedar 6 46 40 8 2607 Iowa 5 69 22 4 4326 Van Buren 16 61 18 5 2022 Mills 14 62 22 2 4452 Seven-county av. 7 55 33 5 Total acreage 1721 14281 8423 1459 25949 Bushels per acre
wt. av. 39.0 40.1 39.4 43.4
Acres reported 1253 11698 7230 1167 21433
T H E C U L T U R A L SEQUENCE
So far the discussion has had to do with the individual opera tion. The combination of the different operations and the ef fect of the entire sequence on yields and costs will now be con sidered.
Table IX shows the 10 cultural sequences found to be the most common from the standpoint of acres covered. These 10 were used on approximately one-half of the total area of corn studied. The first three, which are very similar, were applied to about 20 percent of the corn area. This indicates that two discings (one before and one after plowing), two harrowings (one before and one after planting) and three cultivations comprise the most usual sequence of operations.
Table IX also shows the average yields and the amount of labor used for the different sequences.
We note sequence No. 5 with two discings, three harrowings and four cultivations gave the highest yield, but also required
TABLE IX . CULTURAL SEQUENCES— EFFECT ON YIELD AND LABOR REQUIREMENTS PER ACRE.
Sequence nos.
Sequence
Total acres
Yield Per A. Labor recluirement per A. Disc.
no. Harrowno. vate, no.Culti
In bu. Rank Man hours Horse hours Rank i 2 2 3 1522 40 5 4.2 14.4 4 2 2 2 4 1341 40 5 5.0 16.8 8 3 2 1 3 1163 35 8 3.9 13.2 3 , 4 2 3 3 915 41 4 4.5 15.6 5 ■5 5 2 . 3 4 687 49 1 5.3 18.0 9 6 2 1 4 629 43 3 4.7 15.6 6 7 1 1 3 674 35 8 3.3 10.8 1 8 2 4 3 596 39 6 4.8 16.8 7 9 1 2 3 502 38 7 3.6 12.0 2 10 1 3 3 398 46 2 3.9 13.2 3
the most man and horse labor per acre. In contrast to this se quence, we observe the corn which was disced and harrowed only once (sequence No. 7) used the least labor and resulted in the lowest average yield per acre.
Judging from the amount of corn produced per hour of labor spent, it seems that sequence No. 10 was the best combination. In this particular sequence harrowing was substituted for disc ing which requires considerably more labor per acre. Too much significance should not be attached to the results of this se quence, however, because it was used on a comparatively small acreage. Sequence No. 1, used on the largest amount of corn land, ranks second when both yield and labor requirements are considered.
It may be asked why there is such a wide variation in corn yields with only a slight change in cultural sequence. The an swer is that the cultural sequence is only one of several impor tant influences on corn yields, and it would be necessary to take all of them into consideration in accounting for the variations noted. We would expect that farmers who practice thorough cultivation would also be thorough in selection and testing of seed and other things pertaining to good corn culture. In so far as this is true, the difference between an average of 35 and 49 bushels per acre might easily reflect the extremes between good and poo? corn culture and not just the amount of cultiva tion involved in the cultural sequences.
The foregoing results and discussion do not mean that there is any one cultural sequence that is best adapted to all condi tions. In deciding how many times a given operation shall be performed the farmer considers also the amount of labor avail able together with the time or period during which the work must be done, and especially the opportunity offered by other crops and livestock enterprises to return more for his labor than corn. Some farmers realize that while they are attempting to increase corn yields 1 or 2 bushels per acre by additional cul tivation, they may be running the risk of losing several times the value of the extra corn by neglecting more important work elsewhere.
THE SEASONAL LABOR REQUIREMENT OF THE CORN ENTERPRISE
The amount of labor involved in the different cultural opera tions is not the only consideration governing the importance of labor as a cost factor. Almost as important is the time of the year ^ when these operations must be performed. When they
per-formed during a relatively short period, the labor requirement becomes an important factor in determining the amount of corn that can be fitted into the farm organization.
Figure 3 shows the seasonal labor distribution in growing 40 acres of corn in Iowa County. During two periods of the year the labor requirements are high. The first period is from the first week in May until the middle of July. This includes the bulk of the work connected with seedbed preparation, the planting of the crop and its cultivation. We note that the weekly labor requirement is about 25 hours. Mills County, on a group of large farms with an average of 121 acres of corn per farm, used approximately 20 hours per 40 acres per week, while a group of Fayette County farms, with 40 acres of corn per farm, used about 40 hours per week for the same number of acres. The other groups represented ranged between these extremes. There was also some year-to-year variation in dicating the influence of the weather on the seasonal labor dis tribution. 60 50 te im m HUSKING BY HAND c u l t i v a t i n g t i i m m HARROWING A F TE R PLANTING m m m p l a n t i n g
DISCING & HABBOWING A F TE R PLOWING PLOWING
DISCING « HARROWING BEFORE PLOWING
JAN FEB MAR APRIL MAY JU N E JULY AUG SEPT OCT NOV DEC Fig. 3. Weekly distribution of labor cn typical 40 acres o f corn in Iowa County.
The second seasonal peak of labor requirement on corn is from the first part of November until the middle of December. During most of this period the weekly labor requirement be tween areas ranged from 30 to 60 hours. This is the picking season, and variations between areas were due largely to varia tions in corn yields, although differences in picking methods seem important.* Van Burén County, with an average yield of 20 bushels per acre, used only 30 hours of man labor per week as compared with between 40 and 60 hours for most of the other areas in which corn yields ranged from 35 to 40 bushels per acre. The influence of machine picking on the sea sonal requirement of labor can be seen in fig. 4.
Between the two peak seasons of labor are slack periods in which the corn enterprise does not demand a great deal of the farmer’s time. Such jobs as preparation of seed corn, hauling manure and raking stalks demand a small amount of time dur ing the late winter and spring. Field operations, discing, har rowing and plowing begin during the latter part of March and continue into April. These are followed by planting and culti vation which demand more and more labor as the season ad vances until about the middle of July, In the late summer and early fall considerable labor is spent in plowing, filling silos and cutting corn for fodder. The latter demands much labor in cer tain areas. The Northeastern
Dairy Area, in particular, harvested a large portion of the crop in that manner.
Figure 3 shows the time of the year when each cultural operation is performed in Iowa County. One might ex pect slight differences in the dates of operations between the northern and southern parts of the state, but these are differences of a few days rather than of weeks. The pe riod,'however, during which the various operations are performed was found to shift considerably with different
years because of unusual behavior of the weather. For example, in 1927 extremely heavy and frequent ráins during May delayed planting from 2 to 3 weeks, and as a result cultivating con tinued until the first week in August in some counties.
♦Machinery was used to some extent in picking corn in Mills, Palo Alto and Web ster counties. —T"1— / / A j^Hand Pickmq '// A 1 183 nochi v A " Mar p,c Illli§§ *77/ ‘¡//A yA W , 1 m i É I Y Á W , M W zirrr 5eptI Oct 1 Nov 1 Dec
Fig. 4. A comparison o f the weekly dis tribution o f man labor when picking corn by hand and with machine in Falo Alto County.
Figure 3 also shows that while the periods during which most cultural operations are performed range from 5 to 10 weeks in length, there is a shorter period of about 3 weeks when from 50 to 75 percent of the work is done. In fact, 25 percent of the work in connection with operations preparing the seedbed is performed during a single week, and almost one-third of the labor in planting comes during the week beginning May 10.
These results indicate that the different operations are very exacting in their seasonal demand on labor. Most of the work in preparing the seedbed and planting corn occurs during the first 2 weeks in May/ These operations are most effective dur ing a very short period. The timeliness of the operations be comes am important means of reducing production costs by in creasing yields when operations are performed during the opti mum time limit, and also by elimininating certain operations. For example,, three cultivations at just the right time might be just as effective as four.
COSTS OF PRODUCING CORN
The question is frequently asked, “ what does it cost to raise an acre or q bushel of corn?” A few moments reflection will show that" such a question cannot be answered satisfactorily in simple terms of dollars and cents. It is not possible to place exact valuations on some of the most important factors of cost used in corn production. Even if accurate valuation were pos sible for all cost factors for the farm as a whole, it would often be impossible*to make an exact apportionment among the inter
related farm enterprises. • <
The most important element of cost or input into the actual process of raising corn is labor. Following this in order of usual Aalue .c.omes the use of power, either horse or tractor. Next comes the use of equipment, and the value of fertilizer or manure applied to the land. The amount and value of each oi these factors tends to vary, at least to some degree, with the acreage o f corn raised on the farm. We may call them the direct or variable expenses.
There is also a second group of cost factors which are rela tively fixed and do not vary, on the owned or cash rented farm, with the amount of any individual crop produced. The princi pal fixed elements of cost are the rent of land .and the interest and depreciation on capital invested in buildings and perma nent improvements. - These are elements of cost in a quite dif ferent sense from the seed or labor used in growing the crop, tlnce having bought his farm and erected his buildings, the tanner’s problem is simply how to make the most from their use The original investment or purchase price has little to do with the subsequent use of the farm.
Table X II shows that the principal physical element of cost is labor, of which an average of 17 hours was used per acre in Iowa County, 17 in Cedar, 16 in Van Buren, 21 in Fayette, 12 in Mills and 14 in Pocahontas
and Palo Alto counties.- The average amount of horse work per acre varied from 30 to 44 hours in the various counties, but in four of the six counties was between 33 and 36 hours. V A R IA T IO N S IN COST FACTO RS B E T W E E N F A R M S A N D AREAS It was mentioned above that there is a wide variation from farm to farm in the amount of a cost factor used in growing an acre or a bushel of corn. Table X gives some conception of the variation between farms in the number of hours of la bor used in growing corn up to and including cultivation, while table X I shows similar data on labor used in picking corn. It will be noticed that there is a wide variation be tween counties. It will also be noticed in fig. 5 that there is a similar variation in each coun ty. Thus there is a typical, or modal number of hours per
acre. In four of the seven
counties represented, from 7 to 8 hours per acre were used in most of the fields. In Mills County, with larger corn acre ages, 48 percent of the fields used 5 to 6 hours per acre. In Webster County, with large fields and smooth land, 50 per cent of the fields used 5 to 6 hours per acre. In Iowa Coun ty, with more small fields and rougher land, the most com mon number of hours was from 9 to 12. Thus the
typi-H O U E S M A typi-H LABOR Fig. 5. Frequency distribution ®* the hours o f man labor in growing corn.
TABLE X . VARIATION IN LABOR USED IN GROWING CORN.
County Range Average Numberfields Bulk of cases Year Low High
Hours Hours Hours Hours Webster 1928 5.9 16.5 8.7 15 6 .1 - 1 1 .3 1929 4.5 12.1 7.3 10 5 . 1 - 9.5 Palo Alto 1927 4.7 13.9 7.5 29 5 . 4 - 9.6 1928 3.0 8.8 5.3 3 4 . 6 - 7 .0 Fayette 1927 6.7 20.8 10.8 42 8 .2 - 1 3 .4 1928 4.4 15.9 10.2 31 7 .0 - 1 3 .4 Cedar 1927 3.5 16.3 9.2 39 6 .6 - 1 1 .8 1928 4.4 15.7 8.7 31 6 .0 - 1 1 .4 Iowa 1925 6.4 15.7 11.2 23* 8 .6 - 1 3 .8 1926 6.3 15.7 11.2 22* 8 .7 - 1 3 .7 1927 7.2 18.6 10.5 18* 7 .9 -1 3 .1 Van Buren 1927 6.6 21.6 10.9 34 7 .4 - 1 4 .4 1928 3.8 18.3 9.6 26 5 .7 - 1 3 .5 Mills 1927 3.2 10.1 6.6 42 4 . 7 - 8.5 1928 3.4 10.5 6.3 42 4 . 5 - 8.1 *Number of farms.
cal labor requirement depends on the size of the field and the lay of the land as well as on other factors, and in discussing the “ average” or typical requirement one should specify the condition to which he has reference.
TABLE X I. VARIATION IN LABOR USED IN PICKING CORN. (By hand)
County Range Average Numberfields Bulk of cases Yield per acre Year ' Low High
Hours Hours Hours Hours Bushels Webster 1928 3.0 13.5 6.0 15 3 . 7 - 8.3 50.0 1929 3.2 7.3 5.4 10 4 . 1 - 6.7 47.5 Palo Alto 1927 3.1 8.3 6.6 20 4 . 3 - 8.9 41.6 1928 2.4 13.6 5.8 26 3 . 2 - 7.4 51.8 Fayette 1927 3.5 12.6 8.9 13 5 .7 -1 1 .1 42.0 1928 2.1 15.6 7.8 10 5 .1 -1 0 .5 41.9 Cedar 1927 3.2 12.3 6.7 15 4 . 4 - 9.0 42.9 1928 3.3 12.5 6.5 20 4 . 7 - 7.6 53.6 Iowa 1925 5.0 14.9 8.8 23* 5 .3 -1 2 .3 64.6 1926 3.7 13.4 7.7 22* 5 .3 -1 0 .1 56.5 1927 2.8 14.8 7.5 18* 4 .8 -1 0 .2 49.9 Van Buren 1927 3.1 12.6 5.7 14 2 . 9 - 8.5 21.9 V. 1928 4.5 10.3 7.6 6 6 . 5 - 8.9 35.6 Mills 1927 2.3 7.1 5.2 26 3 . 9 - 6.3 46.3 1928 4.2 8.1 6.3 13 5 . 0 - 7.4 53.6 "‘Number of farms.
A further examination of table X shows that deviations from the average or typical value tend to scatter out more widely towards higher than towards lower figures. Thus in Webster County the smallest amount of labor used per acre was 2.8 hours less than the average, while the greatest amount was 7.8 hours more than the average. This peculiarity may be attributed to the fact that as each cause of labor wastage is overcome there remains a smaller number of other controllable losses so that each added economy is likely to be more difficult.
T H E T O T A L COST OF P R O D U C IN G CO RN
If we pass over these variations in the amounts of the more important cost factors used in producing an acre of corn and resort to the use of averages for groups of farms, we obtain the figures shown in table XII. Here we see that labor, horse work and the use of the tractor together account for 60 to 75 percent of the total operating cost.* The use of equipment usually was about $2 per acre or slightly more. Seed usually amounted to 40 or 50 cents per acre. The charge for the use of manure, which was taken at about $2 per ton, varied widely, but general ly averaged around $3 per acre for the groups of farms, which
means that most of the land received no manure. • The total
operating cost varied from an average of $11.36 per acre in Mills County for 1927, to $19.61 for the Fayette group of farms.
In addition to the operating costs we might add a charge for the use of the land. This was taken at the rate for which the land could be rented, and of course, included tax and upkeep of fences and drains which the landlord has to pay out of his gross rent. When the land charge is added the total cost per acre amounts to a figure which varies from $17.86 in Van Buren County to $28.80 in Iowa County in 1927.
In order to obtain figures representing the cost per bushel, it is necessary to Subtract from the total cost per acre the value of stalks, which was taken arbitrarily at $1.00 per acre. The remainder may then be divided by the yield of corn to obtain the cost per bushel. It will be observed in table X II that the cost per bushel varies from 40 cents in Mills County to 77 cents in Van Buren County in 1927, and from 34 cents in Mills Coun ty to 57 cents in Fayette County in 1928. The cost per bushel is, of course, affected by the efficiency with which the corn is grown as indicated by the operating cost, by the land charge, and by the yield per acre.
If we examine fig. 6 we find in the operating cost and the
*A different rate per hour fo r man labor and horse work was used for each farm. This depended on the labor and horse expenses on each particular farm and on the estimated number o f hours o f labor or horse work used. The average labor rate was 29 eepts per ljour, and the ayergge rate for horse labor was 12 cents pep hour.
TABLE X II. SUM MARY OF COST BY COUNTIES, 1927.
Iowa Cedar Van
Buren Fayette Mills Pocahontas Palo Alto
No. farms 18 , 12 11 12 17 14
Acres raised per farm 66 46 46 25 111 57 Yield per acre, bu. 50.7 43.4 21.9 42.3 45.3 41.7 " Physical costs Labor, hrs. 16.8 17.0 16.1 20.9 12.3 14.4 ~ Horse, hrs. 36.3 42.3 34.8 44.4 30.3 33.5 -Tractor, hrs. .9 .1 1.4 .3 .5 .2 -Financial costs Seed. $ .46 .50 . 55 .56 , .43 .45 -Labor 4.78 5.02 4.57 5.93 3.88 3.98 -Horse work 4.89 4.83 3.69 4.72 4.14 3.66 -Tractor 1.06 .05 1.13 .79 .55 .30 -Equipment 2.09 2.33 2.15 2.47 1.85 2.09 -Manure 3.84 3.04 .50 4.03 .24 2.66 -Miscellaneous 2.13 .52 .31 1.11 .27 1.56 -Operating cost per A. $ 19.25 16.29 12.90 19.61 11.36 14.62 Land ^charge 7.55 6.70 4.96 6.37 7.64 6.89
Total cost p_er acre $ 26.80 22.99 17.86 25.98 19.00 21.51 Cost per bushel $ .52 .51 .77 .59 .40 .49
Summary of Costs for 1928
No. farms * 23 ** 22 12 5 6 6 17 Yield per A . 62.8 55.8 53.6 35.6 41.9 53.6 51.8 Labor, hrs. 20.0 18.5 17.7 18.4 19.5 13.0 12.9 Horse, hrs. 43.0 39.4 44.3 43.3 39.3 30.5 30.4 Operating cost per A. $18.86 20.28 ' 17.59 13.82 18.33 11.41 14.20 Cost per bu. .41 .49 .44 .50 .57 .34 .38
*Iowa County 1925. **1926.
cost per bushel the same sort of a variation that was pointed out in the amount of labor used per acre. It should be noticed that despite the different levels of the average line which is drawn across the graph for each group of farms, the same pat tern of variation is to be found in each. First a relatively small number of farms have costs considerably below the average for the group. Next a larger number varies but little from the av erage and finally on a small number of farms the costs rise con siderably above the average.. Also it will be noticed that the highest costs exceed the average by more than the lowest costs fall below it.
This same sort of a variation occurs in the cost per bushel figures. But here variation tends to be greater than in operat ing cost because the cost per bushel is affected both by effi ciency in growing the corn and also by yield. Also the average
operating cost may be low and the aver age cost per bushel high for the same county. Thus fig. 6 shows that the aver- a g e operating cost was much higher in Fayette County i n 1927 than in Van Buren County. But the cost per bushel in Van Buren County was much h i g h e r than in Fayette. A small part of the low operating c o s t f o r Van Buren County may be explained by the low yield from a wet season. The av erage yield on the Van Buren County farms was about 22 bushels as compared with 42 bushels for the Fayette farms. The. same influence caused the cost per bushel to be higher in Van Buren than in Fayette County.
Fig. 6. The variation in costs per acre and Pet bushel between fields by counties, 1928.
CH A N G E S IN PRICES AF F E C T COSTS OF PRO D UCTIO N
In discussing costs or the values of cost elements, it should be
remembered that these change with each rise or fall of prices. This is illustrated in "table XIII. In this table are shown the
average amounts of the principal cost elements used on 15
fields of corn in Cedar County in 1927. For simplicity the aver age use of tractor for one-tenth of an hour per acre was re placed by five-tenths hour of horse work.
If labor cost 30 cents per hour, the 17 hours used per acre ox corn on these farms would be worth $5.10, but at 20 cents per hour the work would be worth only $3.40. Likewise with the
higher rates given in the table the horse work would be worth
TABLE X III. INFLUENCE OF PRICES ON “ COSTS” — ILLUSTRATION OF EFFECT OF DIFFERENT RATES ON DATA FROM CEDAR COUNTY— 1927.
Principal coat factors
Average quantities used
on 15 fields
Approximate
prices of 1927 Lower rates assumed
Labor, per hr. $ .30 $ .20
Horse work, per hr. .10 .06
Seed corn, per bu. 3.00 2.00
Manure, per ton 2.00 1.50
"Costs” per acre
Labor 17.0 hours 5.10 3.40
Horse work 42.8 hours 4.28 2.57
Seed 1/6 bu. .50 .33
Manure I i4 tons 3.00 2.25
Equipment 2.00 2.00
Miscellaneous 1.00 1.00
Total operating cost 15.88 11.55
Rent of land 7.00 6.00
Total value of cost elements 22.88 17.55
Yield per acre 46 bu. 46 bu.
Value of cost elements per bu. $ .50 $ .38
the horse work would be worth only $2.57, seed 33 cents and manure $2.
If the higher values are added up, and it is assumed that the use of equipment cost $2 per acre and miscellaneous expenses $1, the total operating cost would amount to $15.88 and the total value of cost elements $22.88. This is equal to 50 cents per bushel at the average yield obtained on these farms in 1927. At the lower prices the operating costs would amount to $11.55 and the total cost to $17.55, which equals 38 cents per bushel. Thus, even where there is no dispute about the proper method of obtaining cost rates the financial costs per acre or per bushel change with each change in prices.
IN CR EASIN G T H E R E T U R N S FR O M CO RN PR O D U C TIO N Returns were increased by many different methods on the more efficient farms. These methods may be divided into two groups. The first has to do with increasing the yield obtained and thereby getting a larger return from the same outlay. The second is concerned with the actual reduction of the cost with out necessarily increasing the production.
The selection of high yielding strains of corn and the testing of seed in order to insure a good stand were important in fluences in increasing returns on many of the farms studied. Unfortunately it was not possible to obtain exact measure ments of the results of these influences. In general the same statement may be made with respect to the timely performance of the necessary operations. Doing the needed work at just the
right time seems to be one of the most important influences in obtaining a satisfactory yield at the least cost. This requires a combination of judgment and also a high degree of manager ial ability in order that the labor will be available at just the right times.
TABLE XIV. VARIATIONS IN YIELD— EFFECT ON COSTS— Î927.
Yield classification Average
yield per acre Hours labor per acre Bushels produced per hour of labor Lowest 25 percent fields 28.8 bu. 14.5 2.0 Second lowest 25 percent 37.6 bu. 14.8 2.5 Second highest 25 percent 45.4 bu. 17.1 3.7 Highest 25 percent 57.9 bu. 16.8 3.4
Tables X IV and X Y give some idea of the variations in labor costs which accompany variations in the yields. In table XIV the fields on which records were obtained in 1927 were divided into four groups with regard to the yield of corn per acre. This made 111 cases or 28 in each group. In the group which ob tained the lowest yields an average of 14.8 hours of labor was used per acre in raising the corn, and the corn production amounted to 2 bushels per hour of labor. In the group with the highest yields 16.8 hours of labor were used per acre, and 3.4 bushels of corn were raised per hour of labor. Obviously, higher costs in labor and other factors were associated with the higher yields. Also, the higher yields were obtained on better grades of land as indicated by the higher rental value placed on the land. We-cannot tell, however, just how much of the higher yield should be attributed to the better soil, how much to more work per acre, and how much to better selection of seed, or to more timely work as contrasted with a great amount of work.
In table X Y the same fields were divided into four groups in order of the amount of labor used per acre in growing and har vesting the corn. In the 28 cases where the smallest number of hours were used per acre, the yield per acre was lowest. In the
TABLE XV. VARIATION IN AMOUNT LABOR PER ACRE— 1927. EFFECT ON COSTS.
Average hours
labor per acre Av. yield per acre hour of laborBushels per Lowest 25 percent fields (least
labor per acre) 11.5 39 bu. 3.4
Second lowest 25 percent - 14.7 41 bu. 2.8 Second highest 25 percent 16.7 42 bu. 2.5 Highest 25 percent fields (most
group of farms where the greatest amount of labor was used per acre, the yield per acre was highest, but the corn production per hour of labor was lowest. In other words, the use of more labor per acre was associated with higher yields, but the in crease in yields was less than in the amount of labor used.
The second method of increasing returns from the corn crop is to economize on costs. Probably the most important single consideration here is to perform the needed labor in the most efficient manner. This means that any unnecessary work should be avoided, that the teams or tractor should be kept moving at as rapid a rate as can be maintained for the entire day with out injuring or covering up corn plants, and that there should be no unnecessary stopping. In general, all necessary work should be done in the quickest and cheapest manner possible and there should be no unnecessary work. Thus, where the land was clean, a considerable number of farmers saved both trouble and expense by cultivating their corn only twice instead of three times.
A method of increasing labor efficiency which is frequently discussed is to select the most efficient and economical equip ment. In general the larger farm implements are capable of saving a worth while amount of labor and.expense if the farm is large enough to afford them. Thus a three-bottom gang plow is capable of saving nearly a third of the labor in plowing, and a two-row or four-row cultivator should save labor in cultivat ing the crop almost in proportion to the increase in number of rows handled.
Another consideration is in obtaining the cheapest possible power to draw the implements. Thus on large farms it is often possible to reduce the cost of power by replacing one or more teams by a tractor. On smaller farms the problem is somewhat different and involves keeping no more horses than are really needed, and in getting the' fullest possible utilization of the horses kept. In promoting the use of large horse or power out fits and in eliminating unnecessary turning, large rectangular fields accomplish a worth while saving.
A few moments’ reflection will show that the four methods of reducing costs which have just meen mentioned— efficient use of labor, lhrge capacity machinery, cheap power, and large fields— apply to the entire farm and not to the individual crop. If the layout of the farm is improved in order to increase the size of the fields, this will save unnecessary turning in planting and harvesting small grains and hay as well as corn. If larger discs and plows are adopted they will reduce the costs o f pre paring the seedbed for all crops and not merely for the corn. It is only on the specialized corn equipment, the selection of seed corn, and the timeliness of operations on corn that a saving can
be made on this one crop without affecting others. This again brings us back to the fact that the corn crop is only one com ponent of a closely interrelated farm organization.
THE DISPOSITION OF CORN AND ITS RELATION TO THE LIVESTOCK SYSTEM
The previous discussion has considered lowering costs and increasing corn yields as a means of obtaining greater returns from the corn enterprise. Just as important in determining re turns from the farm is the way in which the crop is disposed ot after it has been produced. Here the farmer must decide how much of the crop to sell as grain and how much to feed on the farm to each kind of livestock.
For the state as a whole approximately 85 percent of the corn produced is fed within the state. Figure 7 shows the estimated percentage of the corn produced that was fed to livestock m 1928, by counties. A comparison of this chart with fig. 1 shows
that the percentage of corn fed to livestock is lowest w h e r e the
percentage of farm land in corn is highest and vice versa, "he
relatively low percentage of corn fed to livestock in the n o r t h
central part of the state and in Mills and Fremont counties is due to high corn production per farm. In the north central sec tion the soil surface is typically level and of such high produc tivity that the farmer finds it more profitable to devote most ot
his resources to the production of corn and small grain and less to forage crops and livestock.
As contrasted with the Cash Grain Area the southern, eastern and northeastern parts of the state feed practically all of the corn produced. In some sections additional corn is shipped in tor the livestock. The reason for this situation, as in the area just described, is to be found in the crop and livestock system as dictated by soil and climatic conditions. Much of the land in these sections is strongly rolling and is less productive than the newer soils in the western sections of the state, consequently a arger portion of the farm land is kept in hay and pasture and ess m corn. With an abundance of forage crops the livestock program tends more to the production of dairy products or of cattle. In these sections, therefore, the cattle along with the ogs consume all the corn produced, and the number needed to utilize the pasture fully may even demand more corn than is raised on many of the farms.
^^disposition of corn on a limited number of farms in Iowa and Webster counties is shown in table XYI. These farms have been classified arbitrarily according to the livestock system as based on the disposition of the corn produced. Farms on which more than 15 percent of the corn raised is fed to cattle are assed as cattle farms,” and farms on which over 20 percent ot the-gram is sold for cash are classified as “ cash grain
arms. Farms on which over 50 percent of the corn is fed to
nogs and which are not classified in either of these first groups are classified as “ hog farms.” It is significant that hogs get by farms larg6St Portlon of the corn fed to livestock on nearly all
tpIn+C? Iiipar^ng two eounties we observe that 26 percent of
tne totai production was sold for cash and 74 percent fed .to ®8. c“: m Webster County as compared with 9 and 91 per-
„ m I°wa County.* Only slight differences are noted in the
amount of corn fed to the different kinds of livestock in the v ® P°uatids In each case, 61 percent was disposed of through poultry °Ut 30 percent fed to cattle and 5 percent to horses and
farmsthe hog enterprise used approxi- mateiy three-fourths of the dbrn on hog and cash grain farms a about one-half on the cattle farms. Hogs are relatively effi- uent m the conversion of corn into meat. They do not require ugUages and only a small amount of supplementary feeds vvitn these advantages and under the normal value relation ships between corn and hogs, a very substantial portion of the
° f ff rmS iri Webster County is not typical of the county. In this re- 55 percent for the county.” y 6 percent of the corn sold for cash as compared with
TABLE XVI. PRODUCTION AND DISPOSITION OF CORN BY TYPES OF LIVESTOCK FARMS, IN WEBSTER AND IOWA COUNTIES.
General purpose cattle farms
Beef feeding
farms Hog farms Cash grain . Over 15% corn Over 15% corn Over 50% to Over 20% corn
to cattle to steers hogs, un
to c1er 15% attle SO id
Webster Iowa Webster Iowa Webster Iowa Webster Iowa 1928-29 1927 28-29 1927 28-29 1927 28-29 1927 No. of farms 4 5 8 7 10 11 13 4 214 194 215 253 175 172 173 170 Acres in corn 68 57 •81 94 60 58 82 . 62 Acres in pasture 55 54 48 55 18 53 27 45 Corn, source 3420 2468 2306 3495 3627 3284 2265 2879 Bought, bu. 68 412 1172 1016 19 385 184 268 Disposition* 74 1831 994 128 831 631 127 195
Total fed, bu. 2196 3409 4515 3974 2030 2592 2259 1663 Percent total corn fed 11 8 5 4 4 5 6 7 Cattle 24 25 8 2 10 ,7 13 29 5 6 39 31 4 4 4 2 Hogs 53 59 48 55 75 77 69 53 Poultry 10 5 1 1 6 5 7 5
♦Discrepancies between the bushels fed and sold and the amounts raised and bought are due to shrinkage, changes in carry-over from year to year and the use o f corn for seed.
annual crop ordinarily goes to hogs before other means of dis posing of the crop are given consideration. It is worthy of note, also, that on most of these farms the average amount of corn fed to hogs ranged from 1,500 to 2,000 bushels. This suggests that the size of this enterprise is rather uniform from the stand point of the amount of corn required to support it. It is the most universal enterprise of the Iowa livestock system, occupy ing an important position in nearly every farm program, but, as mentioned above, the seasonal labor requirements are such that the individual farmer usually finds it uneconomical to produce enough hogs to use all the corn produced.
The question of how to use any surplus corn not turned to hogs depends largely on the amount of other crops produced. If oats are a relatively important crop with an appreciable quantity of good quality hay and pasture, comparatively more corn will be fed to dairy and general purpose cattle. This class of livestock used about one-fourth of the corn on the‘ farms classed as “ general purpose farms.” On the other hand, if these conditions prevail, with oats a relatively unimportant crop, beef cattle will be given a larger portion. On the beef feeding farms in table XYI, this amounted to about 37 percent of the corn. On these farms where the portion of the corn crop
fed to steers was more nearly equal to that of hogs, the acreage and total production of corn was much larger than for any other group, indicating that an abundance of corn is necessary to support the feeding of beef cattle after taking care of the hog enterprise. This enterprise also seems more exacting in its requirements for a balance between the different crops and for skill in feeding and good management on the part of the farmer. For these reasons it tends to be restricted to a rela tively few farms as compared with hogs.
A minor portion of the corn is fed to horses and poultry on all these farms. The proportion fed to poultry is generally smaller on the specialized steer feeding farms and larger on the more diversified general purpose cattle farhis.
RELATIONSHIP BETWEEN CORN AND OTHER SECTIONS OF THE FARM BUSINESS
On about 200 farms from which records were obtained, it was shown that the income is more closely related to the number of bushels of corn raised than to the acres. Figure 8 shows the
ap-proximate relationship be-«0 U 3 6000 _J o O 6000 r 0 u Ü 4000 E 1 .< fc- 2000 z
° tween the amount of corn
raised and the net farm in- come. It will be noticed that the net income tends to rise more rapidly as the amount o f c o r n grown increases. Thus the farms producing 2.000 bushels of corn tended to have a net income of about $3,700, those with 4,000 bush els had net incomes of about $4,300, while those raising 6.000 bushels tended to have incomes of about $5,000. As the amount of corn raised in
-A
o o ^ S* • aJ. "-s ° 0 20 40 60 80 100 '120Total Corn Production
(Hundredsof Bushels)
Fig. 8. Relation between amount o corn produced and net farm income.
creased above about 8,000 or 9,000 bushels there seemed to be a tendency for the net income to remain constant or even to de cline.
Figure 9 shows the relationship between the amount of corn raised and the value of hogs produced in 1927 and 1928 for the group of farms discussed above. It will be noticed that the curve of relationship in this case is strikingly similar to the curve for net farm income. This is, of course, explained by the fact that the greater part of the corn raised is fed to hogs, and the greater part of the farm income on the ordinary Iowa farm comes from the sale of hogs.
Figure 10 shows that the income from the production of cattle or dairy products is definitely related to the amount of corn raised. But the increase in value of cat tle and dairy products is much more gradual than with hogs until the corn production exceeds 5,000 bushels. Thus an increase in the amount of corn raised from 2,000 to 3,000 bushels is associated with an increase in the income from hogs of
aooui wuuc tue in
come from cattle rises only about $150. As the size of the corn crop exceeds about 5,000 bushels a commercial feeding enterprise is added on a good many farms re sulting in a rapid change in
IOOOO < O o aooo o tt z ui 4000 h 0
the income frotn cattle on 5
u °
farms producing between u_ 2000
o • * °
5,000 and 7,000 bushels of 3
<
corn. * O 20 30 SO 70 «0
Co r n Pr o d u c t io n (Hundredsofdushelsi
that as the amount of corn Fig. 10. Relation between amount of
•1 u i • „ „ „ „ +1,/, -n a corn produced and value o f cattle increase. available increases, the re
turns from feeding it tend j „ j f
to decline. This is shown in fig. 11. On the g r o u p of farm
studied the returns from livestock per $100 worth of f e e d aver
aged about $150 on farms producing 1,500 bushels of corn. On those raising 3,000 bushels the returns were ap proximately $140 per $100 of feed. On farms raising 6.000 bushels of corn the re turns were slightly oyer $130, and on those raising 10.000 bushels the returns were $120 per $100 of feed. In general, the larger the feeding operations became the more difficult it was to obtain a high rate of return on the feed consumed. 8 60
l* O 20 40 00 60 IOO IZO
Co e n Pr o d u c ed ( Hu n d r e d sof 6u s h e l s)
Fig. 11. Relation between amount of corn produced and return per S100 o f feed fed.