Are Mendeley reader counts high enough for research evaluations
when articles are published?
1Mike Thelwall, University of Wolverhampton, UK.
Purpose –Mendeley reader counts have been proposed as early indicators for the impact of academic publications. In response, this article assesses whether there are enough Mendeley readers for research evaluation purposes during the month when an article is first published.
Design/methodology/approach – Average Mendeley reader counts were compared to average Scopus citation counts for 104520 articles from ten disciplines during the second half of 2016.
Findings - Articles attracted, on average, between 0.1 and 0.8 Mendeley readers per article in the month in which they first appeared in Scopus. This is about ten times more than the average Scopus citation count.
Research limitations/implications – Other subjects may use Mendeley more or less than the ten investigated here. The results are dependent on Scopus’s indexing practices, and Mendeley reader counts can be manipulated and have national and seniority biases.
Practical implications – Mendeley reader counts during the month of publication are more powerful than Scopus citations for comparing the average impacts of groups of documents but are not high enough to differentiate between the impacts of typical individual articles.
Originality/value - This is the first multi-disciplinary and systematic analysis of Mendeley reader counts from the publication month of an article.
Introduction
Academic research is evaluated for appointment, promotion, tenure, for university league tables, for national research evaluation exercises and for self-reflection purposes. Some of these use quantitative data or are supported by numerical evidence of impact. Citation counts to refereed journal articles are a common source of this quantitative data, including in the form of Journal Impact Factors (JIFs) and field normalised citation counts (Garfield, 2006; Waltman, van Eck, van Leeuwen, Visser, & van Raan, 2011; Wilsdon, et al., 2015). Citation counts are not suitable for helping to evaluate new research because articles may take three years to attract a substantial number of citations due to publication delays. For this reason, formal evaluations often use a citation window of considerable length, such as three years (Wang, 2013), which excludes newer articles from evaluations. This means that the most recent and, therefore, most relevant research cannot be evaluated with the help of most citation-based indicators because they cannot differentiate effectively between different levels of impact for individual articles.
Two solutions to this problem are to use publishing journal JIFs (or journal rankings: Kulczycki, 2017) as a proxy for citation impact or to use web-based early impact indicators. JIFs can avoid citing article publication delays if it is accepted that the average impact of a journal is an appropriate proxy for the impact of its articles (but see: Lozano, Larivière, & Gingras, 2012; and note also the time dimension: Larivière, Archambault, & Gingras, 2008)
1
Thelwall, M. (in press). Are Mendeley reader counts high enough for research evaluations when articles are published? Aslib Journal of Information Management, 69(2). doi:10.1108/AJIM-01-2017-0028
and that JIFs are stable over time (which is usually true: Thelwall & Fairclough, 2015). On this basis, say, the 2016 JIF of a journal would be a reasonable indicator for the impact of articles published in that journal in 2016 even though the 2016 JIF calculations are based solely on citations to articles published in 2014 and 2015 (Garfield, 2006). A more fine-grained alternative is to exploit a faster-growing source of impact evidence from the web for article-level indicators (Priem, Taraborelli, Groth, & Neylon, 2011; or both options can be combined: Haustein & Siebenlist, 2011). Of the various alternative indicators (altmetrics) that have been proposed, Mendeley reader counts are the most promising for early impact evidence because of their relatively high correlations with citation counts and early appearance (Zahedi, Costas, & Wouters, 2014). Although tweets may appear sooner, they are much less reliable for impact indicators (Haustein, Larivière, Thelwall, Amyot, & Peters, 2014; Thelwall, Haustein, Larivière, & Sugimoto, 2013).
Mendeley is a free social reference sharing site that allows users to register documents that they are interested in and creates reference lists for them (Gunn, 2013; Henning & Reichelt, 2008; Zaugg, West, Tateishi, & Randall, 2011). It was bought by Elsevier in 2013 (Bosano, 2013). Mendeley incorporates social features, such as the ability to connect with other members, form groups and examine other users’ libraries of registered documents. It also recommends relevant articles to its users (Beel, Gipp, Langer, & Breitinger, 2016) and supports information seeking (Alhoori & Furuta, 2011). Mendeley is public and so the number of people registering an article in the site is evidence of the impact of that article, even if the article does not have a citation count in traditional research indexes (Maleki, 2015). Since articles are usually registered by people who have read them or who intend to read them (Mohammadi, Thelwall, & Kousha, 2016) it is reasonable to consider this as evidence of readership. Nevertheless, intention to read is not the same actually reading and so it may be that a lower proportion of articles registered in Mendeley are ever read. An overwhelming majority of users register articles in order to cite them (three quarters or more in all many disciplines), but substantial minorities also use Mendeley to aid teaching and to keep track of literature (Mohammadi, Thelwall, & Kousha, 2016). Mendeley reader counts are likely to be substantial underestimates of the amount of interest in an article because presumably only a small minority of the readers of an article use Mendeley (other reference managers exist: Borrego & Fry, 2012) and people may read an article without needing to add it to their Mendeley library.
Despite the above issues, it seems reasonable to consider the presence of an article in a user’s Mendeley library as a judgement that the article is useful or interesting. Combining this with substantial evidence that Mendeley reader counts have a moderate correlation with citation counts (Aduku, Thelwall, & Kousha, 2016; Li, Thelwall, & Giustini, 2012; Schlögl, Gorraiz, Gumpenberger, Jack, & Kraker, 2014; Thelwall, & Sud, 2016) and peer review judgements (HEFCE, 2015) in most disciplines, Mendeley reader counts can be thought of as similar to citation counts, with two differences. First, Mendeley readers accrue about a year in advance of citation counts (Maflahi & Thelwall, 2016; Thelwall & Sud, 2016; see also Pooladian, & Borrego, 2016; Alperin, 2015), making them suitable for early impact evaluations. Second, Mendeley is not quality controlled and can therefore be spammed. Because of this, it should not be used for evidence in evaluations where those evaluated know the method of evaluation in advance, but would still be useful for self-evaluations (Wouters, & Costas, 2012). An additional consideration is that Mendeley readers can reflect types of impacts that are ignored by citation counts, including for interest in specific topics (Haustein & Larivière, 2014). Most Mendeley users are junior academics or postgraduates
(Mas-Bleda, Thelwall, Kousha, & Aguillo, 2014; Mohammadi, Thelwall, Haustein, & Larivière, 2015), which may bias Mendeley data in comparison to citation counts.
Although several previous studies have demonstrated that Mendeley reader counts appear before citation counts in the long term, only one has focused on the year in which an article is published to assess the value of the earliest possible impact evidence. Journals with long publication delays had much higher average reader counts for articles at their publication date but Mendeley readers tended to build up steadily after this, without a sudden increase caused by a journal issue being published (Maflahi & Thelwall, submitted). This study examined six journals in one discipline (library and information science). Other than this, there is no evidence about the Mendeley readers of an article when it is published or about disciplinary differences at this time. In theory, it is possible that articles will have readers when they are first published because of early view versions, preprint sharing as well as some from the minority of readers who browse the latest issues of journals (Tenopir, King, Edwards, & Wu, 2009).
Research Questions
Although it is known that there are disciplinary differences in the number of Mendeley readers per article and the ratio of readers to citations in the long term, it is not clear what differences exist when an article is first published, which is when it could reasonably first be used for any kind of systematic research evaluation. The research questions are therefore as follows. These build towards the overarching goal of assessing if and when Mendeley reader counts can be used for research evaluation purposes. For this goal it would be useful to assess the correlation between Scopus citations and Mendeley readers but this would need a longer term study to give useful results because almost all articles have no citations when they are first published (for the relationship between time and correlation strengths, see Fig. 1 to Fig. 6 of: Thelwall & Sud, 2016).
RQ1: Are there enough Mendeley readers for research evaluation purposes when an article is first published?
RQ2: Are there disciplinary differences in the proportion of citations per Mendeley reader when an article is first published?
Methods
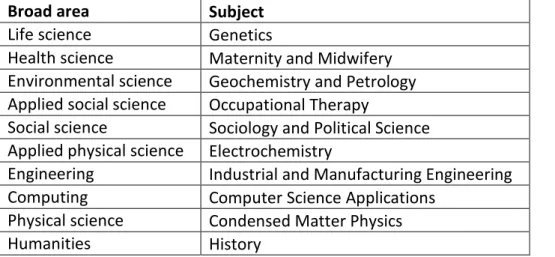
The research design was to gather Scopus citations and Mendeley readers on a range of different disciplinary areas monthly for half a year in order to assess the magnitude of both and the ratio between them. Scopus categories were used for the subject areas. These categories assign articles to a subject based on the journal that publishes them. This is an oversimplification since journals can be multidisciplinary. The categories are also designed for information retrieval rather than research evaluation but are nevertheless a widely used standard source of categorised articles. Although article level classification methods are probably more coherent (e.g., Waltman & Eck, 2012), journal-level classifications seem to be adequate given that averages are calculated across entire categories. Scopus has wider coverage than the common alternative, the Web of Science (Moed & Visser, 2008) and the ten categories were chosen to represent substantially different areas (Table 1).
Table 1. The ten Scopus subject areas analysed. Subjects are in the same order as the figures.
Broad area Subject
Life science Genetics
Health science Maternity and Midwifery Environmental science Geochemistry and Petrology Applied social science Occupational Therapy
Social science Sociology and Political Science Applied physical science Electrochemistry
Engineering Industrial and Manufacturing Engineering Computing Computer Science Applications
Physical science Condensed Matter Physics Humanities History
During the first week of every month from June to December 2016, up to 10,000 articles from each subject area with an official publication date of 2016 in Scopus were downloaded from Scopus (10,000 is a system limitation). In cases where there were more than 10,000 articles in a subject and year, the first and last 5000 from that year were downloaded to give a time-balanced set. Only documents of type article were downloaded, excluding conference papers, editorials and reviews. Also during the first week of each month, the Mendeley Applications Programming Interface (API) was queried to obtain the number of readers of each article found in Scopus. Since articles can be registered in Mendeley with or without DOIs (Digital Object Identifiers), articles were queried by title/author/year and by DOI, with all matching results combined using approximate matching (for details of the matching process, see: Thelwall & Wilson, 2016). Using double queries in this way gets more comprehensive results than either title searches or DOI searches alone (Zahedi, Haustein, & Bowman, 2014).
The first month average citation/reader count for each subject was calculated by averaging the values for all articles that did not appear the previous month. Thus, for example, there were 2461 genetics articles for month 7 (July) that had not appeared in Scopus in June (at the time of data collection) and so the month 7 genetics Scopus citation and Mendeley reader averages were calculated from these 2461 articles alone. These articles were then excluded for the remaining months (Table 2).
Since, as described above, the raw data was incomplete for subject/year combinations with over 10,000 articles, this could cause articles to be falsely identified as occurring first in a given month (for the above average calculations) because they had been published during the previous month but not returned within the sample of 10,000 articles. This would not happen in practice, however, as the following examination of the two possible cases shows.
If an article appeared in the most recent 5000 articles of month n but not for month
n-1 then it cannot have been published in month n-1 because it would also have been in the most recent 5000 for the older time period. Thus, all articles appearing in the first 5000 for month n cannot have been previously published in Scopus unless they had already been returned by a query for a previous month.
Conversely, if an article appeared in the oldest 5000 articles for any month then it should appear in the oldest 5000 articles for all months after its publication. This is
because articles in the set of 5000 oldest articles cannot be displaced by newer articles. Thus, articles from the oldest set also cannot have their month of first appearance in Scopus be falsely identified. In other words, the set of the oldest 5000 articles is a static set that does not change and would therefore contribute no new articles to any month in Table 2.
Since both citation counts and Mendeley reader counts are highly skewed, geometric means were used for the average citation and reader counts.
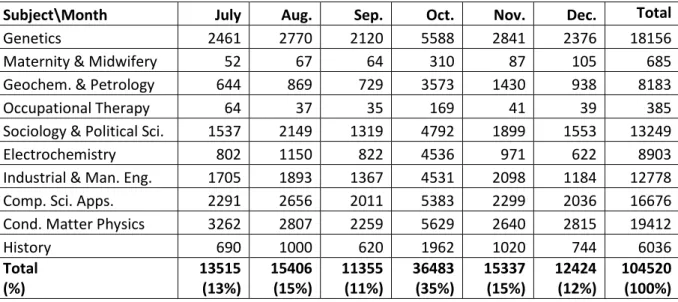
Table 2. Number of articles first appearing in Scopus in each subject in the second half of 2016.
Subject\Month July Aug. Sep. Oct. Nov. Dec. Total
Genetics 2461 2770 2120 5588 2841 2376 18156
Maternity & Midwifery 52 67 64 310 87 105 685
Geochem. & Petrology 644 869 729 3573 1430 938 8183
Occupational Therapy 64 37 35 169 41 39 385
Sociology & Political Sci. 1537 2149 1319 4792 1899 1553 13249
Electrochemistry 802 1150 822 4536 971 622 8903
Industrial & Man. Eng. 1705 1893 1367 4531 2098 1184 12778 Comp. Sci. Apps. 2291 2656 2011 5383 2299 2036 16676 Cond. Matter Physics 3262 2807 2259 5629 2640 2815 19412
History 690 1000 620 1962 1020 744 6036 Total (%) 13515 (13%) 15406 (15%) 11355 (11%) 36483 (35%) 15337 (15%) 12424 (12%) 104520 (100%)
Results
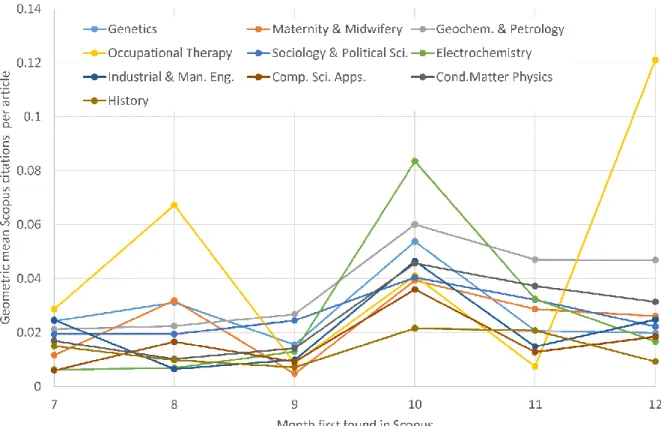
In all fields, the average number of citations per article in the month of first appearance in Scopus is 0.12 or below (Figure 1). Overall, in all fields except the smallest, Occupational Therapy, at least half of the time, this number is under 0.04. Unsurprisingly, most articles are uncited (over 96% in most fields) when they are published, confirming that citation counts are not numerous enough to differentiate between the impacts of individual articles in their publication month. This small number of citations may be due to author self-citations, pre-print sharing, editor-suggested citations and citations between articles in a themed special issue.
The relatively high average citation counts in month 10 for 9 of the 10 subjects are probably due to Scopus indexing practices since twice as many articles first appeared in October 2016 than in any other month (Table 2). This suggests that some of these articles were part of a backlog and would therefore have had longer to attract readers and citation by the time that they first appeared in Scopus.
Figure 1. The geometric mean number of Scopus citations per article in the month in which the article first appeared in Scopus, by subject category. Subjects are in descending order of value in month 12 in Figure 2.
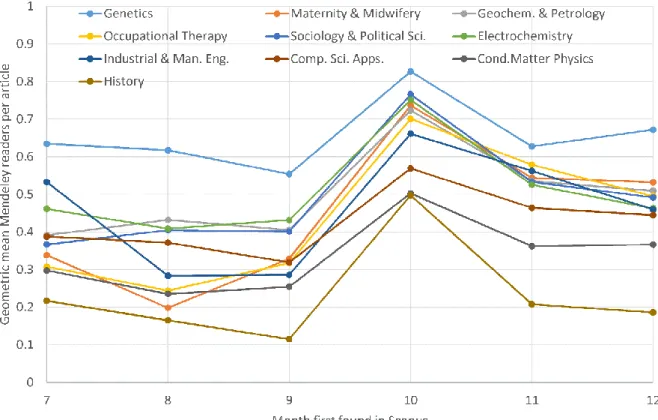
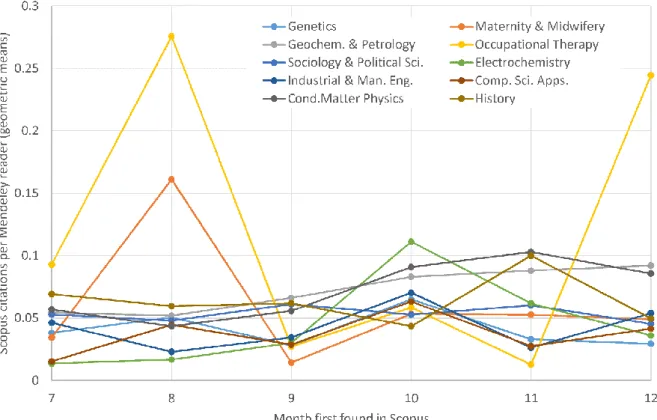
In all fields, the average number of Mendeley readers per article when they first appear in Scopus is between 0.1 and 0.8 (Figure 2). Most articles therefore have no readers when they are published, and so Mendeley reader counts are also not useful to distinguish between the average impacts of typical articles at that time. There are substantial disciplinary differences in the average number of Mendeley readers per article that are reasonably consistent between months. For example, Genetics articles have two to three times as many readers as History. Thus the discriminatory power of Mendeley readers varies greatly by discipline during the year of publication. The peak in month 10 (October) is probably caused by Scopus indexing practices, as discussed above for Figure 1.
Figure 2. The geometric mean number of Mendeley readers per article in the month in which the article first appeared in Scopus, by subject category.
Most of the time there are over ten times as many readers and citations at the publication month (Figure 3). The ratios are unstable for small disciplines due to the low numbers involved (see Table 2), however. It is not clear whether there are systematic disciplinary differences in the ratio of readers to citations. For example, Electrochemistry has the lowest ratio in months 7 and 8 but the highest in month 10. Similarly, History has the second highest ratio in two months (7 and 9) but the lowest in month 10.
Figure 3. The ratio of the Figure 1 values to the Figure 2 values. Higher values indicate more citations per Mendeley reader.
Discussion and conclusions
The results show that there are more Mendeley readers than Scopus citations per article at the month of publication but there are probably still not enough Mendeley readers for article-level evaluations, however, since the average is under 0.8 for all subjects. There are substantial disciplinary differences, with Generics having consistently the most readers per article, and history the fewest. The relatively high position of the humanities/social science field Sociology and Political Science does not suggest a science/humanities divide, however. The differences here may be due to disciplinary culture factors, such as the average publication delays for articles (longer publication delays are likely to result in higher citation counts and more Mendeley readers) as well as the uptake of Mendeley or the success of competing reference managers.
For the second research question, although there are disciplinary differences in the number of citations per reader these are not consistent over time and the results are inconclusive. Thus, the disciplinary differences in the total number of readers per article may be directly inherited from the (known) disciplinary differences in the average number of citations per article rather than Mendeley-specific factors, such as the use of reference sharing in different disciplines. A previous study of individual articles with relatively many Mendeley readers per citation and vice versa has shown that differences in uptake of Mendeley by specific communities can be an explanation, as can educational uses (Thelwall, in press). The results here suggest that these factors may not have a strong effect on the overall early readers of a paper across entire disciplines.
In terms of practical implications, academics and research evaluators seeking early evidence of the impact of academic research are much more likely to find Mendeley reader counts to be useful than Scopus citations in the publication month, but neither are large
enough to be able to differentiate between the impacts of typical articles because less than half of all articles had at least one Mendeley reader, when published. Given this finding, it is logical to seek a clear answer for the number of months to wait before the Mendeley reader counts are large enough to be useful. There is not a simple answer to this question because it requires assumptions about the purpose of an assessment as well as the number of articles examined and the degree to which they should be able to be differentiated between in terms of reader counts. For citation-based evaluations an informal rule is to wait for three years of citations for typical evaluations (e.g., Aksnes, 2003; Glanzel, 2002; Wang, Thijs, & Glänzel, 2015) and so, given that previous research has found citations to lag Mendeley readers by about a year (Thelwall & Sud, 2016), two years seems like a reasonable heuristic delay for an effective analysis at the individual publication level.
Despite the conclusions about individual articles, even averages well below 1 can be adequate when comparing the impacts of groups of articles (Thelwall, 2017a), such as to compare departments or universities. For comparing groups of articles at or close to their publication month, Mendeley reader counts are substantially more powerful than Scopus citations and this increased power may be approximately constant between disciplines. Although it cannot be directly checked from the data available, Mendeley readers at publication time seem likely to be less unusual than Scopus citations at publication time, since the latter may occur through factors such as advance notice of publication, author self-citation and special issues. This may be part of the reason that early citations are not always good predictors of long term citations (Stegehuis, Litvak, & Waltman, 2015) and so it is not clear whether the same would also be true for early Mendeley readers. Mendeley reader counts should not be used for evaluations when there is an opportunity for those evaluated to manipulate the results in advance, of course, because this is not difficult (Thelwall, 2017b; Wouters, & Costas, 2012). Mendeley-specific biasing factors should also be taken into account, such as national differences in uptake and reading patterns (Thelwall & Maflahi, 2015) and its relatively young user base (Mohammadi, Thelwall, Haustein, & Larivière, 2015).
References
Aduku, K. J., Thelwall, M., & Kousha, K. (2016). Do Mendeley reader counts reflect the scholarly impact of conference papers? An investigation of Computer Science and Engineering fields. Science and Technology Indicators STI2016. Valencia, Spain (pp. 53-59).
Aksnes, D. (2003). A macro study of self-citation. Scientometrics, 56(2), 235-246.
Alhoori, H., & Furuta, R. (2011). Understanding the dynamic scholarly research needs and behavior as applied to social reference management. In International Conference on Theory and Practice of Digital Libraries (pp. 169-178). Springer Berlin Heidelberg. Alperin, J. P. (2015). Geographic variation in social media metrics: An analysis of Latin
American journal articles. Aslib Journal of Information Management, 67(3), 289-304. Beel, J., Gipp, B., Langer, S., & Breitinger, C. (2016). Research-paper recommender systems:
a literature survey. International Journal on Digital Libraries, 17(4), 305-338.
Borrego, Á., & Fry, J. (2012). Measuring researchers’ use of scholarly information through social bookmarking data: A case study of BibSonomy. Journal of Information Science, 38(3), 297-308.
Bosano, A. (2013). Q&A: Team Mendeley Joins Elsevier. https://blog.mendeley.com/2013/04/09/qa-team-mendeley-joins-elsevier/
Garfield, E. (2006). The history and meaning of the journal impact factor. Jama, 295(1), 90-93.
Glanzel, W. (2002). Coauthorship patterns and trends in the sciences (1980-1998): A bibliometric study with implications for database indexing and search strategies. Library trends, 50(3), 461-473.
Gunn, W. (2013). Social signals reflect academic impact: What it means when a scholar adds a paper to Mendeley. Information Standards Quarterly, 25(2), 33-39.
Henning, V., & Reichelt, J. (2008). Mendeley - A Last.fm for research? In IEEE Fourth International Conference on eScience (eScience'08). Los Alamitos, CA: IEEE Press (pp. 327-328).
Haustein, S., Larivière, V., Thelwall, M., Amyot, D., & Peters, I. (2014). Tweets vs. Mendeley readers: How do these two social media metrics differ? IT-Information Technology, 56(5), 207-215.
Haustein, S., & Larivière, V. (2014). A multidimensional analysis of Aslib proceedings–using everything but the impact factor. Aslib Journal of Information Management, 66(4), 358-380.
Haustein, S., & Siebenlist, T. (2011). Applying social bookmarking data to evaluate journal usage. Journal of Informetrics, 5(3), 446–457.
HEFCE (2015). The metric tide: Correlation analysis of REF2014 scores and metrics. Supplementary Report II to the Independent review of the role of metrics in research assessment and management. Bristol, UK: Hefce.
http://www.hefce.ac.uk/pubs/rereports/Year/2015/metrictide/Title,104463,en.html
Kulczycki, E. (2017). Assessing publications through a bibliometric indicator: The case of comprehensive evaluation of scientific units in Poland. Research Evaluation, 26(1), 41-52. doi:10.1093/reseval/rvw023.
Larivière, V., Archambault, É., & Gingras, Y. (2008). Long‐term variations in the aging of scientific literature: From exponential growth to steady‐state science (1900–2004). Journal of the American Society for Information Science and technology, 59(2), 288-296.
Li, X., Thelwall, M., & Giustini, D. (2012). Validating online reference managers for scholarly impact measurement, Scientometrics, 91(2), 461-471.
Lozano, G. A., Larivière, V., & Gingras, Y. (2012). The weakening relationship between the impact factor and papers' citations in the digital age. Journal of the Association for Information Science and Technology, 63(11), 2140-2145.
Maflahi, N. & Thelwall, M. (2016). When are readership counts as useful as citation counts? Scopus versus Mendeley for LIS journals. Journal of the Association for Information Science and Technology, 67(1), 191-199.
Maflahi, N. & Thelwall, M. (submitted). How quickly do publications get read? The evolution of Mendeley reader counts for new articles.
Maleki, A. (2015). Mendeley readership impact of academic articles of Iran. In Proceedings of the Society for Scientometrics and Informetrics (ISSI2015). Boğaziçi University Printhouse: Istanbul, Turkey (pp. 109-110)
Mas-Bleda, A., Thelwall, M., Kousha, K. & Aguillo, I.F. (2014). Do highly cited researchers successfully use the Social Web? Scientometrics, 101(1), 337-356.
Moed, H. F., & Visser, M. S. (2008). Appraisal of citation data sources. Centre for Science and Technology Studies, Leiden University. Retrieved November 29, 2014, from
http://www.hefce.ac.uk/media/hefce/content/pubs/indirreports/2008/missing/Appra isa l%20of%20Citation%20Data%20Sources.pdf
Mohammadi, E., Thelwall, M., Haustein, S., & Larivière, V. (2015). Who reads research articles? An altmetrics analysis of Mendeley user categories. Journal of the Association for Information Science and Technology, 66(9), 1832-1846. DOI: 10.1002/asi.23286 Mohammadi, E., Thelwall, M. & Kousha, K. (2016). Can Mendeley bookmarks reflect
readership? A survey of user motivations. Journal of the Association for Information Science and Technology. 67(5), 1198-1209. doi:10.1002/asi.23477
Pooladian, A., & Borrego, Á. (2016). A longitudinal study of the bookmarking of library and information science literature in Mendeley. Journal of Informetrics, 10(4), 1135-1142. Priem, J., Taraborelli, D., Groth, P., & Neylon, C. (2011). Altmetrics: A manifesto.
http://altmetrics.org/manifesto.
Schlögl, C., Gorraiz, J., Gumpenberger, C., Jack, K., & Kraker, P. (2014). Comparison of downloads, citations and readership data for two information systems journals. Scientometrics, 101(2), 1113-1128.
Stegehuis, C., Litvak, N., & Waltman, L. (2015). Predicting the long-term citation impact of recent publications. Journal of Informetrics, 9(3), 642-657.
Tenopir, C., King, D. W., Edwards, S., & Wu, L. (2009). Electronic journals and changes in scholarly article seeking and reading patterns. In ASLIB Proceedings, 61(1), 5-32. Thelwall, M. & Fairclough, R. (2015). Geometric journal impact factors correcting for
individual highly cited articles. Journal of Informetrics, 9(2),263–272.
Thelwall, M., Haustein, S., Larivière, V. & Sugimoto, C. (2013). Do altmetrics work? Twitter and ten other candidates. PLOS ONE, 8(5), e64841. doi:10.1371/journal.pone.0064841 Thelwall, M. & Maflahi, N. (2015). Are scholarly articles disproportionately read in their own country? An analysis of Mendeley readers. Journal of the Association for Information Science and Technology, 66(6), 1124–1135. doi:10.1002/asi.23252
Thelwall, M. & Sud, P. (2016). Mendeley readership counts: An investigation of temporal and disciplinary differences. Journal of the Association for Information Science and Technology, 57(6), 3036-3050. doi:10.1002/asi.2355
Thelwall, M. & Wilson, P. (2016). Mendeley readership altmetrics for medical articles: An analysis of 45 fields, Journal of the Association for Information Science and Technology, 67(8), 1962-1972. doi:10.1002/asi.23501
Thelwall, M. (2017a). Three practical field normalised alternative indicator formulae for research evaluation. Journal of Informetrics, 11(1), 128–151. 10.1016/j.joi.2016.12.002
Thelwall, M. (2017b). Web indicators for research evaluation: A practical guide. San Rafael, CA: Morgan & Claypool.
Thelwall, M. (in press). Why do papers have many Mendeley readers but few Scopus-indexed citations and vice versa? Journal of Librarianship & Information Science. Waltman, L., van Eck, N. J., van Leeuwen, T. N., Visser, M. S., & van Raan, A. F. (2011).
Towards a new crown indicator: An empirical analysis. Scientometrics, 87(3), 467-481. Waltman, L., & Eck, N. J. (2012). A new methodology for constructing a publication‐level
classification system of science. Journal of the American Society for Information Science and Technology, 63(12), 2378-2392.
Wang, J. (2013). Citation time window choice for research impact evaluation. Scientometrics, 94(3), 851-872.
Wang, L., Thijs, B., & Glänzel, W. (2015). Characteristics of international collaboration in sport sciences publications and its influence on citation impact. Scientometrics, 105(2), 843-862.
Wilsdon, J. et al. (2015). The Metric Tide: Report of the Independent Review of the Role of Metrics in Research Assessment and Management. http://www.hefce.ac.uk/pubs/rereports/Year/2015/metrictide/Title,104463,en.html Wouters, P., & Costas, R. (2012). Users, narcissism and control: tracking the impact of
scholarly publications in the 21st century. In: E. Archambault, Y. Gingras, V. Larivière (Eds) Proceedings of the 17th International Conference on Science and Technology Indicators. Montreal: Science-Metrix and OST (Vol. 2, pp. 487-497).
Zaugg, H., West, R. E., Tateishi, I., & Randall, D. L. (2011). Mendeley: Creating communities of scholarly inquiry through research collaboration. TechTrends, 55(1), 32-36.
Zahedi, Z., Costas, R., & Wouters, P. (2014). How well developed are altmetrics? A crossdisciplinary analysis of the presence of ‘alternative metrics’ in scientific publications. Scientometrics, 101(2), 1491-1513.
Zahedi, Z., Haustein, S. & Bowman, T (2014). Exploring data quality and retrieval strategies for Mendeley reader counts. Presentation at SIGMET Metrics 2014 workshop, 5 November 2014. Available: http://www.slideshare.net/StefanieHaustein/sigme-tworkshop-asist2014