M
M
A
A
R
R
S
S
H
H
A
A
L
L
L
L
I
I
A
A
N
N
A
A
G
G
G
G
L
L
O
O
M
M
E
E
R
R
A
A
T
T
I
I
O
O
N
N
E
E
C
C
O
O
N
N
O
O
M
M
I
I
E
E
S
S
A
A
N
N
D
D
E
E
N
N
T
T
R
R
E
E
P
P
R
R
E
E
N
N
E
E
U
U
R
R
S
S
H
H
I
I
P
P
:
:
T
T
H
H
E
E
S
S
P
P
A
A
N
N
I
I
S
S
H
H
C
C
A
A
S
S
E
E
R
R
OOBBEERRTTOOD
D
OOPPEESSOOF
F
EERRNNÁÁNNDDEEZZ**Department of Applied Economics Universitat Autonoma de Barcelona
roberto.dopeso@uab.cat
This paper analyzes to what extent marshallian agglomeration economies affect the creation of new entrepreneurial ventures at the metropolitan level. The measuring of agglomeration economies is based on the construction of indexes using the methodology of Glaeser and Kerr (2009). The indexes attempt to capture the effects of resource sharing, labor matching and knowledge spillovers according to the taxonomy proposed by Marshall (1920). Also an index to measure the influence of small suppliers to attract new business ventures, following Chinitz (1961), is constructed. Data on new firms and employment generated is accounted for the period 2000-2008. The analysis is based on the activity of the 15 largest metropolitan areas in Spain. Sixty two-digit industries (CNAE-93) are considered. The results show that jobs created by entrepreneurs are highly influenced by the ability to share suppliers and customers. Firm creation is influenced by those factors as well as the presence of small suppliers and the proximity to innovative activity. Agglomeration indexes with sector and city fixed effects explain more than 90% of new entry and employment generated. The potential multicollinearity among indexes is tested using principal component analysis. This analysis shows some complementarities among the indexes. New regressions using the factorized terms show that traditional measures of localization economies hide specific information about the process of agglomeration.
1
1
.
.
I
I
NNTTRROODDUUCCTTIIOONNDuring the last century concentration of activity has been evident with a mass migration to cities. A large percentage of the activity occurs around the cities. In the Spanish case, the five largest cities account for 35% of population and 38% of total employment (Boix and Veneri, 2008). The effects of agglomeration cause that new ventures will be close to the old ones. This shows the need to measure the impact of agglomeration for policy implications.
* The author is grateful with Jose Luis Roig for his valuable comments and advice as thesis supervisor. This
research is supported by the Secretary of Universities and Research (SUR) of the Department of Economics and Scientific Knowledge of the Generalitat de Catalunya and the European Social Fund. Support given by the grant ECO2009-10003 of the Spanish Ministery of S cience and Innovation and the grant SGR2009-600 of the Catalonian Government is also acknowledged.
During the past 30 years a renewed interest about entrepreneurial activity has been shown but there is still much scope to cover. The Spanish case is particularly interesting because the need for greater international competitiveness could have its engine in entrepreneurship. Despite this, evidence shows that the majority of new Spanish firms are in low skill sectors, mainly building industry and real estate services.
The aim of this work is double. It contributes to the large literature of agglomeration economies and also the new but increasing literature on entrepreneurs. With respect to agglomeration economies the research constructs indexes that capture the essence of the advantages of agglomeration first proposed by Marshall in 1890. Another important feature is to add richness to the industrial analysis, especially by incorporating the service sector. This sector has received little attention in the literature (as compared to manufacturing) despite it concentrates more than 60% of economic activity with an increasing trend over the past 10 years according to INE (Spanish National Institute of Statistics) data for the Spanish economy. The analysis of entrepreneurs is part of this work as the fundamental dependent variable. The purpose it is to explain their location behavior through the determinants of agglomeration economies in the largest 15 metropolitan areas in Spain. These cities collect 51% of the population and 53% of jobs in Spain according to 2001 census data. The importance of entrepreneurs is also present in this work by testing the Chinitz (1961) hypothesis. This hypothesis states the importance of small suppliers and entrepreneurs as integral part for the business dynamism of a city.
The methodology follows the work by Glaeser and Kerr (2009) for the manufacturing sector in the United States. Regressions were estimated by ordinary least squares using fixed effects for sectors and cities. To solve endogeneity concerns an estimation based on natural cost advantages (Ellison and Glaeser, 1999) was used with little success for the Spanish case. Evidence suggests that Marshallian agglomeration economies (especially sharing with customers and knowledge spillovers) and the presence of small suppliers are significant for entrepreneurial activity. Principal component analysis was used to test co-dependencies between indexes employed to measure Marshallian agglomeration economies.
The rest of the paper is organized as follows. Section 2 presents the relevant literature concerning the study of entrepreneurs and the agglomeration economies. Section 3 presents the measuring problem, the dataset and the construction of the indexes. Section 4 presents the model. In section 5 the main econometric results are presented and discussed. In section 6 the conclusion is presented with a summary, complications arisen and future lines of research.
2
2
.
.
B
B
AACCKKGGRROOUUNNDDThis section presents the relevant literature on the subject. The review is organized in four sub-sections. The first discusses some general information about the Spanish market structure and firm births. The second shows the progress made on the literature of the entrepreneurs. The third analyzes the developments made in the measurement of agglomeration economies with particular emphasis on Marshallian agglomeration economies. The fourth shows the related empirical research.
2
2..11..SSTTAATTEEOOFFEENNTTRREEPPRREENNEEUURRSSHHIIPPIINNSSPPAAIINN
Before examining the theoretical background it is relevant to know the general status of entrepreneurship in Spain. The tool for such purpose will be the DIRCE1database elaborated
by INE. Entrepreneurship is measured by patterns of firm entry. This database allows not only quantifying the number of births but also entry size, geographical and industrial composition. Within the industrial composition these sectors are excluded: agricultural activities, livestock, fisheries, public administration, activities of households as employers and activities of extraterritorial organizations and bodies.
Table 1 shows the most relevant data of DIRCE database for the period 2000-2008. In the first column the mean and standard deviation of new companies are presented while the second column shows the data for all enterprises. As we can see new entrants account 12% of total companies. It is worth noting the strong self-employment in Spain; it represents over 70% of new initiatives and more than half of the established companies. This is reflected in the large gap between the per company employees for new businesses (1.16) and established ones (6.10). The Building and Other Services sectors show a greater participation among the new companies compared with established firms. This phenomenon is consistent with the Spanish property boom (18% of Other Services sector entrants concentrates on sector 70, real estate activities) leading to a rise in firm births that have been short lived and are now forced to close. The geographical structure of the Autonomous Communities (NUTS-2) shows that approximately 60% of new entrants are concentrated in the four main geographical areas. These geographical areas represent 58% of the population so a weak agglomeration effect is present. This research includes the main cities in these areas to corroborate these findings.
1
Mean S.D. Mean S.D. Mean annual counts 347,536.22 36,611.60 2,967,141.00 301,664.93 Mean annual employees 430,931.67 29,130.66 18,098,202.78 1,759,698.44
Mean annual Employees per Firm 1.24 0.20 6.10 0.15
By size No Employees 71.78% 8.21% 51.91% 4.36% 1-5 Employees 23.99% 1.76% 37.34% 4.76% 6-9 Employees 2.30% 0.12% 4.74% 0.57% 10-19 Employees 1.27% 0.07% 3.29% 0.32% +20 Employees 0.65% 0.08% 2.72% 0.27% By Sector Mining 0.05% 0.01% 0.10% 0.00% Manufacturing 5.07% 0.66% 8.01% 0.12% Energy 0.30% 0.32% 0.16% 0.08% Construction 17.47% 3.23% 13.29% 2.53% Comerce 23.40% 0.71% 27.65% 0.75%
Accommodation and Food Service 10.78% 0.42% 9.31% 0.36%
Transport 5.08% 0.48% 7.88% 0.26%
Rest of Services 37.85% 6.63% 33.60% 6.34%
By Region
Andalucía 16.45% 2.34% 14.99% 1.84%
Aragón 2.60% 0.43% 2.89% 0.21%
Asturias (Principado de) 2.11% 0.48% 2.27% 0.13%
Balears (Illes) 3.05% 0.49% 2.75% 0.31% Canarias 4.47% 0.50% 4.16% 0.46% Cantabria 1.09% 0.18% 1.20% 0.10% Castilla y León 4.32% 0.48% 5.31% 0.33% Castilla - La Mancha 3.82% 0.65% 3.88% 0.48% Cataluña 18.20% 3.05% 18.55% 1.64% Comunitat Valenciana 11.56% 1.83% 10.80% 1.26% Extremadura 2.10% 0.46% 1.97% 0.24% Galicia 5.37% 0.48% 6.12% 0.49%
Madrid (Comunidad de) 15.02% 1.93% 14.71% 1.90%
Murcia (Región de) 3.12% 0.58% 2.78% 0.40%
Navarra (Comunidad Foral de) 1.45% 0.34% 1.33% 0.12%
País Vasco 4.42% 0.42% 5.33% 0.26%
Rioja (La) 0.64% 0.09% 0.71% 0.06%
Ceuta y Melilla 0.23% 0.01% 0.24% 0.01%
Source: DIRCE database
Table 1
Entrepreneurship activity descriptive statistics by DIRCE (2000 - 2008)
New Entry Total Enterprises
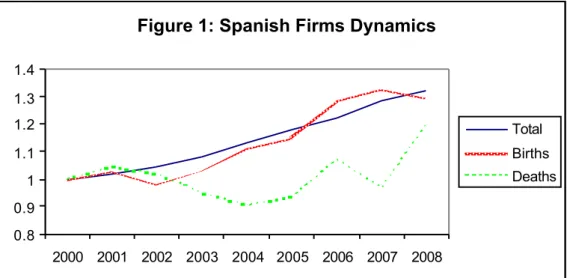
The above analysis is an interesting snapshot of entrepreneurship in Spain but a closer look to data will help us to understand the dynamics of entrepreneurial activity. Figure 1 shows the differences between growth rates for births, deaths and all enterprises. Data is normalized with respect to the first period. Although all series show an increasing trend differences in volatility are quite evident. Total number of firms grew by 32% during the period. Firm births show a similar trend but are more volatile and negatively affected by periods of uncertainty. Firm deaths have been reduced at the beginning of the period but uncertainty between 2006 and 2008 has altered their behavior. Firm deaths show a very step increase as a result of economic turmoil.
Figure 1: Spanish Firms Dynamics 0.8 0.9 1 1.1 1.2 1.3 1.4 2000 2001 2002 2003 2004 2005 2006 2007 2008 Total Births Deaths
Figure 2 shows the evolution of firm births by industry. The manufacturing industry has been gradually losing importance, accounting for 6% of total births at the beginning of the period and only 4% in 2008. Despite its relative decreasing tendency, the industrial sector is the only that presented entrepreneurial growth during the economic recession. The number of births in the building industry has grown by 47% over the period. Building industry has grown 24% with respect the other sectors. It is important to notice that the crisis in the building sector has begun to quickly erode these figures. The service sector represents over 75% of all new businesses. Service industry decline at the beginning and end of the period but show a general upward trend.
Figure 2: Births by sectors
0.75 0.85 0.95 1.05 1.15 1.25 1.35 1.45 1.55 1.65 2000 2001 2002 2003 2004 2005 2006 2007 2008 Industry Construction Services
Figure 3 displays the evolution of new companies by size. The case of self-employment again draws attention. Its high volatility seems to be the main cause of the unstable behavior observed in Figure 1. Firm births of 1-5 and 6-9 have a very similar
behavior. During the first half of the period they appear to take participation out of self-employment but since 2005 this trend was reversed. Companies with 10 to 19 employees have remained around the average for the period. Entrepreneurship in companies with more than 20 employees has been declining steadily during the period.
Figure 3: Births by size
0.65 0.75 0.85 0.95 1.05 1.15 1.25 2000 2001 2002 2003 2004 2005 2006 2007 2008 No employees 1-5 employees 1-5 employees 1-5 employees 1-5 employees 2 2..22..EENNTTRREEPPRREENNEEUURRSSIINNEECCOONNOOMMIICCTHTHEEOORRYY
The study of entrepreneurs is far from being a novelty in the economy. In 1755 Richard Cantillon in his "Essai sur la nature du commerce en général" recognizes the entrepreneur as the agent who takes risks for profit unlike the land-owners or workers who receive fixed-rents as a result of their endowments. In economic terms Cantillon defined the entrepreneur as an arbitrator (Iversen et. al. 2008). The entrepreneur solves frictions and matches supply and demand. The English school takes the "entrepreneur” concept from the French school but translated its meaning as "adventurous ", "glider" or "director ". Adam Smith concept of entrepreneur was not distinguishable from the company owner (Hébert and Link, 2006).
Alfred Marshall reconciles both views. The entrepreneur is both risk taker and administrator. He defines entrepreneur as the responsible of moving the production possibility frontier of the company, identifying opportunities, reducing costs and thereby increasing production. Marshall also made a distinction between entrepreneurs in two categories: the actives "those who opened or improved ways of doing business" and the passives "those who follow existing roads" (Marshall, 1920, p597). Other relevant theorists2 have addressed the issue but never found a way to formulate it explicitly.
2See for example the work of David Ricardo, John Stuart Mills, Jean Baptiste Say or the German school
It was in the last two decades of the twentieth century that the entrepreneur started to be treated explicitly in economic conventional models. Baumol noted the lack of treatment of the subject among his colleagues in a dramatic way "The Theoretical firm is entrepreneurless-the Prince of Denmark has-been expunged from entrepreneurless-the discussion of Hamlet" (Baumol, 1968, p. 66) and urged to incorporate the influence of these agents in the economic models. In the first models developed the agents differ in their "entrepreneurial ability". This variable entered into the cost function (Jovanovic, 1982; Brock and Evans, 1985) or in the production function (Evans and Jovanovic, 1989; Holmes and Schmitz, 1990). Although these first attempts were very important for the development of a more complete theory of the entrepreneurial phenomenon they had some problems. Most of them used the number of self-employed which is not the best measure of entrepreneurship (Acs and Szerb, 2009), but laid the groundwork for the emergence of a large number of papers and journals interested in the subject.
2
2..33..AAGGGGLLOOMMEERRAATTIIOONNEECCOONNOOMMIIEESS
It is impossible to find a plausible explanation for the organization of the population around large urban centers that has occurred in the last 150 years without considering some form of agglomeration economies or increasing returns to scale (Duranton and Puga, 2004). It is this mystery that has led to the growth of a large literature that tries to explain this phenomenon. This literature can be framed into three main areas. The new economic geography developed from Krugman’s (1991) work that focuses on the importance of space, transport costs and analytical theoretical models for study (see Fujita, Krugman and Venables, 1999). Regional economics is the study of the economic similarities and differences between different geographical areas (see Rosenthal and Strange, 2001). Finally Urban economics focuses on the analysis of economic activity and development within cities (see Rosenthal and Strange, 2003).
Usually economies of agglomeration refer to the phenomenon of increasing returns as a result of the accumulation of resources in a geographic location. The concept of agglomeration is attributed to the seminal works of Marshall and Weber. Tow main forms of agglomeration can be distinguished: (1) Urbanization economies resulting from the accumulation of population at one point are generally related with Jacobs (1970); and (2) Localization economies those resulting from the accumulation of a specific industry or sector first developed by Marshall (1920). It is important to recognize that these agglomeration economies are also external (exogenous to individuals whether they are agents or firms). External agglomeration economies are divided into three categories depending on whether
they come from interactions in labor markets, the links with suppliers and costumers, and those from knowledge spillovers according to the taxonomy proposed by Marshall (1920). This is why they are called Marshallian agglomeration economies throughout this work. Although first proposed by Marshall the concept of Marshallian agglomeration economies in this paper is more related with the micro-foundations of urban agglomeration economies developed by Duranton and Puga (2004) under the headings sharing, matching and learning. Another possibility for increasing returns is given by the sharing of suppliers and clients in line with the concepts of "forward linkage" and "backward linkages" of the new economic geography.
2
2..44..EEMMPPIIRRIICCAALLEVEVIIDDEENNCCEE
The importance of entrepreneurs to influence the composition and activity of urban areas was noted by Chinitz (1961). He highlighted the importance of small suppliers to explain the differences that existed in the development of New York and Pittsburgh in the United States. A city with smaller enterprises will have more entrepreneurs per unit of production than an oligopolistic one. A feedback effect exists so entrepreneurs are grouped into those areas that are most conducive to their development. If the entrepreneurs are located in intermediate industries the flow of entrepreneurship will be spread to other industries. This makes such cities more dynamic and adaptable because the detection of opportunities is more diversified.
A good starting point to understand the effects of agglomeration in new ventures is the work by Rosenthal and Strange (2003). They used a rich database to test the effects of urban and localization economies at the Zip Code level for the United States. Their findings support the existence of localization economies. A later work (Rosenthal and Strange; 2005) used the same methodology focusing on a metropolitan area (New York). The number of establishments with three years or less and employment generated by these establishments are used as dependent variable. The geographical scope is very specific at census tract level. A Tobit model is used. They control for urbanization and localization economies as total number o workers at different distances form the census tract centroid. Their results show significative effects for both forms of agglomeration economies but the magnitudes diminish3 strongly as
the distance from centroids increases.
For the Spanish case there are a number of studies that allow us to analyze the effect and extent of agglomeration economies. Holl (2004) conducted a study to measure the impact
3 For the Wholesale Trade and Business Services sector the localization economies effect increases instead of
of new road infrastructure in Spain. Ten manufacturing sectors where analyzed. Population (urbanization economies) as well as indexes of specialization (localization economies) where used as controls. Her results show positive and significant economies of urbanization. The evidence on economies of localization is more diverse since positive, negative and non significant effects are present depending on the industry. Arauzo (2004) study the determinants of manufacturing location in Catalonia. He finds a positive significant effect for economies of urbanization, a significant negative effect of diseconomies4of urbanization and
a significant negative effect for economies of localization. Both studies are interesting because measure the impact of agglomeration economies in Spain but they only focus on the manufacturing sector.
Some evidence with respect Marshallian agglomeration economies in the literature is more indirect. Sharing can be inferred by the work of Holmes (1999). His work shows that outsourcing increases with the concentration level of industries. Helsley and Strange (1990) found evidence of labour matching. Their work shows the relation between the agglomeration of employment and enterprises. Another evidence of labor matching can be found in the paper by Costa and Kahn (2001). They show that “Power Couples”5 tend to locate with more
probability in big cities to solve problems of job search. Glaeser and Mare (2001) demonstrate that workers in cities earn bigger salaries. But it is not clear if the reason is market coordination. Matching for the case of Spain can be inferred from the work of Arauzo et. al. (2009). They show a positive relation between employment formation and the concentration of one year old new ventures. The evidence support the effect of entrepreneurship in labor creation but the matching relation is not clear. The extensive literature on entrepreneurship and innovation give more evidence for the learning effect. Audretsch and Feldman (1996) find that innovations are concentrated spatially and innovative industries are concentrated geographically. Using a Cobb-Douglas framework for German Kreise Kilbach and Audretsch (2004) show that entrepreneurial capital fosters productivity. In Spain, Segarra (2007) gives evidence that Catalonian companies benefit form R&D spillovers concentrating geographically in the manufacturing sector. This spillover effect is negative for high-tech companies highlighting that for some knowledge-intensive services the scope of learning can be extended beyond greater geographical areas so agglomeration is discouraged.
4 The diseconomies of urbanization are measured as the square of the urbanization economies (workers per
square kilometer)
5
The first attempt to measure directly and jointly Marshallian agglomeration economies can be found in the work of Rosenthal and Strange (2001). They use as dependent variables the concentration indexes proposed by Ellison and Glaeser (1997) for the manufacturing industry. They also calculate the influence at country, state and zip code level. To capture sharing they use the proportion of manufactured and non manufactured inputs divided by unitary transport costs. Matching is calculated using three proxies of labor: productivity, the ratio of management to production workers and the educative level. To measure the knowledge spillovers they use the number of innovations. Matching is positive related with agglomeration at the three geographical levels. Knowledge spillovers are only significant at the zip code level. Finally input matching is only significant at the state level.
Ellison et. al. (2010) made a first attempt to use indexes to measure Marshallian agglomeration economies. In their study the dependent variable is the rate of co-agglomeration of industries based on Ellison and Glaeser (1997). They measured the sharing effect using the proportions of the Input-Output6 matrix for the case of United States and
Britain for each manufacturing industry. Labor matching is calculated as the correlation between proportions of each occupation between industries. Knowledge spillovers are accounted by technology flows7 among industries, as well as flows of patent citations. The
overall results show positive evidence of the three Marshallian agglomeration economies, especially the relationships with suppliers and customers. This work is extremely interesting for its explicit modeling of Marshallian agglomeration economies. Because the purpose is to measure co-agglomeration the combined effect for all industries is left aside.
One of the more accurate investigations to measure Marshallian agglomeration is the work of Glaeser and Kerr (2009). This work is also very interesting because instead of using concentration indexes as the dependent variable uses the number of new firms and jobs generated so it incorporates entrepreneurship. The geographic scope of analysis is the city. The sector analysis is based on SIC3 classification. To measure Marshallian agglomeration economies indexes are built. These indexes are weighted sums comparing the characteristics in each pair city-industry for all industries at the metropolitan area together. As an added value, it explores the Chinitz hypothesis by measuring the influence of the suppliers weighted inversely by size. The results show support for Marshallian agglomeration economies as
6Because the main objective is measure co-agglomeration. They actually used maximum and minimum values
of these proportions for each pair of individual industries
7
location determinants of entrepreneurial activity in cities. Chinitz hypothesis is also significant and positive. The industrial analysis is performed only at manufacturing.
3
3
.
.
D
D
AATTAAAANNDDV
V
AARRIIAABBLLEESS3
3..11..MMEEAASSUURREEMMEENNTTPRPROOBBLLEEMMSS
The extensive and ambiguous definition of entrepreneurship causes an empirical problem in its measurement. Self-employment is not the best metric because it fails to capture the entrepreneurial phenomenon. The relationship between economic growth and self-employment is negative (Congregado and Millan, 2008). Despite this, several studies have been developed using this metric8as Blanchflower and Oswald (1998) or Van Praag and Van
Ophem (1995).
Alternative measures can be used: the number of firm owners or number of businesses per capita, entry and exit rates from self-employment (Carree and Thurik, 2003), R&D expenditure (Audrestch, 1995) or construction of entrepreneurial indexes (Acs and Szerb, 2009)
For purposes of this research entrepreneurship will be measured by the total number of births as well as jobs generated by them (as in Rosenthal and Strange, 2005; or Glaeser and Kerr, 2009). The INE database for enterprise births DIRCE only gives information at the province level (NUTS-3) so metropolitan areas can not be correctly defined. This measurement problem is solved using firm births and jobs created from de SABI9 database.
This database provided information at the municipal level (NUTS-4) so the metropolitan areas can be constructed.
A second problem is that Spain does not have an official metropolitan area definition (Feria-Toribio, 2004). Studies at the urban level in Spain do not consider metropolitan areas (Arauzo and Teruel, 2005) or define them ad-hoc10(Arauzo and Viladecans, 2009). To solve
the above problem this study uses the definition of metropolitan areas by Boix and Veneri (2008). They employ an iterative methodology based on four phases from the identification of core cities. This methodology is attractive because it identifies 67 cities for the Spanish case and also follows a similar methodology to that used by the U.S. Census Bureau. The process
8 The main objective of these studies were measuring moves between employment and self-employment. The
essence is to measure an earnings differential between employment and self-employment. It can be defined compactly following as: ˆi iLˆi wLˆi
9
System for Analysis of Iberic Balances. It is a private database reflecting the status of more than one million businesses for the case of Spain and Portugal. It is produced by Bureau Van Dijk
10The Arauzo and Viladecans (2009) work states “The metropolitan area considered for each citycovers the area
guarantees that the city is built on a functional principle11. City and metropolitan area are used
interchangeably for the rest of the paper.
3
3..22..VVAARRIIAABBLLEESSAANNDDININDDEEXXEESSCCOONNSSTTRRUUCCTTIIOONN
Fifteen metropolitan areas12 and the entire set of 60 two-digit industries (CNAE-93) are
considered. This gives a total of 900 observations for the analysis. The dependent variable is entrepreneurial activity (Entrepreneurship). The independent variables measure city characteristics as well as city-industry sources of agglomeration based on the index constructed by Glaeser and Kerr (2009). The following list details information about each of the variables used:
ci urship
Entreprene : Measures the entrepreneurial activity during the 2000-2008 period. It is measured in two ways: (1) firm births and (2) jobs created. The variable represent the total firm births (or jobs created) during the period for each city-industry pair. These births have at least one employee and less than 20. Firm births with at least one employee were used to get rid of self-employment. Restricting the sample only to firms with fewer than 20 employees can avoid (in part) re-locations or re-constitution of enterprises. The source of information for this variable is SABI.
c
Pop : Total population in the city. The variable will measure the degree of urbanization economies. It is measured according to the INE 2001 Census. This was the last official Census for the country.
ci
Emp : Total employment for each pair city-industry. This variable measures the localization economies. It is taken from de INE 2001 Census.
c
X : This variable represents controls for the city level.
Proportion of firms births in the core municipality. (SABI)
Proportion of jobs created in the core municipality. (SABI)
Age distribution of the population. (INE 2001 Census)
Ratio of men respect to women. (INE 2001 Census)
Study level distribution of the population. (INE 2001 Census)
11
The functional approach is based on a commuting principle (greater or equal to 15% from the outskirt to the core city) to be integrated in to the metropolitan area
12Madrid, Barcelona, Valencia, Sevilla, Bilbao, Oviedo, Málaga, Zaragoza, La Palma de Gran Canaria, Alicante,
Human capital. It is measured with an index elaborated by IVIE (Valencian Institute of Economic Research)
c
Culture: Measures the entrepreneurial culture in the city with an index. This index compares the proportion of firm births for the industry against national average (Source DIRCE). Then it is multiplied by the proportion that the industry represents in the specific city (in terms of employment; source: INE 2001 Census). Higher values of the index represent a better entrepreneurial culture.
I i i c ic c Entry Entry Emp Emp Culture ,..; 1 % % cDiversity: Measures the concentration at the city level. It is calculated with the Herfindhal-Hirshman index. Values near one represent a very concentrated city while values near zero represent a totally diversified city
2 ,..; 1 ) (
I i c ic c Emp Emp Diversity ciChinitz : Accounts for the relevance of the small suppliers for each city-industry pair. It measures the proportion of Inputs (INE 2005 symmetric Input-Output table) that the industry receives from other industries. Then the index is multiplied by the inverse of the average size of the supplier industry in the city. The index is near one for a high number of suppliers and near zero if the industry is supplied by a small number of firms.
K k c i k kc ci Input Emp Firms Chinitz ,..; 1 ciInput : Measures the relative strength of sharing with suppliers. The calculation is based on the proportion of Inputs received from each industry at the national level compared with the presence of the industry in the city. Values near zero represent a good presence of suppliers in the specific city-industry while values near one are indicative a poor presence. The index is multiplied by -1 in order to obtain positive coefficients in the regression.
K k c ck k i ci Emp Emp Input Input ,..; 1 ciOutput : Measures the relative strength of sharing with customers. The calculation is based on the proportion of Output (INE 2005 symmetric Input-Output table) that the industry send to other industries at the national level multiplied by the size of the customer industry in the city. In order to avoid scale effects the index is divided by the relative size of the customer
market in the whole economy and its relative presence in the city. Greater values of the index represent good opportunities of sharing with customer.
1 ,..; 1 ,..; 1
K k c ck k K k k ck k i ci Emp Emp Output Emp Emp Output Output ciLabor : Accounts the importance of labor matching. It is calculated comparing the proportion of labor by occupation (INE 2001 Census using CNO-94 classification) in the industry relative to the presence of the occupation across industries in the specific city. The index is multiplied by -1 to obtain positive coefficients in the regression consistent with good labor matching.
O o k K ko c ck io ci L E E L Labor ,..; 1 1,..., ciTech : Measures the potential learning spillovers in the city-industry pair. This index is calculated differently than that proposed by Glaeser and Kerr (2009). The main difference is that this index uses proportion of innovative companies13(Source: INE 2003-2005 “Statistics
about R&D”) per industry instead of patent citations. A second difference is that the index developed here measures contact with innovators suppliers and customers (Glaeser and Kerr only measure supplier’s relations). The index try to capture de proportion of Inputs (Outputs) that the industry receive from (send to) other industries multiplied by the proportion of innovative companies. Values near zero indicate good contact with innovators. The index is multiplied by -1 to obtain positive coefficients in the regression related with the presence of knowledge spillovers.
k K c ck k k i K k c ck k k i ci Emp Emp Innov Output Emp Emp Innov Input Tech ,..; 1 ,..; 1 2 1 2 1Table 2 shows the main descriptive stats. Columns 1 to 4 display means, standard deviations, maximum and minimum respectively. The maximum and minimum column also inform about the sector and city that represent that value.
Mean number of new enterprises during the period 2000-2008 for each city-industry pair has been close to 200 companies. The large standard deviation tells us of the heterogeneity across industries and cities. The industry with more entry (9542 companies) is
13 Acs and Audretsch (2004) compare equations that measure innovation through R&D inputs, intermediate
process such as number of patents, and final production of innovations. They found that the conclusions differ depending on the type of indicator used. They also add that direct measures of innovation are more desirable.
Other Business Services located in the metropolitan area of Madrid. The average number of employees in new enterprises has been 824. The maximum value with 38,416 employees is present in the building industry in Madrid. The average number of employees per firm is 4. The core municipality represent in average 45% of the firms and 43% of employment generated in the whole city.
Demography appears very stable across cities in comparison with the differences in industrial structure. The measure of entrepreneurial culture shows a maximum value for Palma de Mallorca and minimum in Zaragoza. The concentration index shows Palma de Mallorca is the most concentrated city which suggests that the entrepreneurial culture is related with the great participation of the construction and tourism industries in the city. Barcelona is the most diversified city. Palma de Mallorca has the maximum value for the Chinitz index and this occurs precisely in the building industry which somehow supports the notion of high concentration and firm births in the building and tourism industry in the city. The Input index reflects the best opportunities to share relations with suppliers for the education industry in Madrid and the worst for the oil industry in Murcia. The Output index is characterized by great heterogeneity showing the best customer relationships for the leather industry in Alicante. The Labor index shows that the best match in terms of occupations is in agriculture in Barcelona and the worst is for the maritime transport industry in Madrid. The Tech index suggests the best chance for knowledge spillovers for the building industry in Granada, while the worst are for the recycling industry in Malaga.
Mean S.D. Maximun (Sector) Minimum (Sector)
1 2 3 (City) 4 (City)
Number of Entrepreneurial Firms 199.34 724.40 9542.00 (s74) (MAD) 0.0000 Many
Number of Employeed in Entrepreneurial Firms 824.44 2939.90 38416.00 (s45) (MAD) 0.0000 Many
Number of Employees per firm 4.0573 2.6613 20.0000 (S95) (ZAR) 0.0000 Many
Number of Entrep. Firms in the Core Municipality 90.10 346.71 6200.00 (s74) (MAD) 0.0000 Many
% Firms Entrep. Firms in the Core Municipality 0.4520 0.2978 1.0000 Many 0.0000 Many
Number of Entrep. Employees in the Core Municipality 355 1275 21037 (s74) (MAD) 0.0000 Many
% Employees in the Core Municipality 0.4306 0.3112 1.0000 Many 0.0000 Many
Population 1392644 1533836 5806548 (MAD) 528634 (PML)
% Population younger than 20 years 0.2091 0.0271 0.2438 (MUR) 0.1562 (OVD)
% Population 20-40 years 0.3365 0.0150 0.3607 (PGC) 0.3040 (OVD)
% Population older than 60 years 0.1995 0.0268 0.2549 (OVD) 0.1629 (PGC)
% Men / Women 0.9488 0.0173 0.9794 (OVD) 0.9101 (PGC)
Human Capital Index 2.7344 0.1570 3.0588 (BIL) 2.5388 (MLG)
% Analfabet Population 0.0233 0.0089 0.0371 (TEN) 0.0085 (OVD)
% Population without studies 0.1143 0.0221 0.1453 (GRA) 0.0646 (BIL)
% Population with first level education 0.2137 0.0212 0.2700 (VGO) 0.1797 (MAD)
% Population second level eduaction 0.5024 0.0273 0.5719 (PML) 0.4534 (GRA)
% Population third level eduaction 0.1462 0.0246 0.1997 (MAD) 0.1084 (VGO)
Diversity Index (HHI) 0.0597 0.0091 0.0726 (PML) 0.0462 (BCN)
Entrepreneurial Culture Index 0.9349 0.0373 1.0332 (PML) 0.8882 (ZAR)
Employees by city-industry 9674 24599 260812 (s45) (MAD) 0.0000 Many
Total Employees by city 580460 696000 2594778 (MAD) 179281 (GRA)
Total resident employees 546807 672414 2517895 (MAD) 162577 (GRA)
Chinitz index 0.0048 0.0024 0.0183 (S45) (PML) 0.0000 Many
Input index -1.4086 0.1609 -0.9457 (s80) (MAD) -1.8125 (s23) (MUR)
Output index 0.9710 1.1388 26.4809 (s19) (ALI) 0.0000 Many
Labor index -1.1987 0.1844 -0.8647 (s01) (BCN) -1.7079 (s61) (MAD)
Tech index -0.9704 0.0173 -0.8810 (s45) (GRA) -1.0019 (s37) (MAL)
Source: INE, SABI and IVIE
Table 2 Descriptive Stats
4
4
.
.
T
T
HHEEM
M
OODDEELLThe model specification is based in the proposal by Glaeser and Kerr (2009) for the U.S. case. The econometric estimation method used is ordinary least squares. White’s robust error matrix is used to correct heteroscedasticity problems. The variables will be standardized to have zero mean and unit standard deviation. This will help to interpret the coefficients in terms of their variability.
Equation (1) represents the main estimation:
ci ci T ci L ci O ci I ci Ch c C c H c c ci E c P i ci Tech Labor Output Input Chinitz Culture Diversity X Emp Pop urship Entreprene ln( ) ln( ) ) ln( (1)
The coefficienti represents the fixed effects at the industry level. The termci represents the residuals of the regression. Endogeneity is a concern. Problems of measurement error (the indexes do not capture perfectly the essence of the agglomeration economies) or omitted variables (Other relevants factor causing firm births) might be present.
A second estimation is proposed dropping the city specific controls Xcand substituting them by city fixed effectsc. This estimation presented in equation (2) is also called conditional. It receives this name because this estimation is conditional on the city fixed effects as good substitutes for city demographics.
ci ci T ci L ci O ci I ci Ch ci E c i ci Tech Labor Output Input Chinitz Emp urship Entreprene ln( ) ) ln( (2)
5
5
.
.
R
R
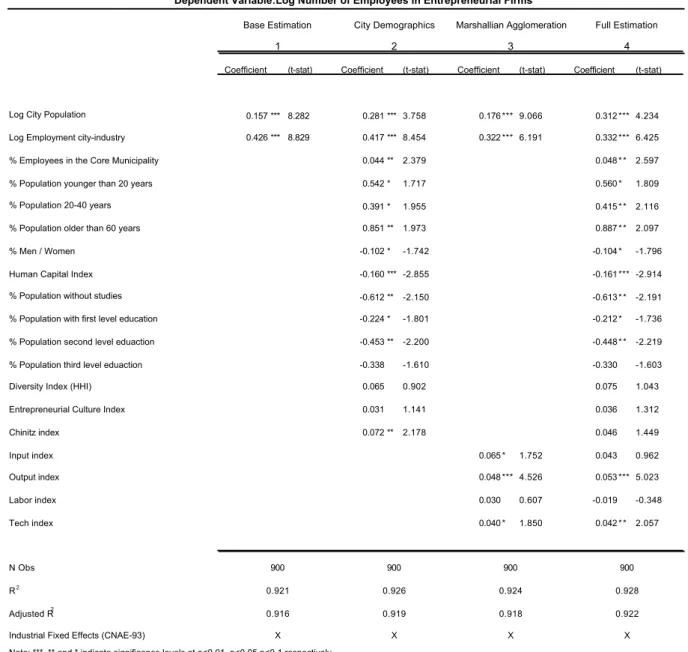
EESSUULLTTSS 5 5..11..GGEENNEERRAALLRREEGGRREESSSSIIOONNRREESSUULLTTSSTable 3 shows the results for the unconditional estimates for the dependent variable number of employees in new firms. Column 1 shows the base estimation that captures only the economies of urbanization and localization. Both are highly significant but the effect of localization economies is stronger.
Column 2 adds city demographics. It can be seen that the proportion of employees in the core municipality has a small but significant impact. Human capital and educational level
have a negative sign showing an inverse relationship between human capital and entrepreneurship in Spain (this is consistent with the low-skill entrepreneurship in the country even removing self-employment). The culture and diversity measures have no effect on entrepreneurial employment. Chinitz index is significant and positive.
Coefficient (t-stat) Coefficient (t-stat) Coefficient (t-stat) Coefficient (t-stat)
Log City Population 0.157 *** 8.282 0.281 *** 3.758 0.176 *** 9.066 0.312 *** 4.234
Log Employment city-industry 0.426 *** 8.829 0.417 *** 8.454 0.322 *** 6.191 0.332 *** 6.425
% Employees in the Core Municipality 0.044 ** 2.379 0.048 * * 2.597
% Population younger than 20 years 0.542 * 1.717 0.560 * 1.809
% Population 20-40 years 0.391 * 1.955 0.415 * * 2.116
% Population older than 60 years 0.851 ** 1.973 0.887 * * 2.097
% Men / Women -0.102 * -1.742 -0.104 * -1.796
Human Capital Index -0.160 *** -2.855 -0.161 *** -2.914
% Population without studies -0.612 ** -2.150 -0.613 * * -2.191
% Population with first level education -0.224 * -1.801 -0.212 * -1.736
% Population second level eduaction -0.453 ** -2.200 -0.448 * * -2.219
% Population third level eduaction -0.338 -1.610 -0.330 -1.603
Diversity Index (HHI) 0.065 0.902 0.075 1.043
Entrepreneurial Culture Index 0.031 1.141 0.036 1.312
Chinitz index 0.072 ** 2.178 0.046 1.449 Input index 0.065 * 1.752 0.043 0.962 Output index 0.048 *** 4.526 0.053 *** 5.023 Labor index 0.030 0.607 -0.019 -0.348 Tech index 0.040 * 1.850 0.042 * * 2.057 N Obs R2 Adjusted R2
Industrial Fixed Effects (CNAE-93)
Note: ***, ** and * indicate significance levels at p<0.01, p<0.05 p<0.1 respectively
X X X X
0.916 0.919 0.918 0.922
0.921 0.926 0.924 0.928
900 900 900 900
1 2 3 4
Table 3: Non-Conditional Estimation Number of Employees
Dependent Variable:Log Number of Employees in Entrepreneurial Firms
Base Estimation City Demographics Marshallian Agglomeration Full Estimation
Column 3 adds Marshallian agglomeration economies without the demographic controls. The Output index is highly significant, showing that entrepreneurial activity is primarily affected by a good representation of customers. Sharing inputs and innovation represented by the Tech and Input indexes are significant and positive but only at 10% significance level. The labor index is not significant which suggests that the presence of specific occupations are not important for entrepreneurship in a broad sense. Spanish entrepreneurship is based mainly in industries where skilled labor is not necessarily relevant.
Another possible reason is that the localization economies are capturing the labor pooling effect.
Column 4 shows the full estimation. The results do not change dramatically. It is worth noting that the Chinitz and the Input indexes loss significance. This can be caused by the high degree of correlation between the Tech and the Chinitz indexes. The Output index along with urbanization and localization economies seems to be the more meaningful agglomeration effects. It is also important to note the high R-squared of 0.92. Industry fixed effects alone give a value of 0.81 which shows the importance of the existing industrial structure. On the other hand, urbanization and localization economies alone explain 0.60 of the total variance of new jobs.
Coefficient (t-stat) Coefficient (t-stat) Coefficient (t-stat) Coefficient (t-stat)
Log City Population 0.183 *** 9.953 0.215 *** 4.249 0.191 *** 11.372 0.233 *** 4.809
Log Employment city-industry 0.389 *** 8.354 0.367 *** 8.520 0.306 *** 7.247 0.316 *** 8.158
% Firms in the Core Municipality -0.032 ** -2.236 -0.029 * * -2.078
% Population younger than 20 years 0.240 1.180 0.249 1.263
% Population 20-40 years 0.201 1.468 0.213 1.600
% Population older than 60 years 0.416 1.449 0.434 1.555
% Men / Women -0.042 -1.035 -0.041 -1.060
Human Capital Index -0.170 *** -3.626 -0.169 *** -3.680
% Population without studies -0.294 -1.546 -0.289 -1.573
% Population with first level education -0.127 -1.482 -0.117 -1.372
% Population second level eduaction -0.236 * -1.701 -0.229 * -1.692
% Population third level eduaction -0.112 -0.821 -0.104 -0.785
Diversity Index (HHI) -0.058 -1.211 -0.055 -1.168
Entrepreneurial Culture Index 0.054 ** 2.490 0.058 *** 2.740
Chinitz index 0.089 *** 3.072 0.073 *** 2.594 Input index 0.075 ** 2.267 0.029 0.823 Output index 0.029 1.325 0.034 * 1.877 Labor index 0.035 0.826 -0.032 -0.739 Tech index 0.038 ** 2.154 0.035 * * 2.358 N Obs R2 Adjusted R2
Industrial Fixed Effects (CNAE-93)
Note: ***, ** and * indicate significance levels at p<0.01, p<0.05 p<0.1 respectively
X X X X
0.943 0.949 0.945 0.950
0.947 0.953 0.949 0.954
900 900 900 900
1 2 3 4
Table 4: Non-Conditional Estimation Number of Firms
Dependent Variable:Log Number of Entrepreneurial Firms
Base Estimation City Demographics Marshallian Agglomeration Full Estimation
Table 4 shows the same regressions but using as dependent variable the number of new firms. There are three major differences with the previous estimation. First the demographic variables of age and education loss their significance but the human capital is again negative and highly significant. Second the existence of customers or the Output metric
loses much of its importance but remains significant at 10% in the full estimation. Third the Chinitz and the Entrepreneurial Culture metrics that were not significant in the case of new jobs are now positive and highly significant. Knowledge spillovers index also seems to be more important for firm births than for jobs created. All this suggests that the determinants for new employment are more related with characteristics of the population in the city while firm births are more sensitive to the industrial structures. That conclusion can be confirmed by noting an increase in the R-squared in this regression to 0.95, largely because industry fixed effects alone explain a 0.83 of variability.
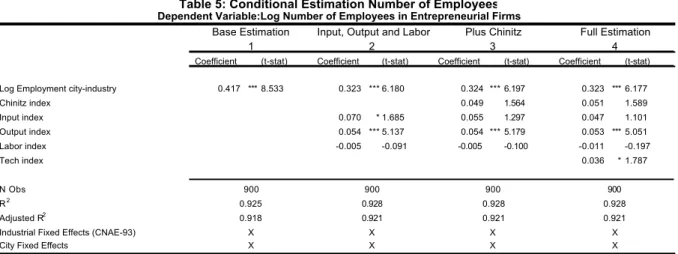
Table 5 presents the conditional estimation for the number of jobs generated. In general this estimation makes more emphasis on the variables measuring agglomeration economies. Unfortunately, the metric for urbanization economies become part of the fixed effects. The conclusions do not change from the ones of Table 3. Localization economies are highly significant. The Input index is significant until the Chinitz index is introduced. A possible multicollinearity effect may exist. The Output and the Tech indexes maintain their significances and magnitudes. The R-square is very similar suggesting that the city-level fixed effects are a good substitute for the demographic characteristics presented above.
Coefficient (t-stat) Coefficient (t-stat) Coefficient (t-stat) Coefficient (t-stat)
Log Employment city-industry 0.417 *** 8.533 0.323 *** 6.180 0.324 *** 6.197 0.323 *** 6.177
Chinitz index 0.049 1.564 0.051 1.589 Input index 0.070 * 1.685 0.055 1.297 0.047 1.101 Output index 0.054 *** 5.137 0.054 *** 5.179 0.053 *** 5.051 Labor index -0.005 -0.091 -0.005 -0.100 -0.011 -0.197 Tech index 0.036 * 1.787 N Obs R2 Adjusted R2
Industrial Fixed Effects (CNAE-93) City Fixed Effects
Note: ***, ** and * indicate significance levels at p<0.01, p<0.05 p<0.1 respectively
X X X X X X X X 0.918 0.921 0.921 0.921 0.925 0.928 0.928 0.928 900 900 900 900 1 2 3 4
Table 5: Conditional Estimation Number of Employees
Dependent Variable:Log Number of Employees in Entrepreneurial Firms
Base Estimation Input, Output and Labor Plus Chinitz Full Estimation
Table 6 shows the conditional estimation for the number of firm births. The main conclusions from Table 4 are maintained, except for the Input index that becomes significant. The possible reason is the high correlation with some demographic characteristics. Despite some differences between the estimates for new jobs and firm births the influence of Marshallian agglomeration economies in entrepreneurial activity is robust, especially for the Output and the Tech indexes.
Coefficient (t-stat) Coefficient (t-stat) Coefficient (t-stat) Coefficient (t-stat)
Log Employment city-industry 0.375 *** 8.463 0.309 *** 7.885 0.309 *** 7.926 0.308 *** 7.941
Chinitz index 0.069 ** 2.440 0.071 ** 2.400 Input index 0.091 ** 2.524 0.070 * 1.917 0.062 * 1.697 Output index 0.035 * 1.905 0.035 * 1.892 0.034 * 1.785 Labor index -0.027 -0.627 -0.028 -0.641 -0.033 -0.759 Tech index 0.036 ** 2.399 N Obs R2 Adjusted R2
Industrial Fixed Effects (CNAE-93) City Fixed Effects
Note: ***, ** and * indicate significance levels at p<0.01, p<0.05 p<0.1 respectively
X X X X X X X X 0.948 0.950 0.950 0.950 0.953 0.954 0.954 0.955 900 900 900 900 1 2 3 4
Table 6: Conditional Estimation Number of Firms
Dependent Variable:Log Number of Entrepreneurial Firms
Base Estimation Input, Output and Labor Plus Chinitz Full Estimation
5
5..22..ALALTTEERRNNAATTIIVVEESSPPEECCIIFFIICCAATTIIOONNSS
This section analyze the effects of Marshallian agglomeration by industry. This is interesting because part of the value added of this work is analyzing the service sector. Unfortunately, building industry can not be analyzed because it only has 15 observations in the sample. Also estimations by city and strategies to solve endogeneity are addressed.
Coefficient (t-stat) Coefficient (t-stat) Coefficient (t-stat) Coefficient (t-stat)
Log Employment city-industry 0.596 *** 2.777 0.318 *** 4.970 0.180 1.196 0.052 0.439
Chinitz index -0.572 -1.030 0.326 ** 2.209 -0.100 -0.249 0.045 0.827 Input index 0.852 1.391 -0.200 * -1.777 0.151 0.649 0.110 * 1.895 Output index 0.143 0.644 0.064 *** 5.526 0.090 ** 2.293 0.191 * 1.787 Labor index -0.084 -0.087 0.084 0.648 0.332 1.048 -0.043 -0.400 Tech index -0.555 -1.509 0.001 0.024 0.081 1.009 0.036 1.441 N Obs R2 Adjusted R2
Industrial Fixed Effects (CNAE-93) City Fixed Effects
Note: ***, ** and * indicate significance levels at p<0.01, p<0.05 p<0.1 respectively
X X X X X X X X 0.796 0.859 0.696 0.945 0.898 0.877 0.765 0.951 45 330 120 390 1 2 3 4
Table 7: Conditional Sectorial Estimation Number of Employees
Dependent Variable:Log Number of Employees in Entrepreneurial Firms
Agropecuary Industrial Energy Services
Table 7 shows the results by industry using new employment as the dependent variable. Column 1 shows the agricultural sector. As expected, only localization economies are significant. The manufacturing industry is presented in column 2. Economies of localization and the Output index are positive and significant. The Chinitz index is also positive and of big magnitude indicating that small suppliers in the manufacturing industry are important to attract new jobs. It is worth noting that the Input index is significant but negative. This suggests that manufacturing industries tend to be concentrated near small suppliers and far from the bigger ones. Big manufacturing industry suppliers concentrate in a
different region or metropolitan than new ventures which may explain the negative coefficient and opens the door to analyze the network effects that exist between metropolitan areas (unfortunately it is out of the scope of this research). For the energy industry only the Output index is significant indicating new ventures in the industry follow their customers. The service industry is only affected by the Input and the Output indexes. Both effects are weakly significant. This suggests that entrepreneurial activity in this industry is affected by the presence of suppliers and customers. The localization economies are not significant for the first time. This suggests that services follow other industries to agglomerate.
Coefficient (t-stat) Coefficient (t-stat) Coefficient (t-stat) Coefficient (t-stat)
Log Employment city-industry 0.622 *** 3.774 0.301 *** 5.425 0.150 *** 2.571 0.096 1.033
Chinitz index -0.674 -1.366 0.253 ** 1.994 0.147 0.565 0.087 ** 1.923 Input index 0.832 * 1.776 -0.178 ** -1.973 0.155 1.051 0.122 *** 2.650 Output index 0.045 0.223 0.055 *** 3.133 0.007 0.307 0.176 ** 2.107 Labor index -0.796 -1.116 0.037 0.289 0.215 0.997 -0.046 -0.575 Tech index -0.234 -0.859 0.019 0.474 0.041 0.890 0.026 * 1.837 N Obs R2 Adjusted R2
Industrial Fixed Effects (CNAE-93) City Fixed Effects
Note: ***, ** and * indicate significance levels at p<0.01, p<0.05 p<0.1 respectively
X X X X X X X X 0.879 0.907 0.790 0.972 0.939 0.919 0.838 0.975 45 330 120 390 1 2 3 4
Table 8: Conditional Sectorial Estimation Number of Firms
Dependent Variable:Log Number of Entrepreneurial Firms
Agropecuary Industrial Energy Services
Table 8 shows the conditional estimates for the dependent variable number of new firms. The influence of Marshallian agglomeration factors becomes more relevant for this estimation. The agricultural industry is again influenced by economies of location. The big difference is that in this case the Input index is also significant. The main supplier of the agricultural industry is the own industry so this reinforcesthe relevance of localization economies. The results for the manufacturing industry do not change from the previous specification. It should be noted that the Input index increases its significance and maintain its negative sign. In the energy industry the results change. The localization economies are now the only significant coefficient. This reflects that new firms tend to concentrate around old ones in this industry but the creation of jobs is more related to customers presence. The estimation for the service industry presents some differences with the previous one. The Input and the Output indexes increase their level of significance. The Chinitz and the Tech indexes become significant. This suggests that the influence of small suppliers and innovative companies affect the location of new firms in the service industry but not the employment size.
An individual estimation by city was also run. The results are shown in Table A1 in the annex. The only significant effect across cities is the localization effect. The magnitude of the localization economies is decreasing with respect to city size. This indirectly suggests a sharing effect making more effective the presence of the own industry as the market grows and specializes.
To deal with endogeneity Glaser and Kerr (2009) propose an alternate estimation. This estimation re-calculates the agglomeration indexes based on the city-industry employment shares derived by natural cost advantage estimation. This new estimation is based on the methodology proposed by Ellison and Glaeser (1999). The new indexes account only for the agglomeration caused by the natural conditions so it is supposed to solve endogeneity. The main results of the natural cost advantages estimation can be seen in Table A2 of the Annex. The results are not reliable because information about natural cost advantages in Spain is not complete. It is difficult to tract the prices and specific consumptions of raw materials as proposed by the methodology. This causes that the estimates derived from this method homogenize too much the characteristics of the metropolitan areas (The means of the re-calculated indexes are very similar to the original ones but the standard deviations decrease a lot as shown in Table A3) so the conclusions can not be used to make inference about endogeneity concerns.
5
5..33..PPRRIINNCCIIPPAALLCCOOMMPPOONNEENNTTAANNAALLYYSSIISS
A final exercise using principal component analysis is proposed. The idea of this analysis is to test the inter-dependencies between the calculated indexes and localization economies. The idea behind this exercise is that the metric of localization economies is too broad so it can be taking predictive capacity from the Marshallian agglomeration indexes. Using principal component analysis can help to understand better these inter-dependencies creating lineal combinations of the original variables. This new factors extracted from the analysis are perfectly orthogonal by construction so they can be used instead of the original indexes to create a more efficient regression.
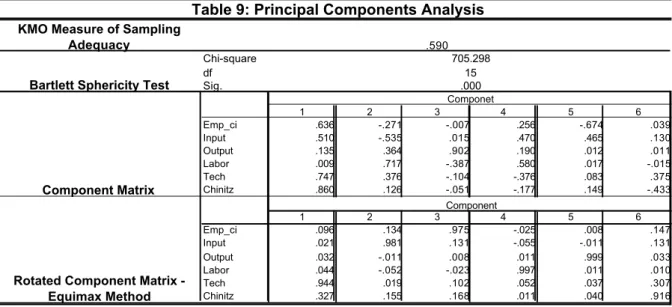
Table 9 in the Annex shows the main results of the principal component analysis. The Kaiser-Meyer-Olkin (KMO) measure gives us an idea of the capacity of the original variables to be summarized by a lineal combination. A KMO measure of 0.590 is low for standard principal component analysis but high enough to show some type of hidden relations between the variables. The component matrix shows the correlation between the original variables and the orthogonal factor or components. Localization economies Input, Tech and Chinitz indexes
are connected. This connection suggests that the better predictor (localization economies in this case) can take away explanatory power from the other indexes. Finally the rotated solution allows us to construct new factors that mimic almost perfectly the original repressors (a correlation higher than 0.90 correlations in all cases) but incorporates the variability of the other indexes that is more common to one of them.
KMO Measure of Sampling Adequacy Chi-square df Sig. 1 2 3 4 5 6 Emp_ci .636 -.271 -.007 .256 -.674 .039 Input .510 -.535 .015 .470 .465 .130 Output .135 .364 .902 .190 .012 .011 Labor .009 .717 -.387 .580 .017 -.015 Tech .747 .376 -.104 -.376 .083 .375 Chinitz .860 .126 -.051 -.177 .149 -.433 1 2 3 4 5 6 Emp_ci .096 .134 .975 -.025 .008 .147 Input .021 .981 .131 -.055 -.011 .131 Output .032 -.011 .008 .011 .999 .033 Labor .044 -.052 -.023 .997 .011 .010 Tech .944 .019 .102 .052 .037 .307 Chinitz .327 .155 .168 .011 .040 .916 Component Matrix Componet
Rotated Component Matrix - Equimax Method
Component
Table 9: Principal Components Analysis
.590
Bartlett Sphericity Test
705.298 15 .000
Table A4 in the Annex shows the regressions run with the factor extracted from the rotated solution. The results show a generalized increase in significance levels. A second effect is that the Labor index is now significant. This result suggests that the localization economies (measured as total employment in each city-industry pair) are also capturing the effect of labor pooling. The problem of using factors instead of original variables is that we do not know the real economic meaning of the lineal combinations. The new regressions also show some advantages solving possible multicollinearity problems and increasing significance levels. The analysis also suggests that broad measures of agglomeration are capturing multiple agglomeration phenomena at the same time.
6
6
.
.
C
C
OONNCCLLUUSSIIOONNMarshallian agglomeration economies are present in the Spanish economy and significantly affect entrepreneurial activity. A good costumer base is especially important to create sharing opportunities as measured by the Output index. The relevance of suppliers for sharing was no so strong but has some effect. Proximity to innovative companies to take advantage of knowledge spillovers is also relevant for business formation. The Chinitz index (that measures the relevance of small suppliers inside the city) was also relevant to explain the
location of new firms but no so much to explain the employment created by this firms. The labor pooling was not significant for new firms. Particularly interesting are the results regarding the service industry. Localization economies have no effect in services but they are highly influenced by the marshallian agglomeration factors.
The research also presents some challenges that should be addressed. First the potential of endogeneity was not solved. The method proposed to solve it was not robust. A second problem is given by the own indexes, although capturing the essence of what Marshallian agglomeration economies are, they do not cover the entire theoretical concept. Finally the database used was a sample and not a census of new firms maybe causing representativeness problems for some industries. It serves as motivation for future work attempting to use other public sources as might be the DIRCE to check how robust the results are and extending them to other countries.
Future research should include a deeper analysis in the industrial and geographical dimension. This work focused on two-digit (CNAE-93) industries and the largest 15 metropolitan areas in Spain. Including three and four-digit industries should be the next step. Adding more metropolitan areas can explain if Marshallian agglomeration economies disappear with city size. Finally explore further the Chinitz hypothesis seems plausible given the favorable evidence presented and its relevance for new firm formation.
7
7
.
.
R
R
EEFFEERREENNCCEESSAcs, Z. J. and Szerb L. (2009). “The global entrepreneurship index (GEINDEX)”, Jena Economics Research Papers N° 2009-28.
Acs, Z. J. and Audretsch, D. B (2003). “ Innovation and Technological Change”. In Z.J. Acs and D.B. Audretsch (eds.), Handbook of Entrepreneurship Research, 55-79. Kluwer Academic Publishers, Gran Bretaña.
Arauzo, J. M. (2005) “Determinants of Industrial Location. An Application for Catalan Municipalities,” Papers in Regional Science, 84, 105–120.
Alañón, A., y Arauzo-Carod, J.M. (2009). "Accessibility and Industrial Location: evidence from Spain," Documentos de trabajo de la Facultad de Ciencias Económicas y Empresariales 09-01, Universidad Complutense de Madrid, Facultad de Ciencias Económicas y Empresariales.
Arauzo, Josep M. y Miguel Manjón. (2004) “Firm Size and Geographical Aggregation: An Empirical Appraisal in Industrial Location,” Small Business Economics, 22, 299–312.
Arauzo-Carod, J.M.; Teruel-Carrizosa, M. (2005) “An Urban Approach to Firm Entry: The Effect of City Size”, Growth and Change, 36 (4), 508-528.
Arauzo-Carod J.M.; Liviano-Solis D.; y Manjón-Antolín, M. (2008). “Empirical studies in industrial location: an assessment of their methods and results”, Journal of Regional Science, VOL. XX, N° X, pp. 1–32
Arauzo-Carod, J.M.; Liviano-Solis D.; y Martín-Bofarrul, C. (2009). "New business formation and employment growth: some evidence for the Spanish manufacturing industry," Small Business Economics, Springer, vol. 30(1), pages 73-84,.
Arauzo-Carod, J.M. and Viladecans-Marsal E. (2009). “ Industrial Location at the Intra-Metropolitan Level: The Role of Agglomeration Economies” Regional Studies, Vol. 43.4, 545–558.
Audretsch, David B. (1995). Innovation and Industry Evolution. Cambridge, MA: MIT Press.
Audretsch, D.B. and Feldman, M.P.(1996). “R&D spillovers and the geography of innovation and production”, American Economic Review 86(3), 630-640.
Audretsch, J and Callejón, María (2007). “La política industrial actual: Conocimiento e innovación empresarial”. Economía Industrial, No. 363, 33-46.
Baumol, W. J. (1968). “Entrepreneurship in Economic Theory”, The American Economic Review, Vol. 58, No. 2, Papers and Proceedings of the Eightieth Annual Meeting of the American Economic Association, 64-71 Baumol, William, J. (1990). “ Entrepreneurship: Productive, unproductive and destructive”. Journal of Political Economy, 98, 893-921.
Baumol, William J. (2002), “Entrepreneurship, Innovation and Growth: The David-Goliath Symbiosis” en David B. Audretsch (ed.) Innovation and Entrepreneurship. Kluwer Academic Publishers.
Blanchflower, D. and Oswald, A., (1998). "What Makes an Entrepreneur?," Journal of Labor Economics, University of Chicago Press, vol. 16(1), 26-60
Boix, R.;and Veneri, P. (2009). “Metropolitan Areas in Spain and Italy” IERMB Working Paper in Economics, nº 09.01, March 2009
Brock, W. and Evans, D. (1985). "The Economics of Regulatory Tiering," RAND Journal of Economics, vol. 16(3), pages 398-409
Carree, M. A. and Thurik, A. R. (2003). “The Impact of Entrepreneurship on Economic Growth”. In Z.J. Acs and D.B. Audretsch (eds.), Handbook of Entrepreneurship Research, 437-471. Kluwer Academic Publishers, Gran Bretaña.
Chinitz, B (1961) “Contrasts in Agglomeration: New York and Pittsburgh”, The American Economic Review, Vol. 51, No. 2, Papers and Proceedings of the Seventy -Third Annual Meeting of the American Economic Association, 279-289.
Coduras, A. (2006). “La motivación para emprender en España”, Ekonomiaz, Revista Vasca de Economía, 62(2), 12-39.
Congregado, E.; and Millán J.M. (2008). “Capital humano y transiciones al autoempleo”, en Congregado et al.
El capital humano y los emprendedores en España, pp. 101-130. IVIE- Bancaja, Instituto Valenciano de Investigaciones Económicas, Valencia, 226 p.
Costa, D.L. and M.E. Kahn (2001), "Power Couples," Quarterly Journal of Economics 116, 1287-1315.
Costa Campi, M.T.; Segarra A.; and Viladecans E. (2004). “The Location of New Firms and the Life Cycle of Industries”. Small Business Economics. Vol. 22, Num 3-4(4), 265-281
Duranton, G. and Puga D. (2001). “Nursery cities: Urban diversity, process innovation, and the life cycle of products”. American Economic Review 91(5):1454–1477.
Duranton, G. and Puga, D. (2004). “Micro-foundations of urban agglomeration economies”. In J. V. Henderson, P. Nijkamp, E. S. Mills, P. C. Cheshire and J. F. Thisse (ed.) Handbook of Regional and Urban Economics Capítulo 48, Blackwell, 2063-2117