Original Article
Integrating absolute distances in collaborative representation for robust
image classification
Shaoning Zeng
a,*
, Xiong Yang
a, Jianping Gou
b, Jiajun Wen
ca
Department of Computer Science, Huizhou University, 46 Yanda Road, Huizhou, Guangdong, China b
College of Computer Science and Communication Engineering, Jiangsu University, 301 Xuefu Road, Zhenjiang, Jiangsu, China c
Institute of Textiles and Clothing, Hong Kong Polytechnic University, Room QT715, Q Core, 7/F, Hong Kong Available online 13 October 2016
Abstract
Conventional sparse representation based classification (SRC) represents a test sample with the coefficient solved by each training sample in all classes. As a special version and improvement to SRC, collaborative representation based classification (CRC) obtains representation with the contribution from all training samples and produces more promising results on facial image classification. In the solutions of representation coefficients, CRC considers original value of contributions from all samples. However, one prevalent practice in such kind of distance-based methods is to consider only absolute value of the distance rather than both positive and negative values. In this paper, we propose an novel method to improve collaborative representation based classification, which integrates an absolute distance vector into the residuals solved by collaborative representation. And we named it AbsCRC. The key step in AbsCRC method is to use factorsaandbas weight to combine CRC residualsrescrcwith absolute distance vector disabs and generate a new deviationr¼a$rescrcb$disabs, which is in turn used to perform
classification. Because the two residuals have opposite effect in classification, the method uses a subtraction operation to perform fusion. We conducted extensive experiments to evaluate our method for image classification with different instantiations. The experimental results indicated that it produced a more promising result of classification on both facial and non-facial images than original CRC method.
Copyright©2016, Chongqing University of Technology. Production and hosting by Elsevier B.V. This is an open access article under the CC BY-NC-ND license (http://creativecommons.org/licenses/by-nc-nd/4.0/).
Keywords:Sparse representation; Collaborative representation; Integration; Image classification; Face recognition
1. Introduction
Image classification is an crucial technique applied in
biometrics like face recognition [1,2] and one of the most
significant steps in image classification is to represent or code the images. Proper description or representation of images is
the basis of achieving robust image classification results[3,4].
Only with well represented, one subject in the form of the image can be easily distinguished from the others. The basic
process of representation-based classification is firstly repre-senting the targeted sample with a linear combination on training samples and then evaluating the dissimilarity to classify the test sample into a closest class. Representation-based classification algorithms play a significant role in face recognition. Among various representation-based
classifica-tion methods [5e7], sparse representation (SR) and
collabo-rative representation (CR) based classifications are two of
most crucial methods that have drawn wide attention[8,9].
Despite face recognition is a convenient biometric tech-nology and has been widely studied, there is still lots of challenge in this area. First, face images may be captured in severe variation of poses, illuminations and facial expressions. Consequently, even the images of one same face may differ significantly, which is likely to corrupt the discrimination. Furthermore, it is another big problem that lack of enough *Corresponding author.
E-mail addresses:[email protected](S. Zeng),[email protected] (X. Yang),[email protected](J. Gou),[email protected]
(J. Wen).
Peer review under responsibility of Chongqing University of Technology.
ScienceDirect
CAAI Transactions on Intelligence Technology 1 (2016) 189e196
http://www.journals.elsevier.com/caai-transactions-on-intelligence-technology/
http://dx.doi.org/10.1016/j.trit.2016.09.002
2468-2322/Copyright©2016, Chongqing University of Technology. Production and hosting by Elsevier B.V. This is an open access article under the CC BY-NC-ND license (http://creativecommons.org/licenses/by-nc-nd/4.0/).
training samples for robust face recognition. Some researchers proposed various methods to create more representations of one face to improve the accuracy of face recognition. Gao et al. proposed a virtual face image generation for robust face
recognition [10], and Thian et al. also proposed using visual
virtual samples to improve face authentication[11]. Recently,
Xu et al. proposed to reprocess images with symmetrical samples in sparse representation based image classification
[12]. The combination of multiple methods of image
classifi-cations is effective for improving the classification accuracy
[13]. How to obtain competitive and complementary
contri-butions among multiple descriptions of images is an hot topic. Furthermore, even sparse representation and collaborative representation can be combined together for classification
[14]. So integrating multiple classifiers is an effective
approach to pursue robust image classification.
This paper proposes a novel method to integrate an ab-solute distance vector with the coefficient solved by CRC to improve image classification. The basic idea of our pro-posed method is to calculate an absolute distance vector between the query sample and the training samples when solving the collaborative coefficient, and then integrate the
absolute distance vectordisabsfor the query sample with the
collaborative residualsrescrcsolved by CRC, with a pair of
tuned fusion factors a and b. Therefore a new fusion
re-siduals can be obtained with r¼a$rcrcb$dabs, which is
finally used to perform classification. We tested the pro-posed method on a number of facial or non-facial datasets and found that it archived higher accuracy than conventional CRC. The paper has the following main contributions to image classification. First, it proposes a novel fusion method to improve CRC. Second, it analyzes and implements a reverse integration on multiple classifiers. Third, it dem-onstrates an experiment way to find tuned factors for integration on multiple classifiers.
The structure of the following content in this paper is as follows. The related work on SRC, CRC is introduced in
Section2. In Section3, we describe our proposed method to
integrate absolute distances in collaborative representation
based classification (AbsCRC). In the next Section 4, we
analyze the selection of fusion factorsaandb, as well as some
classification examples in the experiments. Section5conducts
our experiments on a couple of popular benchmark datasets,
and Section6concludes the paper.
2. Related work
Our work is to improve CRC with a novel fusion method. CRC is proposed as an improvement to SRC, therefore we first analyze the work related with conventional SRC before dig-ging into CRC.
2.1. Sparse representation based classification
Sparse representation based classification (SRC) algorithm
was proposed by J. Wright et al.[8]. The basic procedure to
perform classification based on sparse representation involves
two steps, which are first representing the test sample with a linear combination on all training samples and then identifying the closest class based on the minimal deviation.
Assume that there areCsubjects or pattern classes withN
training samples x1;x2;…;xn and the test sample is y. Let
matrix Xi¼ ½xi;1;xi;2;…;xi;ni2I
mni denote n
i training
sam-ples from the ith class. By stacking all columns from the
vector of awhgray-scale image, we can obtain the vector to
identify this image:x2Imðm¼whÞ. Each column ofA
iis
then representing the training images of theith subject. So any
test sample y2Im from the same class can be denoted by a
linear formula as:
y¼ai;1xi;1þai;2xi;2þ/þai;nxi;n; ð1Þ
whereai;j2I;j¼1;2;…;ni.
And then Ntraining samples ofCsubjects can be denoted
by a new matrix:X¼ ½Xi;X2;…;XC. So (1) can be rewritten
to a simpler form like:
y¼X$a2Im; ð2Þ
wherea¼ ½0;…;0;ai;1;ai;2;…c;0;…;0
T
is the sparse
coef-ficient vector in which only entries related with the ith class
are not zero. This vector of coefficient is the key factor to
affect the robustness of classification. It's noted that SRC using
the entire training samples to solve the coefficient.
Next step in SRC is to perform anl1-norm minimization to
solve the optimization problem to pursue the sparsest solution to (2). And this result is used to identify the class of the test
sampley. Here we use:
ðbaÞ ¼arg minakak1; ð3Þ Next, SRC computes the residuals with this representing
coefficient vector associated withith class, that is:
rsrcðyÞ ¼ kyXi$abik2: ð4Þ
And finally output the identity of yas:
identityðyÞ ¼arg minifrsrc;ig: ð5Þ
Some SRC algorithms are also implemented byl0-norm,lp
-norm (0<p<1), or evenl2-norm minimization. Xu et al.[15]
exploited thel1/2-norm minimization to shrink the sparsity
in-side the representation coefficient matrix. Allen Y. Yang et al.
proposed fast l1-minimization algorithms called augmented
lagrangian methods (ALM) for robust face recognition[16].
Furthermore, many researchers proposed different SRC implementation and improvement, such as kernel sparse
rep-resentation proposed by Gao et al.[17], an algorithm by Yang
and Zhang that using a Gabor occlusion dictionary to raise the computing performance during the process for face occlusion
[18], l1-graph for image classification by Cheng et al. [19],
sparsity preserving projections by Qiao et al.[20], and a
rep-resentation model by prototype together with variation for
sparsity based face recognition[21]. Studies also show that the
classification accuracy can be also improved by using virtual
samples [12,22,23]. All of these are trying to improve the
convinced that sparsity plays a paramount role in robust image classification for face recognition.
2.2. Collaborative representation based classification
Collaborative representation based classification (CRC) was proposed as an improvement and replacement of SRC by
Lei Zhang et al.[9,24,25]. It's approved that most literature on
SRC, including[8], may emphasize too much on the
signifi-cance of l1-norm sparsity in image classification, while the
role of collaborative representation (CR) is somehow ignored
[9]. As we know that CR is involving all contribution from
every single training sample to represent the test sample y.
Because it's fact that different face images share some
com-mon features helpful for classification, which is called nonlocal sample. CRC can learn this nonlocal strategy to output more robust face recognition.
Let us note X¼ ½X1;X2;…;XC2ImN, and then the test
sampley2Imcan be represented with:
y¼a1x1þa2x2þ/þaNxN: ð6Þ
And then use the regularized least square method to
collaboratively represent the test sample using X with low
computational burden. That is:
b
b¼arg minbkyX$bk22þl$kbk22; ð7Þ
wherelis a regularization parameter, which makes the least
square solution stable and introduces a better enough sparsity
to the solution thanl1-norm. So the solution of CR in (7) can
be derived as: b
b¼ ðXT$Xþl$IÞ1XT: ð8Þ
Let P¼ ðXT$þl$IÞ1
XT, so that we can just simply
project the test sampleyontoPand get this formula:
b
b¼P$y: ð9Þ
At this step, the classification is performed based on the
coefficient bb with the class specific representation residual
yXi$bbi. Hereby bbi is the coefficient vector related with
classiand computed with:
b
bi¼ X
Xi$bai; ð10Þ
where bai is the coefficient vector to one single sample
belonging to the same class, which is used in SRC [8] to
perform classification.
So that it computes the regularized residuals by: rcrc¼yXi$bbi2
.b
bi2: ð11Þ
Finally, it outputs the identity of the test sampleyas:
identityðyÞ ¼arg minifrcrc;ig: ð12Þ In this way, CRC involves all training samples to represent the test sample, which is considered as an improvement to
conventional SRC[9,24,25]. Also, there are a host of methods
proposed to optimize CRC. Zhang et al. proposed to inte-grating globality from other samples with locality in current
sample to generate robust classification[26]. Xu et al. applied
transfer learning algorithm into sparse representation [27].
Fusion of multiple classifiers is also applied in CRC[28]. And
recently CRC was reinterpreted with a probabilistic theory
[29]. CRC still has large space to improve, especially on the
collaborative coefficient for test sample. 3. Our method
Based on nearest feature line (NFL) and nearest feature
plane (NFP) [30,31], we can calculate the sum of
represen-tation coefficients from all samples in one class and use them to represent to weight of one class. Then the test sample is classified into one class with maximal weight value. The greater the sum value is, the more contribution is produced from that class.
From the procedures of SRC and CRC, We can infer thatl2
-norm sparse coefficient bbi2 contains some crucial
discrim-ination clue for classification. In order to generate a more promising result, this is probably a candidate part where we should pay more efforts to. Here comes our proposed method: firstly using absolute value of coefficient instead of original value to obtain the distance between the test sample and each class, and then integrating the distance vector with the one from CRC for classification. Hereafter the schema of proposed AbsCRC is demonstrated.
3.1. Solving distance with the absolute values
Instead of directly solving coefficientbbifor each class with
the sum of all coefficients from all samples with (10), we turn to sum absolute value of all coefficients to calculate the whole distance between the test sample and the class:
di¼ X
jbaij: ð13Þ And this distance vector can used to identify a class most relevant with the test sample. In this distance vector, however, the bigger value indicates the test sample is more relevant with the class represented by the training samples. So that the role
by this absolute distance vectordiis opposite with the one by
collaborative representation residualsri.
For comparison, we here use the maximal value in this
vector to identify a class most relevant with the test sampley:
identityðyÞ ¼arg maxifdig: ð14Þ However, when the new residuals are used to directly perform classification, robust classification cannot be ob-tained. This was demonstrated in our experiments, as shown in
Section5.
3.2. Integrating absolute residuals with original ones
While using absolute residuals alone cannot produce a
integrating absolute with original residuals can bring a more promising reaction. In the integration, the residuals by CRC is integrated with the absolute distance vector by different
weightsaandbrespectively. Therefore, we can obtain the new
residuals with:
ri¼a$rcrc;ib$di: ð15Þ
It's noted that usuallya can be assigned value of 1, that is
a¼1, for simplicity. And then using different value ofb can
still reflect the weight of absolute distance. Furthermore, since the absolute distance plays an opposite role in classification, in (15) we use subtraction to combine the absolute distance.
Finally, it outputs the identity of the test sampleywith the
new residuals:
identityðyÞ ¼arg minifrig: ð16Þ 4. Analysis
In this section, we use some experiment cases to demon-strate the rationale and effects of our proposed AbsCRC method. Indeed, the absolute distance vector alone does not bring good enough helps on image classification or face recognition, by which the classification results can not match the results by conventional CRC in most cases. However, when integrating the absolute distance vector with the
re-siduals from CRC, the fusion residuals can produce
outstanding classification results.
The absolute distance vector may help stabilize the repre-sentation coefficients by CRC. This is the most crucial contribution in our AbsCRC method. On the other hand, the fusion process is affected by the selection of weighted factors
b. So our second effort is to find out optimized weighted
factors for robust image classification or face recognition.
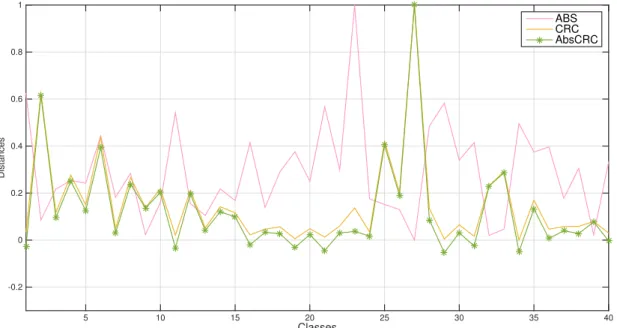
Fig. 1 shows the CRC residuals, absolute distances and fusion residuals in one experiment case, which was run on ORL face database with first 6 images as training samples and
the rest as test samples (Seesubsection 5.3). And this group of
residuals are for a test sample at number 113 position, which is the first test sample of twenty-ninth class (number 4 *
28þ1 ¼113 sample). We can see from the Fig. 1 that the
fusion residuals (green) are affected by the absolute distance vector and slightly flatter than the original residuals by con-ventional CRC (yellow).
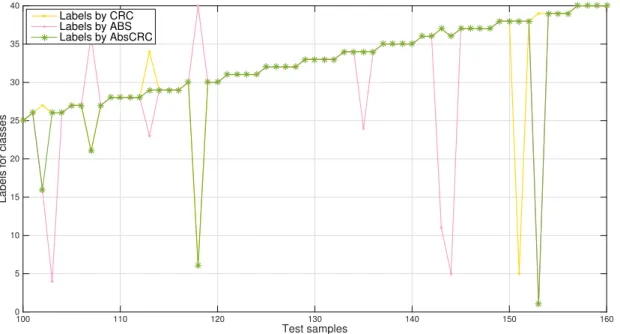
In this experiment case, with factor ofb ¼0.1 (See Table
3), both CRC and ABS were failed to classify the number
113 test sample into a right class, while only AbsCRC
pro-duced a right answer, as shown inFig. 2.
Consequently, our experiments have taken into account the
weighted factorb for different classification cases. And in a
glut of benchmark datasets, we are managed to choose a group of parameters that help AbsCRC generate an optimized result.
The next Section 5 will demonstrate all the experimental
results.
5. Experimental results
In this section, we will demonstrate our experimental re-sults on some popular visual benchmark datasets. Extensive experiments were conducted on these datasets to evaluate the classification accuracy of conventional CRC, absolute distance only (ABS) and our AbsCRC method, as well as the selections
of fusion factors a and b. The chosen benchmark datasets
include Caltech Faces [32], Caltech Leaves [32], ORL[33],
FERET[34], CMU Faces[35], and Senthil IRTT Face
Data-base[36].
On each benchmark database, we respectively run experi-ments with different number of training samples, as well as
different integration factors a andb. For simplicity, we keep
a¼1 and use different value ofbto reflect the weights of two
coefficients. In our experiments, we found that when CRC
outperforms ABS, it's better to assign a value less than one to
b, that isb<1; on the contrary, usuallyb>1 usually produces
more pleasuring result when ABS outperforms CRC. How-ever, there are still some exceptional experiments cases. So our
experiments also paid efforts to seek a optimal fusion factorb.
The following subsections will demonstrate the samples, steps, factors and results in every experimental case, as well as our discussion on the results. The experimental results indicate that in most cases the AbsCRC is managed to produce higher accuracy of classification than CRC.
5.1. Experiments on Caltech Faces dataset
The Caltech Faces dataset is a frontal face dataset collected
by Markus Weber at California Institute of Technology [32].
There are 450 facial images in this dataset, which is all in size of 896*592 pixels and JPEG format. These pictures were taken from 27 or so unique people under with different lighting, expressions and backgrounds. We resized each image into half-scale of 488*296 pixels to reduce computing complexity. Furthermore, we selected only 19 subjects with more that 10 samples in our experiments to fulfill the exper-imental requirements that there are 8 training samples at least in every subject. In out experiments, however, it is not necessary to use all three dimensions data in these colored images. Therefore we converted these original colored images to gray scale before running our tests.
For each subject, we successively took 1 to 8 face images as training samples and the rested as test samples. We evaluated the wrong classification rates of CRC, ABS and AbsCRC
algorithms, as well as different weight factor b. The
classifi-cation results are shown in Table 1. In most experimental
cases, AbsCRC unexpectedly outperformed CRC in this dataset. The error rates by ABS only are also listed in the table for comparison. The most promising case is the one using 7
training samples andb¼0.2, in which AbsCRC outperforms
both CRC and ABS and the error rate drops down to 33.33%. On the whole, experimental results on this dataset demon-strated that our AbsCRC gained an excellent improvement onto conventional CRC in image classification.
5.2. Experiments on Caltech Leaves dataset
Caltech Leaves dataset[32]is also taken around Caltech by
Markus Weber from California Institute of Technology. There are 186 images of leaves against different backgrounds and with approximate scale normalization. All images are also in JPEG format and in size of 896*592 pixels as well. We again resized them to half scale. At this time, we selected only 7 subjects with more that 10 samples in our experiments so that Fig. 2. Labels classified for a test sample in ORL face database.
Table 1
Improvements to CRC on Caltech Faces dataset.
Trainings b Error rates Improvements CRC ABS AbsCRC ZCRC ZABS 1 0.6 0.8480 0.8363 0.8363 1.38% 0.00% 2 0.001 0.6908 0.7368 0.6908 0.00% 6.25% 3 0.6 0.6767 0.6767 0.6617 2.22% 2.22% 4 10 0.6579 0.6140 0.6140 6.67% 0.00% 5 1.5 0.5368 0.5263 0.4632 13.73% 12.00% 6 0.4 0.4211 0.4868 0.4079 3.13% 16.22% 7 0.2 0.3509 0.4912 0.3333 5.00% 32.14% 8 0.001 0.3421 0.4474 0.3421 0.00% 23.53%
there are 8 training samples at least in every subject. Because it is not necessary to use all three dimensions data in these colored images, we converted these original colored images to gray scale before running our tests.
The results for this group of experiments are shown in Table 2. In this non-facial dataset, AbsCRC again generated amazing results. As we known that CRC is a method specific for face recognition, so it fell behind ABS in almost all cases. However, AbsCRC is managed to produce a more pleasuring accuracy in many cases. The most promising case
is the one using 8 training samples and b ¼ 0.2, in which
AbsCRC outperforms both CRC and ABS by 16.67% and the error rate drops down to the lowest level of 35.71% (See the last row with start mark). This group of experiments demonstrated that AbsCRC works well in non-facial image classification.
5.3. Experiments on ORL face database
ORL face database [33]is a small database that includes
only 400 facial images taken from 40 folks and every single class provides only 10 distinct face images. The facial images were captured at different conditions for every subject like times, lighting, facial expressions (open or closed eyes, smil-ing, or not smiling), and facial details (glasses or no glasses). Besides, these images were taken against a dark consistent background while the folks were in an upright, frontal posi-tion. For simplicity, we resized all the face images to 56*46 pixels. We designedly renamed all image files to filenames with ordered numbers in 3 digits, which are elegant to reflect the right position of classes in experiments.
We respectively took first 1 to 8 picture(s) of each subject as source training samples and used the other face images as test samples. We evaluated the classification failure rates by all algorithms. The classification results are outstanding and in a
very low error rates.Table 3 shows the detailed error rates as
well as the improvements by three algorithms. The most promising result to AbsCRC was generated on the case of using 8 training samples, in which AbsCRC outperformed
CRC up to 50.00% whenb ¼1.3. And the classification
ac-curacy reaches an amazing level of 95.00%. Furthermore, AbsCRC produces higher accuracy on all cases with at least 4 training samples.
5.4. Experiments on FERET face database
The FERET benchmark database[34]is one of the biggest
visual databases. In FERET database, each subject has a group of five to eleven images including two frontal views (fa and fb) and one more frontal image by a different facial expression. We chose to test on 200 subjects in the database, which means this group of experiments were running on a scale of 1400 face images and seven samples in each subject. In our experiments, all images are renamed to an ordered number filename. With this type of ordered number filenames, we can easily figure out the right answer in the classification algorithm.
Since there are only 7 samples in each subject, we respectively used first 1 to 5 images as training samples and the remaining images as test samples. This group of experi-ments generated a pleasure classification results. Though the improvement by the new algorithm is not so outstanding as that on the other databases, AbsCRC still slightly outperforms conventional CRC. The detailed improvements by AbsCRC
are shown in Table 4. We can see that AbsCRC still
out-performed CRC up to 7.14% when using 5 training samples
withb ¼0.4. And the error rate on classification is at a very
low level of 29.25%.
5.5. Experiments on CMU face images
The CMU face images[35]consists of 640 black and white
face images of people taken with varying pose (straight, left, right, up), expression (neutral, happy, sad, angry), eyes (wearing sunglasses or not), and size. All images are in PGM format and grouped by the name of specific subject. There are 20 subjects in total and up to 96 images in some subjects, while some subjects contains only images less than others. So Table 2
Improvements to CRC and ABS on Caltech Leaves dataset.
Trainings b Error rates Improvements CRC ABS AbsCRC ZCRC ZABS 1 0.001 0.6349 0.6349 0.6349 0 0 2 0.1 0.5893 0.5893 0.5714 3.03% 3.03% 3 0.001 0.5714 0.5918 0.5714 0 3.45% 4 0.1 0.5714 0.6429 0.5476 4.17% 14.81% 5 1.1 0.5714 0.5143 0.5143 10.00% 0 6 100 0.5714 0.3929 0.3929 31.25% 0 7 2.0 0.5238 0.4286 0.4286 18.18% 0 8 0.2 0.4286 0.4286 0.3571 16.67% 16.67% Table 3
Improvements to CRC and ABS on ORL face database.
Trainings b Error rates Improvements CRC ABS AbsCRC ZCRC ZABS 1 0.001 0.3194 0.3278 0.3194 0 2.54% 2 0.001 0.1656 0.1938 0.1656 0 14.52% 3 0.001 0.1393 0.1786 0.1393 0 22.00% 4 0.2 0.1083 0.1500 0.1042 3.85% 30.56% 5 0.2 0.1150 0.1500 0.1050 8.70% 30.00% 6 0.9 0.0813 0.1250 0.0688 15.38% 45.00% 7 0.7 0.0833 0.0917 0.0750 10.00% 18.18% 8 1.3 0.1000 0.0625 0.0500 50.00% 20.00% Table 4
Improvements to CRC and ABS on FERET face database.
Trainings b Error rates Improvements CRC ABS AbsCRC ZCRC ZABS 1 0.001 0.5567 0.5783 0.5567 0 3.75% 2 0.4 0.4160 0.4340 0.4070 2.16% 6.22% 3 1.8 0.5563 0.5563 0.5288 4.94% 4.94% 4 0.2 0.4467 0.4800 0.4367 2.24% 9.03% 5 0.4 0.3150 0.3600 0.2925 7.14% 18.75%
we chose to select 54 images that exist in all subjects as
experimental samples. That means there are 20*54 ¼ 1080
images used in this group of experiments.
In this group of experimental cases, we still took first 1 to 8 images as training samples and the rest images as test samples. Table 5shows the detailed results of classification. The most
promising case is the one with 7 training samples andb¼0.1.
Though AbsCRC only outperforms CRC by 4.55%, the clas-sification accuracy reaches 91.06%. We can see that ABS alone did not perform as well as CRC, but it pushes CRC up to a higher level by a simple fusion.
5.6. Experiments on Senthil IRTT face database
The Senthil IRTT Face Database Version1.2[36]contains
both color and gray scale faces from IRTT students. There are 100 facial images for 10 IRTT young female students around
23e24 years, and each has 10 facial samples. The color
im-ages along with background are captured with a pixel
reso-lution of 480*640 and their faces are cropped to 100 100
pixels. All facial images are labeled with the number of sub-ject and sample. This database is relatively smaller than others, so that the experiments run fast.
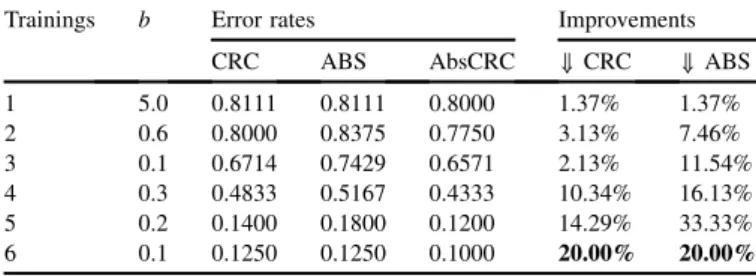
Using 1 to 8 training samples, our experiments run fast and smoothly. The most promising case for AbsCRC is the one
using 6 training samples withb¼0.1. The improvement rate
from AbsCRC to CRC and ABS reaches 20% and the classi-fication accuracy reaches a high level of 90.00%. Again, though not performing as well as CRC, ABS pushes CRC up to higher level with fusion.
5.7. Discussion
In the all 6 datasets, there are 5 facial datasets and one non-facial datasets. The experiments showed that integrating ABS into face recognition method CRC helps improve the classi-fication robustness of CRC, which is effective in both facial and non-facial image classification. Besides we can find some other useful hints for image classification when applying ab-solute distance in collaborative representation.
Absolute distance based classification might be not stable
enough in face recognition. As shown in the detailed results
fromTables 1, 3e6, the results by ABS in most cases did not
match the ones by original CRC. WhileTable 2demonstrated
that ABS works better than CRC on non-facial image classification.
The number of training samples still matters.As shown in
Tables 1e6, the more training samples we used in classifica-tion, the higher classification accuracy we can obtain. This is truth in both facial and non-facial datasets.
One-training-sample issues exists as usual. Almost in all
face databases, the results when using only one training sample are usually at the lowest accuracy, even some of them produced zero improvement. Such unstable only-one-training-sample case is an common issue in face recognition, but it can
be mitigated with a host of methods, like [22,37,38] and so
forth.
6. Conclusion
This paper proposed a novel absolute collaborative repre-sentation based classification (AbsCRC) method for robust image classification. When solving the representation coeffi-cient CRC, we calculate the sum of the absolute distance between the test sample and the training samples at the same time. And then this absolute distance vector is integrated with original collaborative coefficient to generate a more promising
classification. In the fusion, a tuned factor b is involved to
adjust the weights from both distance vectors to output the best classification. Extensive experiments were conducted on a couple of facial and non-facial benchmark databases, and the results demonstrate that AbsCRC outperforms state-of-the-art CRC in most of cases.
Acknowledgment
This work was supported in part by Research Foundation of Education Bureau of Guangdong Province of China (Grant No. A314.0116), Scientific Research Starting Foundation for Ph.D. in Huizhou University (Grant No. C510.0210), National Natural Science Foundation of China (Grant No. 61502208) and Natural Science Foundation of Jiangsu Province of China (Grant No. BK20150522).
References
[1] S.Z. Li, Encyclopedia of Biometrics: I-Z, vol. 1, Springer Science & Business Media, 2009.
[2] Z. Fan, Y. Xu, D. Zhang, Neural Netw. IEEE Trans. 22 (7) (2011) 1119e1132.
Table 5
Improvements to CRC and ABS on CMU face images.
Trainings b Error rates Improvements CRC ABS AbsCRC ZCRC ZABS 1 0.001 0.2896 0.3094 0.2896 0 6.40% 2 0.1 0.2923 0.3115 0.2904 0.66% 6.79% 3 0.001 0.3098 0.3176 0.3098 0 2.47% 4 0.1 0.1390 0.2130 0.1320 5.04% 38.03% 5 0.1 0.1398 0.2306 0.1327 5.11% 42.48% 6 0.1 0.1427 0.2365 0.1375 3.65% 41.85% 7 0.1 0.0936 0.3011 0.0894 4.55% 70.32% 8 0.01 0.0913 0.3467 0.0902 1.19% 73.98% Table 6
Improvements to CRC and ABS on Senthil IRTT face database. Trainings b Error rates Improvements
CRC ABS AbsCRC ZCRC ZABS 1 5.0 0.8111 0.8111 0.8000 1.37% 1.37% 2 0.6 0.8000 0.8375 0.7750 3.13% 7.46% 3 0.1 0.6714 0.7429 0.6571 2.13% 11.54% 4 0.3 0.4833 0.5167 0.4333 10.34% 16.13% 5 0.2 0.1400 0.1800 0.1200 14.29% 33.33% 6 0.1 0.1250 0.1250 0.1000 20.00% 20.00%
[3] J. Chen, S. Shan, C. He, G. Zhao, M. Pietik€ainen, X. Chen, W. Gao, Pattern Anal Mach. Intell. IEEE Trans. 32 (9) (2010) 1705e1720. [4] X. Hong, G. Zhao, M. Pietikainen, X. Chen, Image Process. IEEE Trans.
23 (6) (2014) 2557e2568.
[5] Y. Xu, X. Li, J. Yang, Z. Lai, D. Zhang, Cybern. IEEE Trans. 44 (10) (2014) 1738e1746.
[6] Y. Pang, X. Li, Y. Yuan, D. Tao, J. Pan, Inf. Forensics Secur. IEEE Trans. 4 (3) (2009) 441e450.
[7] Y. Xu, Q. Zhu, Z. Fan, D. Zhang, J. Mi, Z. Lai, Inf. Sci. 238 (2013) 138e148.
[8] J. Wright, A.Y. Yang, A. Ganesh, S.S. Sastry, Y. Ma, Pattern Anal Mach. Intell. IEEE Trans. 31 (2) (2009) 210e227.
[9] L. Zhang, M. Yang, X. Feng, Sparse representation or collaborative representation: which helps face recognition?, in: Computer Vision (ICCV), 2011 IEEE International Conference on, IEEE, 2011, pp. 471e478.
[10] W. Gao, S. Shan, X. Chai, X. Fu, Virtual face image generation for illumination and pose insensitive face recognition, in: Multimedia and Expo, 2003. ICME’03. Proceedings. 2003 International Conference on, Vol. 3, IEEE, 2003. IIIe149.
[11] N.P.H. Thian, S. Marcel, S. Bengio, Improving face authentication using virtual samples, in: Acoustics, Speech, and Signal Processing, 2003. Proceedings. (ICASSP’03). 2003 IEEE International Conference on, Vol. 3, IEEE, 2003. IIIe233.
[12] Y. Xu, Z. Zhang, G. Lu, J. Yang, Pattern Recognit. 54 (2016) 68e82. [13] Y. Xu, B. Zhang, Z. Zhong, Pattern Recognit. Lett. 68 (2015) 9e14. [14] W. Li, Q. Du, B. Zhang, Pattern Recognit. 48 (12) (2015) 3904e3916. [15] Z. Xu, H. Zhang, Y. Wang, X. Chang, Y. Liang, Sci. China Inf. Sci. 53 (6)
(2010) 1159e1169.
[16] A.Y. Yang, Z. Zhou, A.G. Balasubramanian, S.S. Sastry, Y. Ma, Image Process. IEEE Trans. 22 (8) (2013) 3234e3246.
[17] S. Gao, I.W.-H. Tsang, L.-T. Chia, Kernel sparse representation for image classification and face recognition, in: Computer VisioneECCV 2010, Springer, 2010, pp. 1e14.
[18] M. Yang, L. Zhang, Gabor feature based sparse representation for face recognition with gabor occlusion dictionary, in: Computer
Vision-eECCV 2010, Springer, 2010, pp. 448e461.
[19] B. Cheng, J. Yang, S. Yan, Y. Fu, T.S. Huang, Image Process. IEEE Trans. 19 (4) (2010) 858e866.
[20] L. Qiao, S. Chen, X. Tan, Pattern Recognit. 43 (1) (2010) 331e341. [21] W. Deng, J. Hu, J. Guo, In defense of sparsity based face recognition, in:
Proceedings of the IEEE Conference on Computer Vision and Pattern Recognition, 2013, pp. 399e406.
[22] Y. Xu, X. Zhu, Z. Li, G. Liu, Y. Lu, H. Liu, Pattern Recognit. 46 (4) (2013) 1151e1158.
[23] Z. Liu, X. Song, Z. Tang, Neural Comput. Appl. 26 (8) (2015) 2013e2026.
[24] L. Zhang, M. Yang, X. Feng, Y. Ma, D. Zhang, Collaborative represen-tation based classification for face recognition, arXiv preprint arXiv: 1204.2358.
[25] X. Chen, P.J. Ramadge, Collaborative representation, sparsity or nonlinearity: what is key to dictionary based classification?, in: Acous-tics, Speech and Signal Processing (ICASSP), 2014 IEEE International Conference on, IEEE, 2014, pp. 5227e5231.
[26] Z. Zhang, Z. Li, B. Xie, L. Wang, Y. Chen, Math. Probl Eng. (2014). [27] Y. Xu, J. Wu, X. Li, D. Zhang, et al., Image Process. IEEE Trans. 25(2). [28] Y. Peng, Z. Pan, Z. Zheng, X. Li, Int. J. Database Theory Appl. 9 (2)
(2016) 183e192.
[29] S. Cai, L. Zhang, W. Zuo, X. Feng, A probabilistic collaborative repre-sentation based approach for pattern classification, in: IEEE Conference on Computer Vision and Pattern Recognition, CVPR, 2016.
[30] Q. Feng, J.-S. Pan, L. Yan, J. Inf. Hiding Multimed. Signal Process 3 (3) (2012) 297e305.
[31] Q. Feng, C.-T. Huang, L. Yan, J. Inf. Hiding Multimed. Signal Process 4 (3) (2013) 178e191.
[32] M. Weber, Caltech datasets, http://www.vision.caltech.edu/html-files/ archive.html. online; (Accessed 7 June 2016).
[33] A.L. Cambridge, The orl database of faces, http://www.cl.cam.ac.uk/ research/dtg/attarchive/facedatabase.html. online; (Accessed 17 May 2016). [34] T. N. I. of Standards, T. (NIST), The color feret database,http://www.
nist.gov/itl/iad/ig/colorferet.cfm. online; (Accessed 17 May 2016). [35] T. Mitchell, Cmu face images,
https://archive.ics.uci.edu/ml/machine-learning-databases/faces-mld/faces.html, online; (Accessed 9 June 2016). [36] Senthilkumar, Senthil IRTT face database version 1.2, http://www.
geocities.ws/senthilirtt/Senthil%20IRTT%20Face%20Database% 20Version%201.2, online; (Accessed 17 May 2016).
[37]D. Beymer, T. Poggio, Face recognition from one example view, in: Computer Vision, 1995. Proceedings., Fifth International Conference on, IEEE, 1995, pp. 500e507.
[38]T. Vetter, Int. J. Comput. Vis. 28 (2) (1998) 103e116.
Mr. Shaoning Zeng received his M.S. degree in Software Engineering from Beihang University, Bei-jing, PR China, in 2007. Since 2009, he has been a lecturer at Huizhou University, PR China. His current research interests include pattern recognition, sparse representation, image recognition and neural network.
Dr. Xiong Yangreceived his B.S. degree in Computer Science and Technology from Hubei Normal Univer-sity, PR China, in 2002. He received the M.S. degree in Computer Science from Central China Normal University, PR China, in 2005 and the Ph.D. degree at Institute for Pattern Recognition and Artificial Intel-ligence, Huazhong University of Science and Tech-nology, PR China, in 2010. Since 2010, he has been teaching in the Department of Computer Science and Technology, Huizhou University, PR China. His cur-rent research interests include pattern recognition and machine learning.
Dr. Jianping Goureceived the BS degree in computer science from Beifang University of Nationalities, China in 2005, the MS degree in computer science from the Southwest Jiaotong University, China in 2008, and the PhD degree in computer science from University of Electronic Science and Technology of China, China in 2012. He is currently a lecturer in School of Computer Science and Telecommunication Engineering, JiangSu University, China. His current research interests include pattern classification, ma-chine learning. He has published over 20 technical articles.
Jiajun Wenreceived the Ph.D. degree in computer science and technology from Harbin Institute of Technology, China, in 2015. He has been a Research Associate with the Hong Kong Polytechnic University, Hong Kong, since 2013. He is currently a Postdoctoral Fellow with the College of Computer Science & Software Engineering, Shenzhen University, Shenz-hen, China. His research interests include pattern recognition and video analysis.