East Tennessee State University
Digital Commons @ East
Tennessee State University
Electronic Theses and Dissertations Student Works
8-2019
Is Corequisite Developmental Math Effective at
East Tennessee State University?
Christine Padden
East Tennessee State University
Follow this and additional works at:https://dc.etsu.edu/etd
Part of theEducational Assessment, Evaluation, and Research Commons, and theOther Statistics and Probability Commons
This Thesis - Open Access is brought to you for free and open access by the Student Works at Digital Commons @ East Tennessee State University. It has been accepted for inclusion in Electronic Theses and Dissertations by an authorized administrator of Digital Commons @ East Tennessee State University. For more information, please contactdigilib@etsu.edu.
Recommended Citation
Padden, Christine, "Is Corequisite Developmental Math Effective at East Tennessee State University?" (2019).Electronic Theses and Dissertations.Paper 3606. https://dc.etsu.edu/etd/3606
Is Corequisite Developmental Math Effective at East Tennessee State University?
A thesis presented to
the faculty of the Department of Mathematics East Tennessee State University
In partial fulfillment
of the requirements for the degree Master of Science in Mathematical Sciences
by
Christine Padden August 2019
Daryl Stephens, Ph.D., chair Anant Godbole, Ph.D.
Bob Price, Ph.D.
ABSTRACT
Is Corequisite Developmental Math Effective at East Tennessee State University? by
Christine Padden
This thesis looks at the corequisite developmental math program at East Tennessee State University (ETSU) and compares the effectiveness to the previous develop-mental math program at ETSU by comparing the student outcomes in MATH 1530. MATH 1530 is a non-calculus based statistic and probability course that satisfies most majors’ general education math requirements. ETSU sees approximately 1,000 students a year pass through MATH 1530 which is around 6.7% of the total enroll-ment at ETSU[9]. We are interested in the last five years of the developenroll-mental math program before it was changed to corequisite developmental math and the first five years of corequisite developmental math program. Our research compares the grades of the students in these courses to evaluate if one program is more successful in stu-dents’ grade outcomes. Our findings show no change in class medians but a change in the class means in favor of the corequisite developmental math program.
Copyright by Christine Padden 2019 All Rights Reserved
ACKNOWLEDGMENTS
I would like to acknowledge my committee members and the wonderful professors in the math department at ETSU. This department is full of kind, caring folks that made my time here memorable. A special thank you to Rebecca Rasnick for all of her help and guidance throughout the year. You are amazing.
I do not know if I would have made it through this graduate program without the never ending support and love of my wonderful partner, Andrew Taylor. Thank you for feeding me, making sure I didn’t stink, and always pushing me to succeed. This degree was only possible because of you!
TABLE OF CONTENTS
ABSTRACT . . . 2
ACKNOWLEDGMENTS . . . 4
LIST OF FIGURES . . . 6
1 INTRODUCTION . . . 7
2 HISTORY OF DEVELOPMENTAL MATH AT ETSU . . . 10
3 IMPLEMENTATION OF LEARNING SUPPORT AT ETSU . . . . 14
4 METHODS . . . 16
5 RESULTS . . . 17
6 DISCUSSION AND CONCLUSION . . . 31
7 CONTINUED WORK . . . 33
BIBLIOGRAPHY . . . 34
LIST OF FIGURES
1 Histogram of DSPM 0850 Grades . . . 17
2 BarPlot of MATH 1530 Grades After DSPM 0850 . . . 18
3 Bar Plot of Female and Male MATH 1530 Grades After DSPM 0850 . 19 4 Scatterplot of MATH 1530 Students After Taking DSPM 0850 and ACT Scores . . . 20
5 Scatterplot of DSPM 0850 Grades and Calculus Grades . . . 21
6 Distribution of DSPM Students by Major . . . 22
7 Histogram of Corequisite MATH 1530 Grades . . . 23
8 Bar Plot of Corequisite Developmental Math Grades by Gender . . . 24
9 Scatterplot of Corequisite MATH 1530 Grades and ACT Scores . . . 25
10 Scatterplot of Corequisite MATH 1530 Grades and Calculus Grades . 26 11 Distribution of Corequisite Developmental Math Students by Major . 27 12 Percentage of Grade Distribution of MATH 1530 Students . . . 28
13 Percentage of Grade Distribution of Corequisite MATH 1530 Students 28 14 Chi-Squared Residual Plot of DSPM Math 1530 and Corequisite MATH 1530 Grades . . . 30
1 INTRODUCTION
The Higher Education Act of 1965, which enacted many of the federal student aid programs we still have today, made college readily accessible to students that did not have the prior financial means to attend college[12]. With this influx of students also came new hurdles for universities and community colleges. One such hurdle that colleges faced was the amount of incoming students that were not prepared for the rigor of college-level courses. To combat this, universities and community colleges throughout the nation have adopted some form of developmental or remedial program for students with a goal to prepare them to be successful in college level coursework. On a national level during the 2105-16 school year, 43.9% of students at public universities and community colleges reported that they took at least one developmen-tal course after high school and when looking at only public universities, excluding community colleges, the percentage that took at least one developmental course after high school was 30.9%[15]. The demographics of developmental studies programs are diverse. Students come from various socio-economic backgrounds and span a large age range. This is not an underrepresented group issue; it spans across the United States and varies from region to region[2]. The Tennessee State Board of Regents (TBR) institutions report that about 60% of incoming students were deemed not likely to be successful in college level courses with the math, reading, and/or writing skills they currently held when starting college at a TBR institution[17].
East Tennessee State University, which is classified as a doctoral university, high research center[5],offers bachelor degrees through PhD degrees and has twelve colleges and schools working within it[9]. ETSU is a public university with its main campus
located in Johnson City Tennessee. As of May 2017, ETSU is governed by an insti-tutional board of trustees. Prior to that ETSU was a TBR institution. The fall 2018 total enrollment at the University was 14,574 people, which is a slight decrease from the previous spring semester which was 14,608[9]. ETSU has been offering some form of developmental math since 1985 and this thesis will compare the outcomes from the last five years of developmental support math courses to the most current five years of corequisite developmental support math classes at ETSU, specifically looking at the outcomes of developmental math students in Math1530 which is required for most majors at East Tennessee State University.
In 1984, Tennessee State Board of Regents (TBR) implemented a developmental and remedial studies program to satisfy the Comprehensive Education Reform Act of 1984 passed by Tennessee state legislators and to further satisfy legal disputes con-cerning discrimination against African American students in Tennessee and other at-risk students, specifically requiring promoting retention of students in developmental programs, as well as, a comprehensive review and implementation of developmen-tal studies programs within one year at public institutions [1]. During 1984, TBR wrote the White Paper on Remedial and Developmental Studies, commonly called the White Paper. This paper outlined an approach to designing developmental stud-ies programs for TBR institutes, which included, clear and measurable objectives, curriculum, policies, mandatory assessments and placements of students, program evaluation, and staff training[1]. The White Paper also defined the terms remedial and developmental, where remedial is defined as the basic skills needed to graduate from high school and developmental as the needed skills to be successful in college[1].
TBR institutions were to follow guidelines for assessing incoming students. Part of those guidelines stated that schools were to use more than one way to assess incoming students’ math abilities. As part of the admissions process, TBR required all students applying to a TBR college to provide ACT or SAT scores if they were under 21 years old. If the student’s composite ACT score was 15 or lower the student would take a placement exam. This was also the case for students older than 21 since ACT/SAT scores past five years were not considered. The Academic Assessment and Placement Program(AAPP), which was used for initial screening of incoming students whose ACT/SAT scores were below 16, was a 3-part math assessment but students were only required to take two sections. There are two other parts to the AAPP, one for writing and the other for reading comprehension but we are only concerned with the math sections. One section covered basic arithmetic skills with computations of whole numbers, fractions, and integers. The second section tested over elementary algebra which covered computations of roots, powers, algebraic inequalities and equations involving operations with expressions. The third section tested intermediate algebra skills which included solving equations and inequalities, the coordinate plane and graphs. Prior education and grades would be considered, as well as, major and career goals to determine what course to enroll incoming students in[1].
2 HISTORY OF DEVELOPMENTAL MATH AT ETSU
To satisfy the needs of incoming students who were not testing into college level math, East Tennessee State University implemented developmental math program to help students achieve the math skills that they needed to be successful in future classes. This program started in 1985 following mandates from TBR, Tennessee state legislation, and findings outlined in the White Paper on Remedial and Developmental Studies[1]. The offering of developmental courses stemmed from the idea that the courses would benefit the student by preparing them with the skills they needed to be successful in college level classes. Developmental studies programs include advisers, staff, and faculty to assist students through the program for a seamless transition into college level classes while raising academic competencies and reaching the ultimate goal of graduation[8].
At ETSU, incoming students had the option to use their ACT/SAT scores if they were 21 years old or younger along with high school transcripts, and if needed, a formal assessment to place them into the appropriate math class for their abilities. The formal assessment has changed over the years, TBR institutions were using the AAPP test from 1985 to 1992, and then switched to the Computer Adaptive Assessment and Support System or COMPASS test, which was an adaptive computerized assessment that was eventually phased out by Fall of 2017 because it was shown to be ineffective at placing students[10], and then switched to the ACCUPLACER test, which is also a computerized assessment tool, to place students. Since the ACCUPLACER test has been implemented so recently, Fall of 2017, we do not have data on its effectiveness in placing students into developmental math programs. Similar to the COMPASS exam,
the ACCUPLACER does not allow students to use calculators during the exam which can lead to poor scores due to basic math mistakes ultimately placing students in low-level math courses[4]. Naturally, these standardized tests have evolved from paper tests to computerized tests over time.
At ETSU the standardized assessment, currently the ACCUPLACER, is used for students who do not have ACT or SAT scores or the scores are more than five years old. Students who score below a 92 on the math portion of the test are placed into the developmental math program. Students can also use the ACCUPLACER to challenge the placement they received from their ACT/SAT scores and high school transcripts. An ACT composite score of 26 or higher or a composite score of 1170 or more on the SAT will exempt a student from developmental programs even if their subsection scores are lacking. Likewise, if a student’s composite scores are less then what was previously stated, the school considers the subsection scores as follows: if a student’s scores less than a 19 on the math section of the ACT and less than 500 on the math portion of the SAT, they are placed in learning support math or they then have the option to challenge their placement with the ACCUPLACER test where they must score a 92 or above to place out of learning support math[14]. For some years students at ETSU were also able to take a diagnostic test the first day of class; if they passed the diagnostic test they could move on to the next math course. This test acted to catch any student who should actually be in a higher level class but placed into a lower level class by their ACT/SAT scores or formal assessment scores. I did speak with a few professors about the diagnostic tests and they all agreed that very few people ever passed the test on the first day. When interviewing Dr. Stephens, he
mentioned that four students in ten years of teaching developmental math passed the diagnostic test in his class.
ETSU offered Elementary Algebra DSPM 0800 and Intermediate Algebra DSPM 0850 as developmental support math courses to students placed in developmental math. These courses did count towards enrollment credit hours, for financial aid, and for sports eligibility but they did not count as college credit on transcripts or towards credits for graduation[1]. When a student takes a developmental course at ETSU they have two GPAs on their ETSU record, one with developmental courses, which is used for determining academic standing, and the other as the official GPA for applying to programs and for transcripts. These courses still bear the same price tag as college-level course although they do not count as college credit. The majority of students at ETSU are required to take MATH 1530 as part of their major require-ments. MATH 1530 is a 3-credit hour statistics and probability course(non calculus) that requires students to have completed two years of high school algebra and have passing placement scores or to have successfully completed MATH 0850 before being eligible to take this course[7]. This course is one of three math classes that satisfy gen-eral education requirements for most majors at ETSU. The other courses are MATH 1810 and MATH 1840 which is business calculus[7].
In reality, developmental math held more students back from graduating on a national level[13]. There are many studies that show low numbers of students com-plete their developmental courses in mathematics. Two studies showed around 21% of students in developmental math complete their courses and another study showed only 30% of students pass their developmental courses in mathematics[3]. This leads
to high student drop-out rates from college, and many students do not graduate with their peers not in a developmental course. Students at 4-year public universities have a 55% graduation rate within six years of starting school, compared to students at 4-year public universities that did not take a developmental course have a 71% graduation rate within six years.[11]. Further, students in a developmental studies program are 74% more likely not to graduate than a student not taking a developmen-tal class[13]. Not only do developmendevelopmen-tal classes hinder students from taking college level courses but they also cost students and their families around $1.3 billion a year in out-of-pocket costs across the country. Students who attended colleges classified as very high research institutions by the Carnegie Classification paid about $33 million a year which is about $300 million less then other four-year public colleges[5]. This includes the cost to the university for the courses as well.
After years of developmental math being taught as separate non college-level courses, researchers gathered data on these programs and their ineffectiveness be-came clear. Students’ retention rates were poor, the costs of the ineffectiveness was high, and student outcomes were only promising for a small percentage of students in developmental studies programs[2]. This led to brainstorming how to help students navigate the obstacles that are impairing them from graduating and how to cut down costs to the students and universities.
3 IMPLEMENTATION OF LEARNING SUPPORT AT ETSU
With a goal to increase student success in developmental studies programs, the Tennessee Board of Regents (TBR) implemented corequisite learning support courses in TBR institutions starting in the fall semester of 2013. This movement was based off of a redesign project that started in 2007 at Austin Peay State University where they pioneered the corequisite model and were showing promising results from 10% of students completing a college-level math course over many semesters to 70% of students completing a college-level math class in one semester[6]. Corequisite learning support classes are college-level courses that embed extra learning support within the courses so that students earn college credit while still receiving the developmental remediation skills needed to be successful in future courses. TBR states that a 2016 cost study report shows that this model will cost the schools and students less money then the previous approach[17] and that student success rates have increased under the new model.The TBR website shows that passing rates in introductory college-level math classes increased from 12% to 51% under the corequisite model[17], which is a significant increase. This model is being used in 21 states with initial analysis showing that the programs are increasing pass rates in college-level math courses[13]. ETSU started using the corequisite model in Fall of 2013. The math department at ETSU offers corequisite MATH 1530. Under this new model of corequisite learning support math, students that are placed in the developmental studies math program will take corequisite MATH 1530 which satisfies their developmental needs as well as completing a college-level math course at the same time. In Fall of 2017, 249 students were enrolled in MATH 1530 learning support. That is, approximately 10% of ETSU
freshmen students took developmental math in Fall 2017[9]. The corequisite math program at ETSU has been in place for a little over five years, although this is still too early to track graduation rates it does gives us five years of data to compare to the previous developmental math program at ETSU.
4 METHODS
Our data set was comprised of all students who took a developmental math course at East Tennessee State University from Fall of 2013 to Spring of 2018, as well as all students that took corequisite developmental math from Fall of 2008 to Spring of 2012. We requested those students’ ACT scores, COMPASS/ACCUPLACER scores, calculus grades (if taken), gender, if they were traditional or non-traditional stu-dents, if they are transfer students or not, if they were underrepresented or white students, MATH 1530 grades on 4.0 scale for developmental support and corequisite developmental support, and students’ majors. We collected this data to compare the outcomes of MATH 1530 within the two different programs of developmental support. This data was collected in January of 2019 from the ETSU data bank by Joshua Whitlock, Director of Institutional Research Applications and Data Systems. Our data set had a total of 5689 students over the given ten year span. We note that the Fall 2012 to Spring 2013 year was not included in our data set as well as summer terms. We did not include the 2012/2013 school year since ETSU tested a one year alternative developmental math program that was ended at the end of its first year. ETSU did not consistently offer developmental MATH 1530 courses over summer terms so we left that data out of our set. I used R studio to work with the data.
5 RESULTS
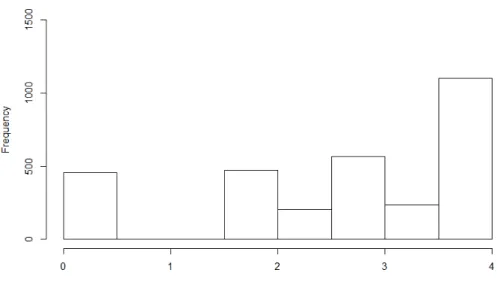
We are working with a census since we have collected data from everyone in our population. Figure 1 shows the histogram of course grades of on a 4.0 scale of students from the developmental support math program (DSPM) taking DSPM 1850, intermediate algebra, from fall of 2008 to spring of 2012. This course did not allow a grade of C- or any range of D. The population mean was 2.691, roughly a C-, and the population median was 3.000, a B, on a 4.0 scale. The failing grades were not separated into Fs and FN, which is failure for nonattendance, in the data I received.
The population mean of the students’ grades in MATH 1530 after passing DSPM 0850 represented in Figure 2 was 1.919, between a C and C-, and the population median was 2.000 or a C. Here we have nearly the same amount of students receiving a F as a C. We need to keep in mind that the students who received a 0 or F includes students that received a FN.
Figure 3 shows the grades by gender of students in MATH 1530 after completing DSPM 0850. There are 1811 females and 1229 males in our population. The medians for females and males were 2.000, while the mean for females was 1.955 and the mean for males was 1.858. From this data we can conclude that there is little difference in the grade outcomes between female and male students taking MATH 1530 after successfully completing DSPM 0850.
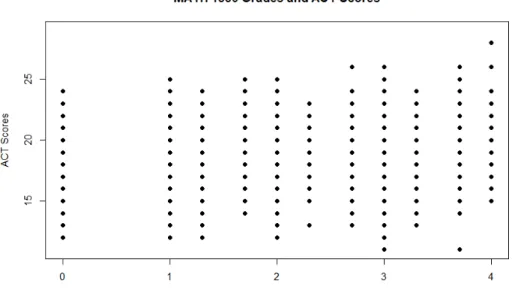
In Figure 4, the correlation coefficient of the relationship between MATH 1530 grades after completing DSPM 0850 and ACT scores isρ= 0.1611376. In other words, a student’s ACT score did not predict how the student would do in MATH 1530 after completing intermediate algebra DSPM 0850. Taking this into consideration, it is important that students are not placed into a math course based solely on their ACT scores.
Figure 4: Scatterplot of MATH 1530 Students After Taking DSPM 0850 and ACT Scores
The correlation coefficient of the relationship between MATH 1530 grades after completing DSPM 0850 and their subsequent calculus grades in Figure 5 is ρ = 0.4840351. This also shows that a student’s outcome in MATH 1530 does not predict their grade outcome in calculus.
Figure 6: Distribution of DSPM Students by Major
In Figure 6 we have a breakdown by major of students that took DSPM 0850. After reviewing our data points and rerunning the test I still had an unusually high number of Clemmer College undecided students. I believe that there is an error in our data set that attributes to the high number of CC Undeclared students.
Figure 7: Histogram of Corequisite MATH 1530 Grades
Figure 7 shows the histogram of Corequisite MATH 1530 grades with the mean is 1.963 and the median is 2.000. The high number of 0s or failing the course also includes students that received an FN, failure for nonattendance. It is interesting that many students fall in the 0, 2, or 3 range. There are fewer scores of A-, B-, C-and B+, C+, D+.
Figure 8 shows the distribution of grades in Corequisite MATH 1530 by gender. The median for both females and males was 2.000 while the mean for females was also 2.000 and the mean for males was 1.963. This data shows that female and male students have little difference in grade outcomes in Learning Support Math 1530.
In Figure 9 the correlation coefficient of the relationship between corequisite MATH 1530 grades and ACT scores is ρ = 0.1443889. This tells us that a stu-dent’s ACT score will not predict how they do in Corequisite MATH 1530, which also shows that there should be less emphasis on ACT scores when taking into account of where to place incoming students.
The correlation coefficient of the relationship between Corequisite MATH 1530 grades and their subsequent calculus grades in figure 10 is ρ = 0.42457. This also shows that a student’s grade in Corequiste MATH will not predict how the student will do in calculus.
Figure 11 shows a breakdown by major of students that took Corequisite MATH 1530. We can see that many students taking Corequisite MATH 1530 have goals obtaining degrees in STEM fields when they enter the university. The university has recently begun to strongly encourage students to declare a major when they enroll, which leads to fewer undeclared students.
Figure 12: Percentage of Grade Distribution of MATH 1530 Students
Table 1: Expected Values & Observed Values 4.0 Scale DSPM MATH 1530 Corequisite MATH 1530 & DSPM MATH 1530 Corequistie MATH 1530 0 413.17256 550.8274 363 601 1.0 165.01186 219.9881 160 225 1.3 146.15336 194.8466 175 166 1.7 102.43594 136.5641 134 105 2.0 300.87877 401.1212 358 344 2.3 110.57938 147.4206 110 148 2.7 113.15099 150.8490 126 138 3.0 272.16242 362.8376 271 364 3.3 84.86324 113.136 73 125 3.7 128.15207 170.8479 112 187 4.0 150.43939 200.5606 105 246
We performed a Chi-Squared test on the data in Figure 12 and Figure 13. We ran the test in R-studio with χ2 = 89.945 and 10 degrees of freedom. The results show that we have a p-value of 5.491e−15, which approximately zero. The following tables show the expected values and the actual values of the grade distribution among the two courses MATH 1530 courses.
Figure 14: Chi-Squared Residual Plot of DSPM Math 1530 and Corequisite MATH 1530 Grades
Figure 14 below shows the chi-squared test residuals, those with residuals less than −2 show that the observed value is less than the expected frequency and residuals greater than 2 show that the observed value is greater than the expected value. In figure 14, the larger and darker the dot, the greater the difference between the expected frequency and the observed frequency.
6 DISCUSSION AND CONCLUSION
After many years of the developmental math support program at ETSU, our data show that the corequisite developmental math program may be promising for student retention and completion of college-level math courses and, hopefully, will follow through to an increase in graduation rates among students that took a developmental math course. Our data shows that while the median between the two programs is the same, the difference in the means of the two programs was only 0.044 with the corequisite program having the higher mean of the two programs. Although the means are very close in value, this still shows that students are successful in the corequisite developmental math program. The data show that having passed a separate developmental math course does not necessarily improve student outcomes in MATH 1530 any more than taking the course as a corequisite class.
Since the corequisite program is only five years old, I did not collect graduation rates on the students, or retention rates. I also did not run the COMPASS scores as it has been phased out by ACT for ineffectiveness. There is not much data on the effectiveness of the ACCUPLACER test because we do not have sufficient data for that test at this time since it has only been used since Fall of 2018. The data does show, as expected, that the correlation between ACT scores and MATH 1530 grades is very low. This means that a student’s ACT score cannot predict how a student will do in either developmental math program at ETSU. The correlation between MATH 1530 grades and calculus grades is higher than ACT scores and MATH 1530 grades but still a low correlation. A student’s grade in MATH 1530 cannot predict how a student will do in future calculus courses but it does show that students are in control
of their achievement level in that course.
Our data show that students in the corequisite developmental math program will take fewer math courses to achieve the same goals as students in the prior develop-mental math program, which also means that students should graduate in less time and consequently spend less money on their education. These findings do show that the corequisite developmental math program at ETSU is a better approach to student success in college-level math courses and cost-effective.
7 CONTINUED WORK
College enrollment is down nationally, but STEM seeking degree student enroll-ment is up nationally[15]. STEM degrees are still in high demand with a master of mathematics or statistics degrees high on the list, along with computer science, finance, and various health degrees. With this in mind, is ETSU retaining out of the 60% of students that are not entering with college ready transcripts and testing scores the ones that have goals to obtain degrees in the STEM fields? Do developmental support math courses prepare students for higher level STEM involved courses? More specifically, are these students going on to take STEM courses after developmental math or learning support courses, and lastly is there is a better way to assess students for criteria in course placements?
BIBLIOGRAPHY
[1] Carol Hopper Bader and Carlette Jackson Hardin, History of Developmental Studies in Tennessee, Journal of Tennessee History, Quarterly (2002), 35–45.
[2] Eric P. Bettinger, Angela Boatman and Bridget Terry Long, Student Supports: Developmental Education and Other Academic Programs, The Future of Chil-dren, Spring 23 (2013), 93–115.
[3] Barbara S. Bonham and Hunter R. Boylan, Developmental Mathematics: Chal-lenges, Promising Practices, and Recent Initiatives, Journal of Developmental Education, Winter 36 (2012), 14–21.
[4] Hunter R. Boylan, Improving Success in Developmental Mathematics: An inter-view with Paul Nolting, Journal of Developmental Education, Spring 34 (2011), 20–27.
[5] Carnegie Classification of Institutions of Higher Education,East Tennessee State University, http://carnegieclassifications.iu.edu, last accessed 2019-01-03.
[6] Tristan Denley, Co-Requisite Remediation Pilot Study - Fall 2014 and Spring 2015 and Full Implementation Fall 2015, https://www.tbr.edu, last accessed on 2019-02-19.
[7] ETSU General Education Requirements, https://catalog.etsu.edu/ content.php?catoid=31&navoid=1452, last accessed on 2019-01-23.
[8] ETSU Learning Support Program, https://www.etsu.edu/uac/ learningsupport/default.php, last accessed 2019-02-19.
[9] Fact Book 2018 Statistical Profiles East Tennessee State University, https:// www.etsu.edu/opa/fact/factbooks.aspx, last accessed 2019-02-19.
[10] Paul Fain, Finding a New Compass, Inside Higher Ed https://www.insidehighered.com/news/2015/06/18/
act-drops-popular-compass-placement-test-acknowledging-its-\ predictive-limits, last accessed 2019-2-11.
[11] Elizabeth Ganga, Amy Mazzariello, Nikki Edgecombe,
Developmet-nal Education An Introduction For Policy Makers, CAPR, 2018,
https://www.ecs.org/wp-content/uploads/Developmental-Education_ An-Introduction-for-Policymakers.pdf, last accessed 2019-02-20.
[12] History of Student Financial Aid, http://www.finaid.org/educators/ history.phtml, last accessed on 2019-02-21.
[13] John B. King, Jr., Developmental Education Challenges and Strategies for Re-form, Department of Education, January 2017, https://www2.ed.gov/about/ offices/list/opepd/education-strategies.pdf, last accessed 2019-2-14.
[14] University Advisement Center, General Information, https://www.etsu.edu/ uac/learningsupport/generalinfo.php last accessed on 2019-02-21.
[15] National Center for Education Statistics, by Tayor Cambell and Jamie West-cott, 2019 Profile of Undergraduate Students: Attendance, Distance and
Re-medial Education, Degree Program and Field of Study, Demographics, Finan-cial Aid, FinanFinan-cial Literacy, Employment, and Military Status: 2015–16, NCES https://nces.ed.gov/pubs2019/2019467.pdf, last accessed on 2019-02-12.
[16] Penelope Parmer and Jared Cutler, Easing the Transition: Building Better Bridges between Developmental and College-Level Math, Journal of Applied Re-search in the Community College, Fall, 15 (2007), 37–45.
[17] The College System of Tennessee, 2016 Transforming Remedial Pro-grams=Dramatic Gains in Student Success, TBR https://www.tbr.edu/news/ transforming-remedial-programs-dramatic-gains-student-success\ -2016-04-05, last accessed on 2019-01-21.
VITA
CHRISTINE PADDEN
Education: M.S. Mathematical Sciences, East Tennessee State University Johnson City, Tennessee 2019
B.S. Science, Portland State University Portland, Oregon 2017
A.S. Applied Science, Portland Community College, Portland, Oregon 2011