A Tractable Optimization Framework for Air
Traffic Flow Management Addressing Fairness,
Collaboration and Stochasticity
by
Shubham Gupta
B.Tech., Indian Institute of Technology, Kanpur (2007)
S.M., Massachusetts Institute of Technology (2010)
Submitted to the Sloan School of Management
in partial fulfillment of the requirements for the degree of
Doctor of Philosophy in Operations Research
at the
MASSACHUSETTS INSTITUTE OF TECHNOLOGY
June 2012
c
Massachusetts Institute of Technology 2012. All rights reserved.
Author . . . .
Sloan School of Management
May 18, 2012
Certified by . . . .
Dimitris J. Bertsimas
Boeing Professor of Operations Research
Thesis Supervisor
Accepted by . . . .
Patrick Jaillet
Dugald C. Jackson Professor of Electrical Engineering and Computer
Science, Co-Director, Operations Research Center
A Tractable Optimization Framework for Air Traffic Flow
Management Addressing Fairness, Collaboration and
Stochasticity
by
Shubham Gupta
Submitted to the Sloan School of Management on May 18, 2012, in partial fulfillment of the
requirements for the degree of
Doctor of Philosophy in Operations Research
Abstract
We propose a tractable optimization framework for network Air Traffic Flow Man-agement (ATFM) with an eye towards the future. The thesis addresses two issues in ATFM research: a) fairness and collaboration amongst airlines; and b) uncertainty inherent in capacity forecasts. A unifying attraction of the overall dissertation is that the Collaborative Decision-Making (CDM) paradigm, which is the current philosophy governing the design of new ATFM initiatives, is treated as the starting point in the research agenda.
In the first part of the thesis, we develop an optimization framework to extend the CDM paradigm from a single-airport to a network setting by incorporating both fairness and airline collaboration. We introduce different notions of fairness ema-nating from a) First-Scheduled First-Served (FSFS) fairness; and b) Proportional fairness. We propose exact discrete optimization models to incorporate them. The first fairness paradigm which entails controlling number of reversals and total amount of overtaking is especially appealing in the ATFM context as it is a natural extension of Ration-By-Schedule (RBS). We allow for further airline collaboration by proposing discrete optimization models for slot reallocation. We provide empirical results of the proposed optimization models on national-scale, real world datasets that show interesting tradeoffs between fairness and efficiency. In particular, schedules close to the RBS policy (with single digit reversals) are possible for a less than 10% increase in delay costs. We utilize case studies to highlight the considerable improvements in the internal objective functions of the airlines as a result of slot exchanges. Finally, the proposed models are computationally tractable (running times of less than 30 minutes).
In the second part, we address the important issue of capacity uncertainty by presenting the first application of robust and adaptive optimization in the ATFM problem. We introduce a weather-front based approach to model the uncertainty inherent in airspace capacity estimates resulting from the impact of a small number of weather fronts. We prove the equivalence of the robust problem to a modified instance of the deterministic problem; solve the LP relaxation of the adaptive problem using
affine policies; and report extensive empirical results to study the inherent tradeoffs. Thesis Supervisor: Dimitris J. Bertsimas
Acknowledgments
Five years ago, I embarked upon a journey with loads of excitement and plenty of apprehension. By the grace of god, I have been able to successfully complete my endeavor of earning a PhD!
I met my advisor, Professor Dimitris Bertsimas during my first week at MIT and we have worked together ever since! I express my sincere gratitude for his support and wisdom throughout my doctoral studies. I especially thank him for keeping up with me during phases when I was undergoing “turbulence”. His voracious appetite for challenging problems and energy for creative endeavors is simply amazing. This thesis is a testimony of my cordial and fruitful relationship with him over these multiple years!
I thank Prof. Amedeo Odoni who made me gel into the MIT culture early on and has been a wonderful mentor ever since. I thank the other two members of my PhD committee - Prof. Georgia Perakis with whom I’ve interacted often right from the first optimization class to the seminar coordination in the final year, and Prof. Hamsa Balakrishnan for useful suggestions on my research. It has been a privilege to learn and interact with the amazing faculty members at MIT - I’d like to especially acknowledge Professors John Tsitsiklis and Vivek Farias for some of the most enjoyable classes. I thank Guglielmo Lulli for an enjoyable and productive collaboration in my final year! I thank Juliane Dunkel for giving me an opportunity to be a TA for one of my favorite subjects.
I owe a lot to all my friends who shared the ebbs and flows of this journey with me. I express my sincere thanks to Shashi Mittal for the help and guidance (over many years now)! He was the reason why I applied to ORC and took the “PhD leap”. A special thanks to Chaithanya Bandi for the uncountable squash sessions and dinners which kept me sane. Not withstanding the “Shubandi” debacle, there were plenty other memorable events. Our friendship over the last four years has been one of the non-academic highlights. I thank Mike Frankovich for the wonderful conversations over many “Indian buffets” and over multiple projects in office. I thank the fellow students of my incoming class: Allison, Claudio, Cong, Mallory, Matthew, Nikos, Phil, Shree, Ton and Wei for the warm camaraderie. Finally, I thank Dave Goldberg for the company during numerous all-nighters in the “Student Center” and Dan Iancu from whom I’ve learnt a lot.
On the family front, I would like to thank my parents for always providing me with the best of opportunities. They have never enforced their desires on what to do
in life and have fully stood by me when times were tough. I dedicate this thesis and all my successes to both of you. I thank my sister Swita and brother-in-law Prateek for their unconditional love and support. Finally, a special mention for the two jewels in my life: Shreya and Shaurya, who have given me plenty of joy!
Contents
1 Introduction 19
1.1 The Case for Optimization . . . 20
1.2 Overview of Air Traffic Management . . . 24
1.3 Collaborative Decision-Making . . . 28
1.4 Taxonomy of Existing Models . . . 32
1.5 Starting Point: Bertsimas Stock-Patterson Model . . . 35
1.6 Contributions and Thesis Outline . . . 38
2 Network Models that Incorporate Concepts of Fairness 43 2.1 Introduction . . . 43
2.2 Controlling the Total Amount of Overtaking . . . 49
2.3 Controlling the Total Number of Reversals . . . 54
2.4 Controlling the Difference between Per Flight Airline Delays . . . 57
2.5 Controlling both Reversals and Difference in Per Flight Airline Delays 58 2.6 Prioritizing between Airport Reversals and Sector Reversals . . . 61
2.7 Computational Results . . . 64
2.8 Conclusions . . . 76
3 Network Models that Incorporate Airline Collaboration 79 3.1 Motivation . . . 79
3.2 Input Data . . . 83
3.3 Generalization of Vossen-Ball Single-Airport Model . . . 87
3.4 A Model based on Monotone Variables . . . 89
3.5 Computational Results . . . 91
3.6 Integration and Comparison with Current CDM Practice . . . 95
4 Addressing Capacity Uncertainty 97
4.1 Motivation . . . 97
4.2 Our Proposal . . . 100
4.3 Model of Weather-front Induced Capacity Uncertainty . . . 101
4.4 Characterization of Weather-front Induced Uncertainty Set . . . 108
4.5 Solution Methodologies . . . 115
4.6 Computational Results . . . 118
4.7 Conclusions . . . 125
5 Conclusion 127 5.1 Thesis Summary . . . 127
5.2 Directions for Future Research . . . 128
A Fairness Models 131 A.1 Strength of TFMP-Reversal . . . 131
B Airline Collaboration 135 B.1 Strength of Slot Reallocation Models . . . 135
B.2 Integer Equivalence of Slot Trading Models . . . 137
C Robust and Adaptive Optimization 141 C.1 Optimization Under Discrete Uncertainty Sets . . . 141
C.2 Power of Affine Policies in Multistage Adaptive Optimization . . . 142
List of Figures
1-1 Airline profits during 2001-2010 (Data Source: IATA). . . 20
1-2 OPSNET yearly delays for 2001-2010. . . 21
1-3 OPSNET monthwise delays for 2010. . . 22
1-4 Delays attributable to weather during 2001-2010. . . 22
1-5 Components of ATM. . . 24
1-6 Objectives of ANSP and Airlines. . . 26
1-7 Snapshot of flights in the NAS (Source: [20]). . . 27
1-8 Optimization Tools available to FAA. . . 27
1-9 Schematic of a GDP under CDM. . . 31
1-10 An example demonstrating the current operational details of a GDP. 31 1-11 Three core topics of the thesis. . . 39
2-1 Mapping of our proposal with the current three-stage CDM practice. This chapter covers Stage I of the overall proposal whereas Chapter 3 covers Stage II. . . 45
2-2 Pictorial depiction of a reversal. . . 46
2-3 A reversible pair of flights (f, f′)∈ RA (dest f =k). . . 47
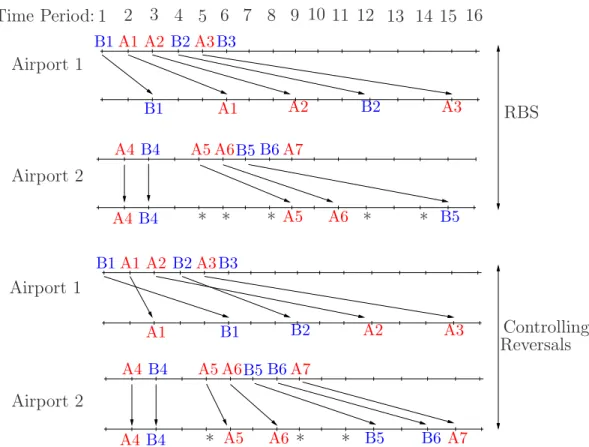
2-4 Example demonstrating the utility of controlling reversals over the RBS solution. * denotes slots which remain unutilized despite being avail-able. The capacity of Airport 1 gets reduced by two-thirds, whereas that of Airport 2 by one-third. . . 49
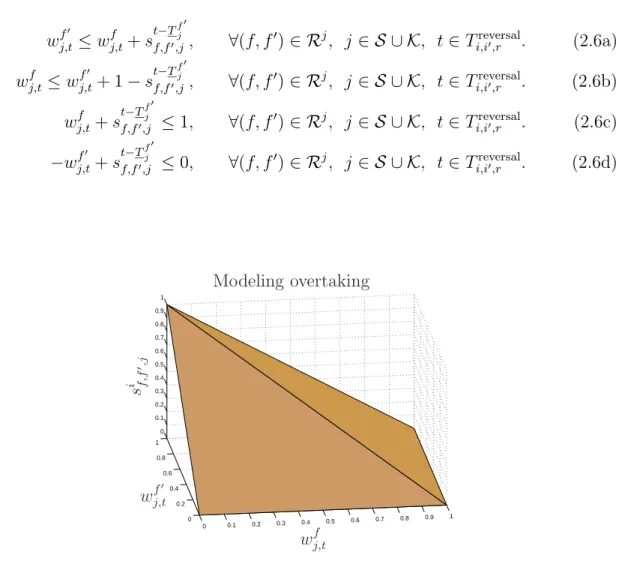
2-5 Convex hull of the integer points in Table 2.2 to model overtaking (i=t−Tfj′). . . 53
2-6 Illustration of a scenario where controlling sector reversals seems appro-priate. There are multiple ATFM programs operating simultaneously. Specifically, an AFP is spatially followed by an airport with a GDP (BOS) and an airport with no GDP (LGA). . . 62
2-7 Illustration of a scenario where controlling sector reversals seems an overkill. There are multiple ATFM programs operating simultaneously. Specifically, there are GDPs operating at two nearby airports (BOS) and (LGA). Moreover, there is no ATFM program operating en-route. 63 2-8 Two scenarios to study the relevance of controlling sector reversals in
addition to airport reversals. . . 63 2-9 Distribution of per flight airline delays from (TFMP) in units of 15
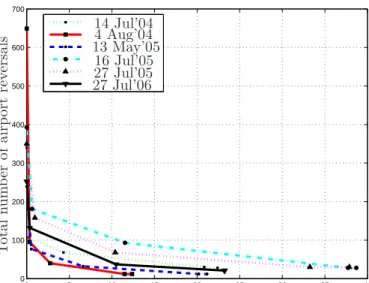
minutes. . . 66 2-10 Effect of the tradeoff parameter λr
a. The five points for each day
cor-respond to the result from (TFMP-Reversal) with λr
a = 0, 1, 10, 100
and 1000. . . 69 2-11 Distribution of per flight airline delays from (TFMP-Reversal) in units
of 15 minutes. . . 69 2-12 Distribution of per flight airline delays from (TFMP-Dev) in units of
15 minutes. . . 71 2-13 (TFMP-Rev-Dev): Tradeoff between reversals and difference in airline
delays. Note that the horizontal axis corresponds to Pw∈W|dw −γ|
(in units of 15 minutes). Specifically, the value 0.2 corresponds to 3 minutes. For each day, the five points correspond to (λr
a, λd) set to (0,
100), (10, 100), (100, 100), (100, 10) and (100, 0) respectively. . . 72 2-14 Distribution of per flight airline delays from (TFMP-Rev-Dev) in units
of 15 minutes. . . 74 2-15 Impact of controlling sector reversals on i) airport reversals and total
delay cost (Left); and ii) sector reversals (Right). . . 75 2-16 Impact of super-linear cost coefficients on i) reversals and total delay
cost (Left); and ii) distribution of flight delays (Right). . . 76 3-1 Illustration of a Scenario Motivating Airline Collaboration. . . 81 3-2 Illustration of centralized and decentralized mechanisms for airline
col-laboration. . . 81 3-3 Motivation for slot trading in a single-airport setting. . . 83 3-4 Motivation for slot trading in a multi-airport (network) setting. . . 83 3-5 Illustration of the structure of an offer (fd, td′;fu, tu′). destf
d = A, destfu =B, td′ =Dfd+ 3 and tu′ =Dfu−4. The offer states that the airline is willing to delay flight fd by at-most 3 slots if in return flight
3-6 Example demonstrating the utility of our slot reallocation phase over the intra-airline substitution. . . 85 3-7 Example Illustration of AMAL offers. Using the terminology of set O,
the proposed trade offers are (A1, 3; A2, 4), (B1, 6; B2, 2) and (C1, 4; C2, 1). . . 85 3-8 Representation of trade offers on a directed graph. The set of nodes
correspond to the six slots, whereas the arcs represent various possible flight plans. For example, arc (A1, 2) denotes the assignment of slot 2 to flight A1 (from the currently allotted slot 1). . . 86 3-9 One of the final assignments after the execution of a feasible
combina-tion of trades. . . 86 3-10 Illustration of network flow constraints in the single-airport model.
(Taken from [36]) . . . 87 3-11 Distribution of number of executed trades across airlines from
TFMP-Trading-BG. Left: (Objective 1); Right: (Objective 2) . . . 94
4-1 OPSNET monthwise delays for 2010. . . 98 4-2 Delays attributable to weather during 2001-2010. . . 98 4-3 Illustration of our overall proposal for solving multi-period ATFM
problem addressing capacity uncertainty. . . 101 4-4 Depiction of the capacity profile under a weather-front based
uncer-tainty set for a single affected airspace element. The plot is for a particular realization of the parameters (Ta, d, α). . . 103
4-5 Illustration of the applicability of step functions to model capacity profiles. AC denotes actual sector capacity and SF denotes the step function capacity. . . 103 4-6 Traversal of a weather-front across the NAS. It has three phases over
the course of its existence. . . 104 4-7 Explanation of some of the notation (T = 5). . . 105 4-8 Illustration of the characteristics of the deterministic, robust and
adap-tive routes of a flight. . . 108 4-9 Illustration of the geometry of the randomized rounding algorithm for
proving the integrality of polyhedron X. y∗,z∗ satisfy y∗
t ≤y∗t+1, zt∗ ≤
z∗
t+1 and z∗t ≤yt∗. . . 112
4-10 Left: A simplex uncertainty set in R2. Right: A polyhedral set inR2
4-11 Flight traffic (departures and arrivals) as a) a function of time of day (Left); and b) a function of airport (Right). . . 119 4-12 Characteristics of Robust Solutions. Left: Price of robustness as a
function of capacity reduction. Right: Schedule deviation as a func-tion of capacity reducfunc-tion. The red line corresponds to the best linear fit. . . 122 4-13 Utility of Robust Solutions. The plot depicts the relation between
ro-bust and new deterministic cost (for the protracted feasible schedule) for different scenarios of the uncertainty set. . . 123 4-14 Running times for i) deterministic and robust problems (Left); and
ii) adaptive problem (Right). C denotes CPLEX solver time and T denotes Total time (including ROME parsing time). . . 125 C-1 Example uncertainty sets with and without bmin (black filled circle
denotesbmin). . . 147
C-2 Left: Upper bound on the number of extreme points in the weather-front based uncertainty set (k = 1). The bold numbers indicate the attractive cases from the point of view of obtaining a single affine policy; and Right: Plot of the upper bound on E (k = 1, P = 2). . . 149
List of Tables
1.1 Direct and indirect delay costs to economy. . . 21
1.2 Flight On-Time Statistics (Data Source: Bureau of Transportation Statistics [35]). . . 22
1.3 Taxonomy of ATFM Models. . . 32
2.1 Utility of our proposal of enforcing FSFS fairness. . . 50
2.2 Truth table for modeling the overtaking variables. . . 51
2.3 Upper bound on the size of the models. . . 60
2.4 Numerical Example: Upper bound on the size of the models. . . 60
2.5 Summary of the datasets. CF denotes the number of connecting flights. 64 2.6 Performance of TFMP. RV denotes the number of reversals and OV the amount of overtaking. . . 66
2.7 Computational performance of (TFMP-Overtake). Note that the row with k airports corresponds to imposing fairness at k airports and no fairness at the remaining |K| −k airports. In particular, k = 0 corresponds to the (TFMP) solution. . . 68
2.8 Computational performance of (TFMP-Reversal). Note that the row with k airports corresponds to imposing fairness at k airports and no fairness at the remaining |K| −k airports. In particular, k = 0 corresponds to the (TFMP) solution. . . 70
2.9 Computational Performance of (TFMP-Dev). . . 71
2.10 Computational performance of (TFMP-Rev-Dev) in units of 15 min-utes. RV denotes the number of reversals. . . 72
2.11 Balancing Sector Reversals with Airport Reversals (SR denotes the number of sector reversals,ARdenotes the number of airport reversals and DC denotes the delay cost). Fairness imposed in 5 sectors of the north-east region and 10 airports spatially close to these sectors. . . . 75
3.1 Relative benefits of a centralized and decentralized slot reallocation
mechanism. . . 82
3.2 Left: Value of the slots to the two airlines; Right: Value proposition of various assignments. . . 82
3.3 Computational performance of the two trading models - Objective Function 1 (maximize the total number of executed trades). . . 92
3.4 Computational performance of the two trading models - Objective Function 2 (minimize the deviation in the number of trades executed for an airline from the mean). . . 92
3.5 Computational performance of TFMP-Trading-BG. . . 93
3.6 Comparison of TFMP-Trading-BG between single-airport and network-wide settings. SA denotes the results from SA-TRADING and NW denotes the results from TFMP-TRADING. . . 94
4.1 Computational Experience with Π2. . . 121
4.2 Utility of Robust Solutions: Best fit lines. . . 123
4.3 Computational Experience with Π6. . . 124
C.1 Number of extreme points for the weather-front based polytope. AS denotes airspace, OP denotes one-phase and AP denotes all-phases. L denotes polyhedron concatenation. . . 147
List of Abbreviations
AAR Airport Acceptance Rate
AF P Airspace Flow Program
AOC Airline Operational Centers
AT C Air Traffic Control
AT F M Air Traffic Flow Management
BT S Bureau of Transportation Statistics
CDM Collaborative Decision-Making
CT D Controlled Time of Departure
CT A Controlled Time of Arrival
F AA Federal Aviation Administration
F CA Flow Controlled Area
F SM Flight Schedule Monitor
GDP Ground Delay Program
GHP Ground-Holding Program
NAS National Airspace System
NASA National Aeronautics and Space Administration
NEXT OR National Center of Excellence for Aviation Operations Research
OP SNET Operations Network
Chapter 1
Introduction
Each one of us has most likely experienced a canceled flight, missed a flight connection or arrived late in our destination. The agony caused due to missing an important per-sonal function or not making a conference on time is inexplicable. Consequently, the smooth operation of the National Air Transportation System (NATS) is paramount and a critical component of societal welfare.
To put in perspective the uncertain operating conditions of airlines, consider the financial performance over the last 10 years. Figure 1-1 plots the airline profits for the last 10 years (period of 2001-2010). The oscillating pattern of losses and profits should be immediately apparent. The attacks of 9/11 meant that airlines suffered losses for five straight years after 2001. Subsequent resurgence in traffic coupled with stable fuel prices ensured profits during the next couple of years. But, the financial crisis of 2008 and very high fuel prices lead to one of the worst years with total losses exceeding $25 billion in 2008. Recently, airlines have posted a net profit of $10 billion in 2010 with a forecast of a positive year during 2011. Airlines, thus, typically operate in a very uncertain financial environment which is a consequence of factors such as fluctuating fuel prices, market competition, strongly stochastic airspace capacity (leading to delays) and a whole host of external events (like 9/11, financial crisis, etc.). The lack of sustained profits further exacerbates the quality of service provided by various airlines and leads to increased disruptions as airlines try to manage their operations in the most cost-effective manner.
Although, a lot of research effort has been undertaken in the last two decades, there is still a lack of a centralized optimization-based tractable framework which automat-ically reroutes planes (under reduced capacity), cancels flights (to maximize system efficiency) and dynamically adjusts schedules (in response to unexpected weather events). Our aspiration in this research effort is to propose models which bridge this
2001 2002 2003 2004 2005 2006 2007 2008 2009 2010 −30 −25 −20 −15 −10 −5 0 5 10 15 20 Year P ro fi ts (in b illio n $ )
Figure 1-1: Airline profits during 2001-2010 (Data Source: IATA).
gap, at least from an Operations Research standpoint. The exact issues that this the-sis addresses are elaborated later in Section 1.6. The implementation of these models still requires political will and consensus amongst various stakeholders to transition into practice. To drive home the point on the need for optimization models, we present concrete evidence on the cost of delays.
1.1
The Case for Optimization
The sustained growth of the aviation industry has put a tremendous strain on the available resources of the air transportation system. This is evidenced by the steady increase in flight delays and severe congestion at airports. In 2010, approximately 18% of the flights in the United States were delayed by more than 15 minutes, while another 2% were cancelled (Bureau of Transportation Statistics [35]). Moreover, during the 12-month period ending in September 2008, 138 million minutes of system delay led to an estimated $10 billion in costs for US airlines [28].
Figure 1-2 depicts the yearly trend on the commercial aviation delays over the last 10 years. There is a sharp dip in the delays in the aftermath of the terrorist attacks on Sept 11, 2001. But, after 2003, there has again been a steady increase in the delays until the economic recession in the year 2008 caused the traffic to plunge again. Nonetheless, the magnitude of delays in recent years (around 0.3 million minutes) highlights the widespread prevalence of delays.
To assess the impact of the cost of the delays to the economy (both direct and indirect), Table 1.1 reports the cost of delay numbers calculated by various recognized agencies. The reported numbers highlight the enormity of the economic impact of aviation delays which provide ample impetus for the development of optimization
2001 2002 2003 2004 2005 2006 2007 2008 2009 2010 2.5 3 3.5 4 4.5 5 5.5 6x 10 5 Year D ela y s (in m in u te s)
Figure 1-2: OPSNET yearly delays for 2001-2010. tools.
Source Year Cost ($ billion)
Direct Indirect
NEXTOR 2007 27 4
JEC 2007 31 10
IATA 2008 14
-Table 1.1: Direct and indirect delay costs to economy.
Flight On-Time Statistics
To assess the performance of the current ATM system, Table 1.2 reports statistics on the percentage of flights that are delayed by more than 15 minutes and those that are cancelled altogether. As should be evident from these numbers, the percentage flights which don’t arrive on-time consistently range between 18 and 25% which emphasizes that almost 1 in 4 flights don’t arrive on time. Furthermore, typically 1-3% of all flights are cancelled altogether. This is significant as cancelled flights cause subsequent disruptions due to missed connections.
Impact of Weather
Weather accounts for the majority of the total air traffic delays caused due to termi-nal, en-route congestion and several other operational factors. To assess the impact
Year Total Flight % Flights % Cancelled Operations Delayed 2006 2,685,218 21.66 1.50 2007 2,688,939 24.61 2.52 2008 2,644,820 24.11 2.26 2009 2,540,586 19.26 1.59 2010 2,517,616 18.45 2.08
Table 1.2: Flight On-Time Statistics (Data Source: Bureau of Transportation Statis-tics [35]).
of weather on the total aviation delays, we consider the OPSNET1 delays data for the
year 2010. As evidenced in the monthly delays plot in Figure 1-3, there is a significant spike in the delays for the summer months (May-July), when there is pronounced con-vective weather activity. Moreover, Figure 1-4 indicates that approximately 65-75% of total delays are attributable to weather in the last ten years. These two obser-vations highlight the importance of addressing weather induced capacity uncertainty for mitigating aviation delays.
Jan Feb Mar Apr May Jun Jul Aug Sep Oct Nov Dec 1.5 2 2.5 3 3.5 4x 10 4 Month D ela y s (in m in u te s)
Figure 1-3: OPSNET monthwise delays for 2010. 2001 2002 2003 2004 2005 2006 2007 2008 2009 2010 0 10 20 30 40 50 60 70 80 90 100 Year % D ela y d u e to W ea th er
Figure 1-4: Delays attributable to weather during 2001-2010.
Challenges
The enormity of the aviation delays and the corresponding impact on the economy gives ample motivation for the development and deployment of optimization tools to mitigate them. In addition to the congestion problems being faced currently, there are
1
The Operations Network (OPSNET) is one of the official sources of National Airspace (NAS) air traffic operations and delay data.
a number of other challenges which make the control of aviation delays an especially arduous task. We elaborate upon them in this section.
• Current Airport Operations. Many airports in the US are currently oper-ating at or near capacity. There is typically a nonlinear relationship between delay and demand. This means that an incremental increase in demand causes a significant (viz., non-linear) increase in the delays when the operations are executed close to the system capacity. A consequence of this fact is that han-dling increasing demand needs more prudent use of the available resources in the NAS which manifests itself in the use of optimization tools.
• Enhanced Airport Infrastructure. A potential solution to mitigate the impacts of increased demand on airport congestion is to enhance the capacity by building new runways or increase the number of airports. Unfortunately, these tools suffer from various logistical complexities (of design and planning) and are further hindered by tedious legal approvals. Moreover, such projects typically take years (if not decades) to be implemented in totality, a timeframe not amenable for short-term congestion alleviation. Finally, such projects do not ease congestion in the en-route airspace. Therefore, it becomes paramount to seek alternative avenues for congestion management.
• Future Demand Trends. The FAA estimates that through 2025, demand will increase by more than 60% averaging 3.4% per year in the domestic carrier revenue passenger miles. This continued surge in demand seems daunting and provides added thrust to sophisticated ATFM initiatives of the form aspired in this thesis.
NextGen
Currently, in the United States, significant resources are being deployed in the de-velopment of a future Air Traffic Management (ATM) system called the Next Gen-eration Air Transportation System (NGATS or NextGen) [29]. The expected key benefits of this new ATM system are improvements in various aspects of aviation en-compassing ground and terminal operations, technological advancements in aircraft monitoring, efficient coordination of various ATM tools and improved tracking of ac-tual flight paths. In particular, a major proposal of NGATS is improvements in 4DT (four-dimensional trajectory) uncertainty (4DT capability is defined as the ability to precisely fly an assigned 3D trajectory while meeting specified timing constraints on
arrival at waypoints [29]). This would lead to enhanced predictability and control over the trajectory of an aircraft with the resulting decrease in the delays in the system. These developments further motivate the design of optimization models as the NGATS technologies would give tighter control over the exact trajectories that aircraft fly and thereby lead to stricter adherence to optimized routes.
We now expand upon the tools currently in use by FAA for realizing the goal of safe and expeditious aircraft movements.
1.2
Overview of Air Traffic Management
A multitude of factors like inclement weather, operational outages and demand surges can collude together to cause severe disruptions to air traffic movements. This ne-cessitates the use of tools that mitigate the potentially catastrophic impact on the system performance. Air Traffic Management (ATM) is a broad term used to refer to the composite of all such services. In terms of the exact objectives, ATM can be further classified into two components (as depicted in Figure 1-5):
• Air Traffic Control (ATC)
• Air Traffic Flow Management (ATFM)
ATM
ATC ATFM
Tactical
Component ComponentStrategic
Figure 1-5: Components of ATM.
We discuss each of these in some detail now. Air Traffic Control (ATC) refers to the set of “tactical” processes that aim to ensure safe separation between individual flights. More precisely, these pertain to the separation services provided by human controllers looking after different sectors. Each of these controllers keeps track of the flights in their respective sectors and ensure that safe separation is maintained between all flights and that the traffic to the next sector is presented in an orderly manner. In contrast, Air Traffic Flow Management (ATFM) refers to the set of
“strategic” processes that try to reduce congestion costs and support the goal of safe, efficient and expeditious aircraft movement. ATFM procedures try to resolve local demand-capacity mismatches by adjusting the aggregate traffic flows to match scarce capacity resources. Ground Delay Programs (GDPs) are one of the most sophisticated ATFM initiatives currently in use that attempt to address airport arrival capacity reductions. Under this mechanism, delays are applied to flights at their origin airports that are bound for a common destination airport which is suffering from reduced capacity or excessive demand. The premise for this tool is that it is better to absorb delays for a flight while it is grounded at its origin airport rather than incurring airborne delay near the affected destination airport which is both unsafe and more costly (in terms of fuel costs). Another recently introduced tool similar to a GDP is an Airspace-Flow Program (AFP) which is used to control arrival rate into a weather affected segment of the airspace, also known as a Flow Constrained Area (FCA). AFPs have been operational since 2007. Some of the other ATFM tools include assigning airborne delays, dynamic re-routing and speed control.
Stakeholders
There are essentially two sets of stakeholders in the air traffic domain: 1. Air Navigation Service Provider (ANSPs); and
2. Users (Airlines and general aviation)
The primary responsibility of ANSP is the smooth functioning of the ATM system. In the US, FAA is the primary ANSP, whereas EUROCONTROL assumes this re-sponsibility for continental Europe. The users are comprised of the airlines, general aviation and military.
Figure 1-6 depicts the broad hierarchy of objectives that the ANSP and airlines try to achieve. Safety at every stage of operations forms the most critical objective and overrides every other goal. For the ANSPs, ensuring equitable workload amongst the available resources (like controllers) represents the next important objective. Finally, equitable distribution of resources amongst users is the least important aspect of the overall planning process. In contrast, for airlines, ensuring that irregular operations are managed appropriately and the total delays are minimized represent the next important goals.
SAFETY
Workload
EquitySAFETY
Irregular
Operations
Minimize Delay Costs ANSP AirlinesFigure 1-6: Objectives of ANSP and Airlines.
Organization of FAA’s ATC Capabilities
Figure 1-7 shows an example snapshot of flights in the NAS at any point in time (there are around 5000 aircraft operating in the system during peak periods). The FAA utilizes a multi-layered hierarchy of entities to implement ATC services. At the apex of this pyramid is a state-of-the-art facility called Air Traffic Control System Command Center (ATCSCC) which is the centralized decision-making engine of the FAA. Operational since May 1994, this facility based near Washington DC houses latest technology and is the most sophisticated facility of its kind in the world. The primary responsibilities of ATCSCC include executing the strategic ATFM functions. This involves continuous monitoring of current and projected demand and simulta-neously updating estimates of capacity limits (in the presence of bad weather and runway closures). As and when demand exceeds capacity, the ATCSCC decides on the strategies to be implemented to resolve congestion. At the second level of this hierarchy are entities that take a more localized view of traffic management. Thus, to have a more focused control on the traffic at a regional level, the FAA has 22 Air Route Traffic Control Centers (ARTCCs) encompassing the entire geographical landscape of continental US. Each of these entities is responsible for ensuring safe separation between aircraft that fall within its boundaries. The interaction amongst the various ARTCCs is coordinated by the ATCSCC. To have a more microscopic control, each ARTCC is further divided into a number of sectors which span a three-dimensional volume of the airspace. A small number of human air traffic controllers control the traffic within each of the sectors by communicating with the pilots. As an aircraft arrives close to the terminal area, the control is shifted from the human air traffic
controller of the sector to Terminal Radar Approach Control facilities (TRACONs). Finally, during the taxi in and taxi out within the airport runway area, the aircraft is controlled by airport towers. The third (and final) layer within this hierarchy is oc-cupied by human controllers who ensure that the micro details of the overall schedule is implemented in their respective regions of control.
Figure 1-7: Snapshot of flights in the NAS (Source: [20]).
Optimization Tools
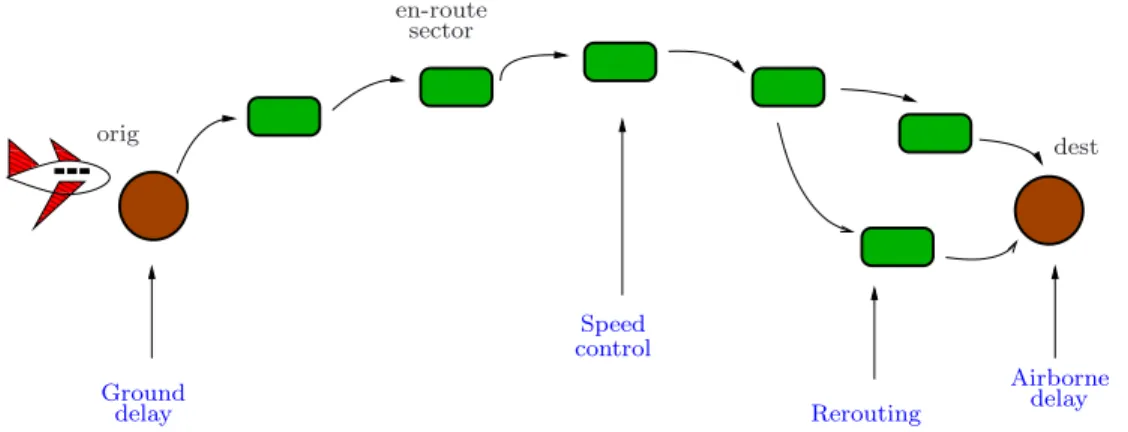
The FAA has a number of tools available at its disposal to achieve the goal of safe and expeditious aircraft movements. Some of the possible interventions are depicted in Figure 1-8. 00 00 11 11 00 00 11 11 0 0 1 1 000 000 000 000 000 111 111 111 111 111 000 000 000 000 000 000 111 111 111 111 111 111 00 00 00 11 11 11 Ground delay en-route sector orig dest Speed control Airborne delay Rerouting
Figure 1-8: Optimization Tools available to FAA. A brief description of each of these tools is as follows:
• Ground Delay: Delays are applied to flights at their origin airports that are bound for a common destination airport which is suffering from reduced capacity
or excessive demand. The premise for this tool is that it is better to absorb delays for a flight while it is grounded at its origin airport rather than incurring airborne delay near the affected destination airport which is both unsafe and more costly (in terms of fuel costs).
• Airborne Delay: Delays are applied to flights near the affected destination airport by making them hover in the air because of landing capacity limitations at the destination airport. This option is less preferred to ground-delays because of the reasons outlined in the preceding bullet.
• Speed Control: Within a sector, aircraft speed can be controlled to meter its arrival into the subsequent sector to match the controller workload and capacity limitations in different sectors.
• Rerouting: FAA uses this tool to alter arrival rate into a Flow Constrained Area (FCA), e.g., a weather affected segment of the airspace by rerouting flights to different routes.
GDPs and AFPs are some of the most extensively used ATFM tools currently. As already mentioned, GDPs control arrival rate into a weather affected airport whereas AFPs control arrival rate into a weather affected segment of the airspace. Unfortu-nately, these tools don’t take a network-wide view, thereby, not optimizing simulta-neously disrupted operations at other affected airports due to delay propagation. In addition, rerouting is done based on the National Playback [4] in current practice (in the US). This database comprises of alternative routes that should be taken to avoid parts of the airspace routinely affected by severe weather. These are computed based on historical data. Although, it has been found that this playback-based rerouting process sometimes leads to local congestion in the regions through which traffic is rerouted. Thus, the current state of affairs beg for a more scientific mathematical based approach that identifies on a global basis promising reroutes (and other ATFM interventions), while remaining capacity-feasible throughout.
1.3
Collaborative Decision-Making
The decision-making responsibilities in ATFM initiatives are shared between a num-ber of stakeholders (primarily, airlines and the FAA). This poses a major challenge as their actions are highly interdependent and demand real-time exchange of information between the FAA and the airlines. This realization of enhanced cooperation between
the various stakeholders led to the adoption of Collaborative Decision-Making (CDM) philosophy (Ball et al. [6], Wambsganss [39]) by the FAA in the 1990s. Under CDM, all ATFM initiatives are conducted in a way that gives significant decision-making responsibilities to airspace users (see Hoffman et al. [23] for details on CDM). All recent efforts to improve ATFM have been guided by this philosophy. The overall objectives of CDM can be summarized as follows (reproduced verbatim as visualized by the designers, please refer to Ball et al. [6] for more details):
• generating better information, usually by merging flight data directly from the Airspace System with information generated by airspace users;
• creating common situational awareness by distributing the same information both to traffic managers and to airspace users; and
• creating tools and procedures that allow airspace users to respond directly to capacity/demand imbalances and to collaborate with traffic flow managers in the formulation of flow management actions.
In the US, “Ration-by-Schedule” (RBS) is the fundamental principle for GDPs and all the CDM initiatives. We now elaborate upon this important principle below:
Ration-by-Schedule
Under this paradigm - arrival slots at airports are assigned to flights in accordance with a first-scheduled, first-served (FSFS) priority discipline (see Ball et al. [6], Wambsganss [39] for details on rationing). In the case of GDP planning, all stake-holders have agreed that this principle is fair to all parties. This allocation process is followed by a Compression algorithm, which fills open slots created by flights that are canceled. The compression procedure gives airlines an incentive to report accu-rate flight information, by rewarding them for reporting cancellations. The combined process, RBS plus Compression (formally called RBS++) is the policy currently in
use for slot allocations during GDPs. The success of RBS in a single-airport GDP setting is a consequence of the following three salient features:
1. The practical implementation of this principle is trivial and has a linear running time with respect to the number of flight steps. Thus, the approach is attractive from a scalability standpoint.
2. For an isolated GDP or AFP, the RBS method always leads to a solution that minimizes the minutes of system delay [36].
3. This notion of fairness is endorsed by the primary stakeholders (i.e., the FAA and the airlines) and is the industry accepted paradigm.
Despite the use of RBS in a GDP setting, there have been no network models that satisfy the RBS principle in a multi-airport setting. This is because, applying RBS to each of the airports individually might not lead to a schedule that preserves time, sector and flight connectivities. In addition, the imposition of a maximum permissible delay on each flight would mean that a feasible solution under RBS might not even exist if the capacity reduction at some airports is significant. Hence, there is no straightforward extension of RBS from a single-airport setting to an airspace context. Finally, Odoni and Lulli [26] discuss examples highlighting the intrinsic inequities in the network problem.
Operational Details of a GDP
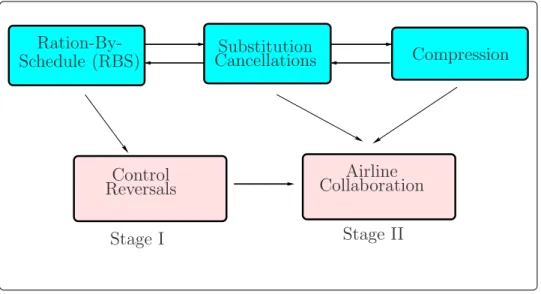
Figure 1-9 depicts a schematic diagram of the various stages of executing a GDP under CDM practice. There are three key stages involved in the decision-making process:
1. RBS for each ATFM program. FAA invokes the RBS policy to allocate ar-rival slots to the airlines for each ATFM program based on the original schedule ordering.
2. Airline response to schedule disruption. Based on the slots allotted, an airline is allowed to make changes to the schedule by canceling flights and swap-ping the slots of two or more of its own flights if they are compatible with the scheduled departure times.
3. Final coordination by the FAA.FAA accepts the relevant changes proposed by the airlines to come up with a overall feasible schedule. This is further complemented by Compression (wherein the FAA attempts to fill in any holes created by cancellations to further optimize the final schedule).
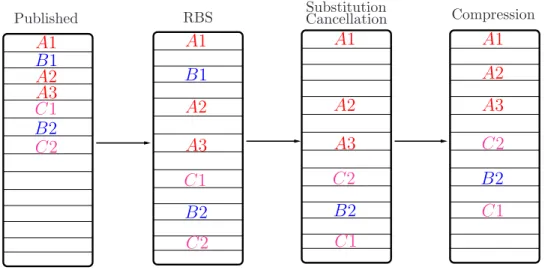
Figure 1-10 depicts an example illustrating the current operational details of a GDP. There are three airlines A, B and C operating seven flights between them. Airline A has 3 flights (A1, A2 and A3), Airline B has 2 flights (B1, B2) and Airline C has 2 flights (C1, C2) in the GDP. The original published ordering is shown in the leftmost table. The next table shows the output of applying the RBS principle to the original sequence. Assume that the capacity is reduced by half, thereby leading to an Airport
Ration-By-Schedule (RBS) CancellationsSubstitution Compression
Airlines
FAA
Figure 1-9: Schematic of a GDP under CDM.
Acceptance Rate (AAR) of one flight every two slots (compared to a flight every slot under nominal conditions). As a result, each flight is assigned a Controlled Time of Arrival (CTA) which is double the slot allotted in the original sequence. The RBS sequence is followed by substitution-cancellation phase wherein the airlines are given the flexibility of changing the order of the flights assigned to them as well as canceling flights as long as the resulting schedule remains capacity-feasible. In this example, Airline C substitutes flight C1 by C2 and Airline B cancels flight B1. The final step in this sequence is the application of the Compression procedure wherein flights are moved up to fill up the holes created by canceled flights (as long as the final allotment is compatible with the earliest arrival times of all flights).
Published RBS CancellationSubstitution Compression
A1 B1 A2 A3 C1 B2 C2 A1 B1 A2 A3 C1 B2 C2 A1 A2 A3 C2 B2 C1 A1 A2 A3 C2 B2 C1
1.4
Taxonomy of Existing Models
Table 1.3 summarizes a classification of the various ATFM models in terms of a broad set of characteristics that govern the exact setting of the problem being modeled. More precisely, factors like uncertainty, adaptability, connectivity, equity consider-ations and rerouting govern the clustering of various ATFM models. As should be evident from the table, the ATFM problem in full generality is as complex as an engineering problem can potentially get. The optimization paradigm needed is multi-stage dynamic and stochastic with the additional complexity of ensuring equity and operating within a collaborative setting. For a detailed survey of the various con-tributions and a taxonomy of all the problems, see Bertsimas and Odoni [12] and Hoffman et al. [23].
Characteristic Classification
Adaptability Static Dynamic
Connectivity N/w of Capacitated Resources Single Capacitated Resource
Control Single Decision-Maker Collaborative Decision-Making
Equity Without Equity Considerations With Equity Considerations
Rerouting Without Rerouting With Rerouting
Uncertainty Deterministic Stochastic
Table 1.3: Taxonomy of ATFM Models.
Odoni [27] first conceptualized the problem of scheduling flights in real time in order to minimize congestion costs. Thereafter, several models have been proposed to handle different versions of the problem. We classify the various models based on the characteristics listed in Table 1.3.
• Connectivity: Single Vs. Network.
– Single Capacitated Resource. The problem of assigning ground-delays in the context of a single-airport (Single-Airport Ground-Holding Problem, SAGHP henceforth) has been studied in Terrab and Odoni [33], Richetta and Odoni [30], [31].
– Network of Capacitated Resources. The problem of assigning ground-delays in the multiple airport setting (Multi-Airport Ground-Holding Prob-lem) in Terrab and Paulose [34], Vranas et al. [38]. The problem of con-trolling release times and speed adjustments of aircraft while airborne for
a network of airports taking into account the capacitated airspace (Air Traffic Flow Management Problem) has been studied in Bertsimas and Stock-Patterson [13], Helme [22], Lindsay et al. [25].
• Control: Centralized Vs. Collaborative.
– Single Decision-Maker. Most of the network models (e.g. Vranas et al. [38], Bertsimas and Stock-Patterson [13]) do not incorporate airlines into the decision-making.
– Collaborative Decision Making. As part of the CDM philosophy, re-searchers have also explored dynamic interaction with airlines. Towards this aim, Vossen, Ball [36] [37] have studied opportunities for slot trading in a single-airport setting where the aim is to formalize an optimization problem for the FAA given the offers to trade from various airlines.
• Equity. Socially Optimum Vs. Equitable Distribution amongst Airlines. – Without. Most of the network models (e.g. Vranas et al. [38], Bertsimas
and Stock-Patterson [13]) do not address fairness amongst airlines.
– With. Barnhart et al. [8] develop a way to address fairness in the context of network ATFM. They develop a fairness metric that measures deviation from FSFS and propose a discrete optimization model that directly mini-mizes this metric. They further develop an exponential penalty approach, and report encouraging computational results using simulated regional and national scenarios. Please refer to the PhD thesis of Fearing [21] for ex-tensive details.
• Rerouting. Fixed Trajectories Vs. Multiple Routes.
– Without. Most of the network models (e.g. Vranas et al. [38], Bertsimas and Stock-Patterson [13]) do not incorporate rerouting.
– With. The problem with the added complication of dynamically re-routing aircrafts (Air Traffic Flow Management Rerouting Problem) was first studied by Bertsimas and Stock-Patterson [14]. Recently, Bertsimas et al. [10] have presented a new mathematical model for the ATFM problem with dynamic re-routing which has superior computational performance.
– Deterministic. Most of the network models (e.g. Vranas et al. [38], Bertsimas and Stock-Patterson [13]) do not address uncertainty inherent in the capacity forecasts.
– Stochastic. One of the first attempts at dealing with Stochastic SAGHP was by Richetta and Odoni [30], [31]. Subsequently, Ball et al. [7] pro-posed another model for the same problem. Recently, Mukherjee and Hansen [3] study the SAGHP in a dynamic stochastic setting. Kotnyek and Richetta [5] present equitable models for the stochastic SAGHP and prove the equivalence of integrality and equity in the model presented in [31].
1.5
Starting Point: Bertsimas Stock-Patterson Model
In this section, we reproduce the Bertsimas Stock-Patterson model [13] for the ATFM problem which provides the starting point for all the models presented in this thesis.
Notation
The model’s formulation requires definition of the following notation:
K: set of airports,
F : set of flights,
T : set of time periods,
S : set of sectors,
Sf ⊆ S : set of sectors that can be flown by flight f,
C : set of pairs of flights that are continued,
Pif : preceding sector of sector i in flight f’s path,
Lfi : subsequent sector of sector i in flight f’s path,
Dk(t) : departure capacity of airport k at time t,
Ak(t) : arrival capacity of airport k at time t,
Sj(t) : capacity of sector j at time t,
df : scheduled departure time of flight f,
af : scheduled arrival time of flight f,
sf : turnaround time of an airplane after flight f,
origf : airport of departure of flight f,
destf : airport of arrival of flight f,
lf j : minimum number of time units that flight f must spend in sector j,
Tjf : set of feasible time periods for flight f to arrive in sector j,
Tfj : first time period in the set T f j ,
The Objective Function
The objective function minimizes the total delay costs (which is a combination of the costs of airborne delay (AH) and ground-holding delay (GH)). We use an adapted expression introduced recently in Bertsimas et al. [10].
The total delay (T D) cost is a combination of the costs of airborne delay (AD) and ground-holding delay (GD) (T D =GD+α·AD, whereα >1 because airborne delay is typically more costly than ground-holding delay). By substituting AD in terms of
T D (i.e., AD=T D−GD), the objective can be rewritten as α·T D−(α−1)·GD. Consequently, the objective function is composed of two terms: a first term that takes into account the cost of the total delay assigned to a flight and a second term which accounts for the cost reduction obtained when a part of the total delay is taken as ground delay at the origin airport. The objective function cost coefficients are a super-linear function of the tardiness of a flight of the form (t−ak
f)1+ǫ, with ǫ close
to zero. Hence, for each flight f and for each time period t, we define the following two cost coefficients:
cftotal(t) =α(t−akf)1+ ǫ
: total cost of delaying flight f for (t−akf)
units of time,
cfg(t) = (α−1)(t−df)1+ǫ : cost reduction obtained by holding flight f on the
ground for (t−df) units of time,
The motivation of using super-linear cost coefficients is that it will favor moderate assignment of total delays between two flights rather than assigning much larger delay to one as compared to the other flight. To elaborate, consider the following example:
Example 1.5.1. Suppose we wish to assign 2 units of delay to 2 flights. Then, an objective function with linear cost coefficients is equally likely to generate the following two assignments: i) 1 unit of delay to both flights and ii) 2 units of delay to one flight and 0 to the other. In contrast, super-linear cost coefficients (withǫ= 0.001 for example) will assign 1 unit to both flights because 11.001+ 11.001 <21.001+ 0.
The TFMP model
The complete description of the model, referred to as (TFMP), is as follows:
IZTFMP = min X f∈F X t∈Tdestf f cftotal(t)·(wdestf f,t−w f destf,t−1) − X t∈Torigf f cfg(t)·(w f origf,t−w f origf,t−1) subject to: X f∈F:origf=k (wk,tf −wk,t−f 1)≤Dk(t), ∀k ∈ K, t∈ T. (1.1a) X f∈F:destf=k (wfk,t−w f k,t−1)≤Ak(t), ∀k ∈ K, t∈ T. (1.1b) X f∈F:j∈Sf,j′=Lfj (wj,tf −wfj′,t)≤Sj(t), ∀j ∈ S, t∈ T. (1.1c) wfj,t−wjf′,t−l f j′ ≤0, ∀f ∈ F, t∈T f j, j ∈ Sf :j 6= orig f, j′ =P f j. (1.1d) worigf f,t−w f′ destf′,t−sf ≤0, ∀(f, f ′)∈ C, ∀t∈Tf k. (1.1e) wj,t−f 1−wfj,t ≤0, ∀f ∈ F, j∈ S f , t∈Tjf. (1.1f) wj,tf ∈ {0,1}, ∀f ∈ F, j∈ Sf, t∈Tf j .
The first three sets of constraints take into account the capacities of the various elements of the system. Constraints (1.1a) ensure that the number of flights which may take off from airportkat timet, will not exceed the departure capacity of airport
kat timet. Likewise, Constraints (1.1b) ensure that the number of flights which may arrive at airportkat timet, will not exceed the arrival capacity of airportkat timet. Finally, Constraints (1.1c) ensure that the total number of flights which may feasibly be in Sector j at time twill not exceed the capacity of Sector j at time t.
The next three sets of constraints capture the various connectivities - namely sector, flight and time connectivity. Constraints (1.1d) stipulate that a flight cannot arrive at Sector j by time t if it has not arrived at the preceding sector by time
t −lf j′. In other words, a flight cannot enter the next sector on its path until it
the preceding sectors on its current path. Constraints (1.1e) represent connectivity between flights. They handle the cases in which a flight is continued, i.e., the flight’s aircraft is scheduled to perform a subsequent flight within some user-specified time interval. The first flight in such cases is denoted as f′ and the subsequent flight as
f, while sf is the minimum amount of time needed to prepare flight f for departure,
following the landing of flightf′. Constraints (1.1f) ensure connectivity in time. Thus,
if a flight has arrived at element j by time ˜t, thenwfj,t has to have a value of 1 for all
later time periods (t ≥˜t).
In the remainder, we shall refer to the model just introduced as TFMP.
Remark 1. Aircraft and Passenger connectivities. In TFMP, flight connectivity constraints are included as hard constraints, i.e., they need to be satisfied a priori based on planned aircraft connections. In current practice, this is not exactly the approach taken due to the presence of hub and spoke networks which motivate the use of banks of flights arriving at a hub and then departing within a short duration of time. The presence of spare aircraft too inhibit the enforcement of strict aircraft connectivities. Nonetheless, we make a modeling choice to keep these constraints as they enable stronger polyhedral structure (thereby leading to shorter computational times) and are consistent with the original model proposed by Bertsimas and Stock-Patterson. Nonetheless, in all the models presented in this thesis, these constraints can be removed and our proposal will still remain entirely consistent with its global objectives. Thus, this modeling is not a consequence of any other restrictions. Fi-nally, the model does not capture Minimum Connection Times (MCT) to permit pax transfers.
1.6
Contributions and Thesis Outline
Very broadly, the thesis comprises of three core topics as illustrated in Figure 1-11. The first topic of fairness (or equity) is of central importance if any optimization-based proposal has to be deployed online. This is a consequence of the competitive marketplace and mistrust between the airlines and the FAA. The second topic of airline collaboration is more relevant now than ever before because of the acceptance of CDM philosophy. Finally, addressing capacity uncertainty is the third important topic. As already emphasized that convective weather and thunderstorms account for majority (around 70%) of the total delays. Thus, optimization models that consider static deterministic capacity are of limited practical use.
and optimization-based framework which will help FAA in identifying promising ATFM interventions dynamically while operating in a stochasticenvironment. These three topics are organized into two main parts of the thesis. A brief description of the two parts is as follows:
• Part 1: Extending CDM to an airspace setting. In the first part, we ex-tend the Collaborative Decision-Making (CDM) paradigm from a single-airport setting to an airspace context. More precisely, we propose an optimization framework in a network setting which incorporates fairness and airline collabo-ration (covered in Chapters 2 and 3).
• Part 2: Addressing capacity uncertainty. In the second part, we address the important issue of capacity uncertainty lacking in deterministic models. Towards this goal, we present the first application of robust and adaptive op-timization in the Air Traffic Flow Management (ATFM) problem (covered in Chapter 4).
Thesis Sub-parts
Fairness CollaborationAirline UncertaintyCapacity
Topic 1 Topic 2 Topic 3
Figure 1-11: Three core topics of the thesis. A brief summary of all the chapters is as follows:
• Chapter 2. Fairness. In this chapter, we present network models that in-corporate different notions of fairness, namely i) FSFS fairness - controlling number of reversals and total amount of overtaking; ii) Proportional fairness -equalizing airline delays; and iii) a combination of the FSFS and Proportional fairness paradigms. We provide empirical results of the proposed optimization models on national-scale, real world datasets spanning across six days that show interesting tradeoffs between fairness and efficiency. The important takeaways
are the possibility of generating schedules close to the RBS policy (at a less than 10% increase in delay costs) and the price of fairness for proportional fairness is negligible. We report promising computational times of less than 30 minutes on large-scale instances which are encouraging for real-time deployment.
• Chapter 3. Airline Collaboration. In this chapter, we allow for further airline collaboration by proposing network models for slot reallocation. This is a generalization of the intra-airline substitution phase of the current CDM prac-tice to inter-airline reallocation across multiple airports. An attractive feature of this stage of our proposal is the airline input in the form of AMAL (“at-most, at-least”) trade offers which enable multiple trade combinations to be possible without needing sophisticated data input. We develop two models: i) a gener-alization of the Vossen-Ball slot trading model to a network setting; and ii) a model based on the monotone variables used in the Bertsimas Stock-Patterson model. We study the polyhedral structure of the two models and design case studies to demonstrate the potential benefits to internal objective functions of airlines. Both optimization models solve to optimality in seconds.
• Chapter 4. Capacity Uncertainty. In this chapter, we address the issue of capacity uncertainty. We introduce a weather-front based approach to model the uncertainty inherent in airspace capacity estimates resulting from the impact of a small number of weather fronts moving across the National Airspace (NAS). The key advantage of our uncertainty set construction is its low-dimensionality (uncertainty in only two parameters govern the overall uncertainty set for each airspace element). We formulate the resulting ATFM problem under capacity uncertainty within the robust and adaptive optimization framework. We prove the equivalence of the robust problem to a modified instance of the deterministic problem and solve optimally the LP relaxation of the adaptive problem using affine policies. Finally, we report empirical results from the proposed models on real-world flight schedules augmented with simulated weather fronts that illumi-nate the merits of our proposal. The key takeaways are: a) the robust problem inherits all the attractive properties of the deterministic problem (e.g., strong integrality properties and fast computational times); b) the price of robustness is typically small; and c) adaptability leads to useful benefits.
Notation and Preliminaries
Throughout the thesis, we denote scalar quantities by lowercase, non-bold face sym-bols (e.g.,w∈R, k ∈N), vector quantities by lowercase, boldface symbols (e.g.,w∈ Rn, n > 1), and matrices by uppercase, boldface symbols (e.g., A ∈ Rn×n, n >1).
We use prime (′) to denote transpose (e.g., x′y). We denote by e the unit vector
(1, . . . ,1) comprising of all ones. The dimension is implicit in the context (e.g., e′w
Chapter 2
Network Models that Incorporate
Concepts of Fairness
The optimization model proposed by Bertsimas Stock-Patterson [13] (introduced in Chapter 1) took a viewpoint of a Centralized Decision-Maker (FAA) without ad-dressing the preferences of individual airlines. Such a perspective does not take into account the possible disparity in the distribution of delays across airlines. This is an important consideration given the competitive marketplace and the mistrust between the airlines and FAA. Consequently, in this chapter, we augment the optimization model to address this critical issue of fairness among airlines. We present empiri-cal and theoretiempiri-cal evidence that the models developed in this chapter provide high quality solutions on national-scale datasets in reasonable computational times.
2.1
Introduction
As mentioned in Chapter 1, the first goal in this thesis is to propose an optimization based approach that:
1. incorporates network effects and builds upon the ATFM literature; and
2. takes into account fairness considerations among airlines by building upon the CDM philosophy.
Specifically, our proposal consists of the following two stages:
Stage I - Network ATFM model incorporating fairness:
We generalize the classical ATFM models ([13]) to incorporate fairness considerations for airlines. The objective function used in the existing network ATFM models is to
minimize the total delay costs across all flights, i.e., the focus is on overall system efficiency. A disadvantage of such an approach is that the solution to such models can have a large number of reversals, i.e., the resulting order of flight arrivals can be quite different as compared to the published flight schedules. Moreover, across these reversals, there might be different number of time-periods of overtaking. Hence, the total overtaking across these reversals might be large. Because of this deviation from the original flight ordering, it becomes difficult to implement such a solution because of the coupling in the crew assignments and the use of hub and spoke networks. Thus, this leads to the application of First-Scheduled, First-Served (FSFS) fairness paradigm which enables control on the number of reversals and amount of overtaking. Furthermore, the resulting allocations might have disparity in the distribution of delays across airlines. This motivates the application of Proportional fairness. We propose integer programming models that add these fairness controls. The key output in this stage is the assignment of flights to different time periods.
Stage II - Slot reallocation through airline collaboration:
We generalize the notion of Compression, a key component of the current CDM practice in a single-airport setting to network-wide slot reallocation among airlines. Specifically, we propose an optimization model which takes as input the assignment of flights to different time periods from Stage I and permits the airlines to trade these assigned slots across different airports, thereby, resulting in improved internal objective functions. The model proposed for Stage II of our proposal allow airlines to react to the schedule determined in Stage I by taking into account their flights in the entire network and making appropriate tradeoffs.
Given that each of these two stages are quite detailed, we devote a full chapter to each one of them. As a result, this chapter exclusively focuses on Stage I of our proposal, namely, models for the network ATFM fairness which incorporates notions of fairness. Chapter 3 delves into Stage II of our proposal, namely, models for slot reallocation, thereby facilitating airline collaboration.
Figure 2.1 depicts the mapping of our proposal to various stages of the current CDM practice (introduced in Chapter 1). Stage I outputs the next best alternative to RBS, i.e, a schedule that minimizes the number of reversals (and amount of overtak-ing). Stage II generalizes the Substitution+Compression phase of the current CDM practice by utilizing models for slot reallocation. We believe this proposal presents a natural framework to extend CDM from an airport to an airspace context.
Ration-By-Schedule (RBS) CancellationsSubstitution Compression
Stage I Stage II
Control
Reversals CollaborationAirline
Figure 2-1: Mapping of our proposal with the current three-stage CDM practice. This chapter covers Stage I of the overall proposal whereas Chapter 3 covers Stage II.
Notation
W : set of airlines,
Fw ⊆ F : set of flights belonging to airline w,
Rj : set of pairs of flights that are reversible in resource j,
RS
: set of pairs of flights that are reversible in sectors,
RA: set of pairs of flights that are reversible at airports,
Tf,freversal′,j : set of time-periods common for flights f and f′ where a reversal
could occur in resource j,
Omaxf,f′,j : maximum amount of overtaking possible between flights f and f′
in resource j,
M : maximum permissible delay for a flight.
The key additions relative to the notation used in [13] are W, Fw, Rj, RS, RA,
Treversal
f,f′,j , Of,fmax′,j, M.
The sets Rj, RS and RA
We give next the definition ofRj (set of pairs of flights that are reversible in resource
j). We make a distinction between the case when the resourcej is a sector and when it is an airport.
Definition 2.1.1. For an airport k∈ K, a pair of flights (f, f′) belongs to Rk if the
following two conditions are satisfied:
1. destf = destf′ = k, i.e., the destination airport of both flights f and f′ is the
same. 2. ak
f ≤ a k
f′ ≤ akf +M, i.e., the scheduled time of arrival of flight f′ at the
desti-nation airport lies between the scheduled time of arrival of flightf and the last time period in the set of feasible time periods that the flight f can arrive at its destination airport.
Definition 2.1.2. For a sector j ∈ S, a pair of flights (f, f′) belongs to Rj if the
following two conditions are satisfied: 1. j ∈ Sf and j ∈ Sf′
, i.e., sector j is common to the path of flights f and f′.
2. ajf ≤a j f′ ≤a
j
f+M, i.e., the scheduled time of arrival of flight f′ in sector j lies
between the scheduled time of arrival of flightf and the last time period in the set of feasible time periods that the flightf can arrive in sector j.
For each pair of flights (f, f′)∈ Rj, we count areversal, if in the resulting solution,
flightf′ arrives before flightf in resourcej (i.e.,∃t such thatwf′
j,t > w f
j,t). We call the
reversals occurring in sectors as sector reversals and the reversals occurring at the airports asairport reversals. This clustering is motivated from fairness considerations in a network setting (elaborated upon later in the chapter). Figure 2-2 pictorially depicts a reversal. The shaded aircraft is scheduled to arrive before the non-shaded aircraft, but the opposite sequence is realized, thereby, leading to a reversal.
00 11001101 00 11001101 00 00 11 11 0 0 1 1 0 0 1 1 00 00 11 11 00 00 11 11 0 0 1 1 000 000 000 000 111 111 111 111 000 000 000 000 111 111 111 111 000 000 000 000 000 000 111 111 111 111 111 111 00 00 11 11 000 000 000 000 000 000 111 111 111 111 111 111 00 00 11 11
Published sequence Actual sequence
Figure 2-2: Pictorial depiction of a reversal.
Definition 2.1.3. The set of pairs of flights that are reversible in sectors (RS) and
at airports (RA) is defined as:
1. RS = [ j∈S Rj 2. RA= [ k∈K Rk
The set Treversal
f,f′,j and parameter Omaxf,f′,j
Definition 2.1.4. The set Treversal
f,f′,j (set of time-periods common for flights f and f′
where a reversal could occur) is defined as{Tfj′, . . . , T f j −1}.
To elaborate on Definition 2.1.4, Treversal
f,f′,j is the set of time-periods t, such that it
is possible to have the following assignment: wj,tf = 0 and wj,tf′ = 1. This assignment would imply that a reversal occurs at time t.
Definition 2.1.5. The parameter Omax
f,f′,j is defined as|Tf,freversal′,j |(cardinality of the set Treversal
f,f′,j ), and hence is equal to T
f j −T
f′
j −1.
To elaborate on Definition 2.1.4, Omax
f,f′,j is the maximum amount of overtaking
possible between flightsf andf′and would be attained whenwf j,Tfj−1
= 0 andwf′
j,Tfj′ =
1.
Example 2.1.1. Figure 2-3 depicts a reversible pair of flights (f, f′) ∈ RA. Let
destf = destf′ =k. In this example, the arrows correspond to the set of time-periods
common for both flights. Moreover, the set of time-periods marked by these arrows (except for the last one) constitute Treversal
f,f′,k . This is because, the model enforces wfk,ak
f+M = 1 at the outset and hence, it is not possible to have a reversal at a
k f +M. Finally, Omax f,f′,k =|Tf,freversal′,k |= 6. ak f akf +M ak f′ akf′+M
Feasible times of arrival for flight f
Feasible times of arrival for flight f′
Treversal
f,f′,k
Figure 2-3: A reversible pair of flights (f, f′)∈ RA (dest
f =k).
Solutions from (TFMP)
Here, we illustrate the difficulties relative to fairness considerations in the solutions obtained from the formulation (TFMP). We report a solution from (TFMP) for one