Al Alawi, M., Ray, S. and Gupta, M. (2019) A New Framework for Distance-based Functional Clustering. In: 34th International Workshop on Statistical Modelling, Guimarães, Portugal, 07-12 Jul 2019.
There may be differences between this version and the published version. You are advised to consult the publisher’s version if you wish to cite from it.
http://eprints.gla.ac.uk/191547/
Deposited on: 31 July 2019
Enlighten – Research publications by members of the University of Glasgow
Proceedings of the
34th International Workshop
on Statistical Modelling
Volume I
July 7-12, 2019
130$&&%*/(4 0' 5)& UI
*/5&3/"5*0/"-
803,4)01
0/ 45"5*45*$"- .0%&--*/(
7PMVNF**
&EJUFECZ
-VÓT.FJSB.BDIBEP
(VTUBWP4PVUJOIP
Proceedings of the
34th International Workshop
on Statistical Modelling
Volume II
July 7-12, 2019
Guimar˜aes, Portugal
A new framework for distance based
functional clustering
Maryam Al Alawi
1, Surajit Ray
1, Mayetri Gupta
11 School of Mathematics and Statistics, University of Glasgow, UK
E-mail for correspondence: [email protected]
Abstract: We develop a new framework for clustering functional data, based on a distance matrix similar to the approach in clustering multivariate data us-ing spectral clusterus-ing. First, we smooth the raw observations usus-ing appropriate smoothing techniques with desired smoothness, through a penalized fit. The next step is to create an optimal distance matrix either from the smoothed curves or their available derivatives. The choice of the distance matrix depends on the nature of the data. Finally, we create and implement the spectral clustering algo-rithm. We applied our newly developed approach, Functional Spectral Clustering (FSC) on sets of simulated and real data. Our proposed method showed better performance than existing methods with respect to accuracy rates.
Keywords: Functional data; Smoothing; Clustering; Spectral clustering.
1
Introduction
Clustering functional data (CFD) has been an active area of research in recent years. CFD aims to group curves with similar features in one cluster, and the cluster is usually represented by the mean of all the curves in the cluster. It is well documented in the clustering literature that clustering is an ill-defined problem, and the challenges such as finding the right number of clusters and proposals for appropriate measures of cluster accuracy is still an active area of research for multivariate clustering. Additionally, the high dimensionality of functional data and the lack of clear distributional theory for functional data makes CFD even more challenging. Nevertheless, there have been several algorithms proposed in the literature (see Jacques and Preda, 2014 and Tzeng et al., 2016 for a review of these approaches). In brief, these approaches can be divided into three main categories. The first, consists of the decomposition-based methods (or two-stage methods) which This paper was published as a part of the proceedings of the 34th Interna-tional Workshop on Statistical Modelling (IWSM), University of Minho, Portugal, 7-12 July 2019. The copyright remains with the author(s). Permission to repro-duce or extract any parts of this abstract should be requested from the author(s).
2 A new framework for distance based functional clustering
use the coefficients of the basis expansion as a finite dimensional data set, and apply regular multivariate clustering methods on these coefficients. The drawback of this approach is that the results of clustering depend on the choice of the smoothing technique, and might break down in the case when one constructs the curves from sparse data. The second category contains the nonparametric clustering techniques which rely on defining an appro-priate distance measure between the curves. The third category pertains to model-based clustering, that assumes a probability density on pre-specified parameters describing the curves. Although this approach has been imple-mented with some success, it is computationally intensive to implement and describing an entire curve with a few parameters might not be realistic in some cases. Moreover, most of these algorithms are application-specific. Thus, such algorithms might perform poorly beyond the context they were developed for. To our knowledge, there has been no comprehensive study to compare these three main categories of approaches.
In a multivariate setting, spectral clustering has been successfully applied to cluster high-dimensional data embedded in nonlinear manifolds. The swiss roll example is commonly used to illustrate the power of the spectral method which outperforms most other standard clustering methods such as k-means or model based clustering. Moreover, this clustering method can be easily implemented and most importantly does not require strong assumptions about the data. Taking into account the challenges for CFD as mentioned above, we develop a flexible framework to implement a spectral clustering method for functional data and through extensive simulations we have seen clear evidence of its superior performance in di↵erent functional data contexts.
We compared our proposed method with some existing CFD approaches that are commonly used and available in R. The methods are: funHDDC which clusters curves through their eigenspace projection (Bouveyron and Jacques, 2011), fd K-means which generalizes the concept of regular K-means for functions (Ferero-Bande et al., 2012) and FPCC which smooths the data, performs functional PCA and applies k-means on the scores. The remainder of this abstract is organized as follows. We present the outline of a two-stage technique for clustering functional data in Section 2. Section 3 shows a simulation scheme to examine the performance of the method. Finally, an application to the Berkeley growth data is illustrated in Section 4.
2
Functional Spectral Clustering
Our proposed algorithm is a two-stage distance-based functional spectral clustering approach or (FSC). First we obtain the smooth curves from the raw data by using a penalized fit. The resulting smoothed curves F ={F1, F2, ..., Fn}are used to create the distance matrix. We also propose
Al Alawi et al. 3 using the rate of change of the curves (i.e, the first derivatives, written as F0 = {F10, F20, ..., Fn0}) to create an alternative distance matrix. These dis-tance matrices are then used to create a new framework by generalizing the existing spectral clustering techniques (Ng et al., 2002), which are primarily designed for clustering univariate and multivariate data. In the following section, we will evaluate newly proposed FSC approaches, where FSC(Do)
stands for distances calculated using the curves, and FSC(D1), stands for
distances calculated from first derivatives of the curves.
3
Simulation study
To evaluate the performance of our approach, we set up a simulation study to show the performance of the functional spectral clustering approaches on functional data that involves shifts in either phase, or amplitude or both. That simulation scheme was initially introduced by Sangalli et al. (2010), but we have expanded and made some modifications to the scheme. Through the general template f(t) = 1⇤sin(t) + 1⇤sin t2/2⇡ , we added shifts to some curves to create a new group. We started with creating 90 curves over the period from 0 to 2⇡. Then we created another data set that consists of 90 curves over the period from 0 to 10⇡, to examine the per-formance of our method on periodic functional data with phase/amplitude variations. According to Chen et al. (2012), this type of functional data can be assumed to lie on a nonlinear functional manifold.
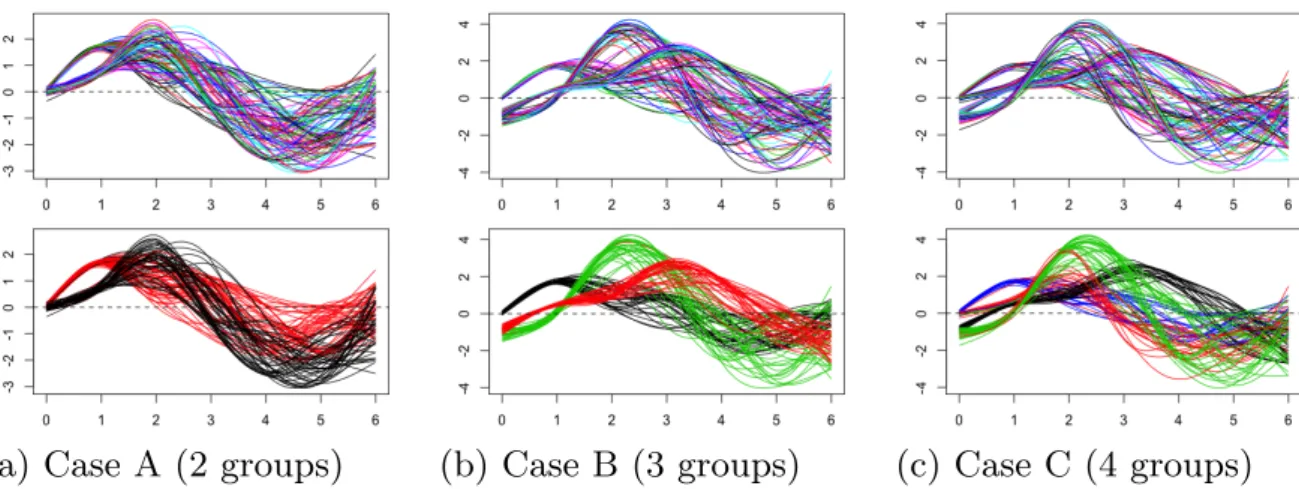
Figure 1 shows the simulated data, and the clustering results for the aperi-odic simulated functional data (0,2⇡). In all cases, our algorithm showed su-perior performance compared to the other methods (funHDDC,fd K-means, and FPCC), with respect to accuracy rates. Similar results were seen in sim-ulated periodic functional data.
4
An application to the Growth Data
We applied FSC to the Berkeley Growth Study data (Ramsay and Sil-verman, 2005) which includes the heights of 39 boys and 54 girls. Some individuals reach puberty earlier than others, which is reflected clearly in the first derivatives of the data, that shows the rate of change in heights over the years for the two genders. We applied both FSC(Do), and FSC(D1) to
compare the results. Once more, both these methods outperform the other clustering methods (funHDDC, fd K-means, and FPCC) in the growth data (Figure 2).
In summary, our distance based functional clustering approach is flexible, can accommodate di↵erent forms of functional data, and is easy to im-plement. Besides, it shows high accuracy rates and outperformed other methods in a variety of scenarios. Also, it is computationally faster than the other algorithms (likefunHDDC, andFPCC) and always converges, whilst other methods might not (like the fd K-means).
4 A new framework for distance based functional clustering
(a) Case A (2 groups) (b) Case B (3 groups) (c) Case C (4 groups)
FIGURE 1. The top row shows the smoothed version of the generated data, the
bottom row shows the clustering results after applying FSC(Do). In (A) the red
curves make up the first group, while the black curves represent the amplitude shift. (B) shows 3 groups, 2 of them, black and green curves, similar to case (A), along with the third group (red) with a phase shift added to the data. In (C),
a more difficult scenario is represented with 4 groups, three of which come from
case (B). Our algorithm was successful in all three cases.
0 5 15 25 80 120 160 200 time male female 5 10 15 0 5 10 15 20 time male female
FIGURE 2. Resulting clustering of the Berkeley Growth data using FSC(Do) with
accuracy rates 86% (left) and using FSC(D1) with accuracy rate 90% (right).
References
Bouveyron, C., and Jacques, J. (2011). Model-based clustering of time se-ries in group-specific functional subspaces. Advances in Data Analysis and Classification 5(4), 281– 300.
Chen, D., and Muller, H.-G. (2012).Nonlinear manifold representations for functional data. The Annals of Statistics 40(1), 1 – 29.
Al Alawi et al. 5 Febrero-Bande, M., and de la Fuente, M. O. (2012). Statistical computing in functional data analysis: The R package fda. usc. Journal of Sta-tistical Software 51(4), 1 – 28.
Jacques, J. and Preda, C. (2014).Functional data clustering: a survey. Ad-vances in Data Analysis and Classification 8(3), 231 – 255.
Ng, A.Y., Jordan, M. I. and Weiss, Y. (2002).On spectral clustering: anal-ysis and an algorithm. In: Dietterich, T., Becker, S., Ghahramani, Z. (eds.) Advances in Neural Information Processing Systems 14, pp. 849–856. MIT Press, Cambridge.
Ramsay, J.O. and Silverman, B.W. (2005). Functional data analysis. Springer-Verlag New York.
Sangalli, L. M., Secchi, P., Vantini, S. and Valeria, V. (2010). K-mean alignment for curve clustering. Computational Statistics & Data Anal-ysis 54(5), 1219 – 1233.
Tzeng, S., Hennig, C., Li, Y.F. and Lin, C.J.(2018). Dissimilarity for Func-tional Data Clustering Based on Smoothing Parameter Commutation. Statistical Methods in Medical Research 27(11), 3492 – 3504.