Using Web Services
Mustafa Bozkurt and Mark Harman
{m.bozkurt,m.harman}@cs.ucl.ac.uk CREST Centre, Department of Computer Science,
University College London Malet Place, London WC1E 6BT, UK
Abstract. We introduce a multi-objective formulation of service-oriented testing, focusing on the balance between service price and reliability. We experimented with NSGA2 for this problem, investigating the effect on performance and quality of composition size, topology and the number of services discovered. For topologies small enough for exhaustive search we found that NSGA2 finds a pareto front very near (the fronts are a Euclidean distance of∼0.00024 price-reliability points apart) the true pareto front. Regarding performance, we find that composition size has the strongest effect, with smaller topologies consuming more machine time; a curious effect we believe is due to the influence of crowding dis-tance. Regarding result quality, our results reveal that size and topology have more effect on the front found than the number of service choices discovered. As expected the cost-reliability relationship (logarithmic, lin-ear, exponential) is replicated in the front discovered when correlation is high, but as the price-reliability correlation decreases, we find fewer solutions on the front and the front becomes less smooth.
1
Introduction
Testing is one of the most widely used and important ways in which software engineers gain confidence in systems’ behaviour and with which they find faults. Testing is important for all kinds of software systems, but this paper is concerned with web service based systems. Trust is considered as one of the technical barriers’ to enterprises transition to such service-centric systems (ScS) [7]. One of the potential solutions for establishing trust among different stakeholders is testing, which potentially provides the necessary assurance in correct functioning of ScS. Not surprisingly, this pressing need has led to a dramatic recent increase in the number of publications on ScS testing [6].
Service oriented systems present many challenges to the tester. The services available for use can change repeatedly, frequently and unpredictably, while many may offer substantially similar services, but with different quality and performance attributes and at different costs. For the tester, this presents the challenge of a rapidly changing, non-deterministic system with important choices
to be made about the costs involved in testing; not merely execution costs, but monetary costs accrued from charges for third party service use.
In additional to the inherent complexities of web service testing, there is also a need to construct realistic test cases [1, 8, 11, 14–16]; test data that achieves fault revelation and which does so with test cases that are achievable in practice and understandable to the human tester and user alike. For instance, it has been argued that user session data is valuable precisely because it is real data [1, 11, 14]. Other authors have also developed testing approaches to harness realism in testing, drawing realistic data from the Graphical User Interfaces of the systems under test [8] and from ‘web scavenging’ for suitable test data [15, 16].
Our approach to the challenge of testing web services is to seek to exploit the flexibility and, more specifically, the composability of services as a key mecha-nism for finding suitable solutions. Essentially, we seek, not only to ameliorate problems in web service testing, but to turn these problems around using these very same demanding characteristics as the basis for potential solutions. Our approach recommends composition topologies that deploy existing services to generate realistic tests.
In previous work [4] we introduced the tool ATAM, which implements this approach. ATAM finds services that combine to form a composition topology (an acyclic graph in which nodes are services and edges denote input-output connectivity between each service). We demonstrated that this approach has the potential to help automate the process of finding realistic test data.
ATAM recommends a set of candidate topologies from which a user can select a suitable choice, resulting in an approach to generate realistic test data for the service under test. However, this does not completely solve the tester’s problem; there may be many services available from which to choose for each node of the topology. Since services may come at a cost and may offer differing degrees of reliability, there is an inherent multi-objective optimisation problem underpinning the final choice of services to select in order to concretise the topology. This choice is a balance the cost-benefit trade off.
In this paper we study this problem as a bi-objective typed selection problem, in which services of the right types for each node in the composition topology must be selected to balance testing cost against the reliability of the overall composition selected. We used NSGA2 to investigate the effect of three factors (composition size, composition topology and the number of services discovered) on performance (computation time) and quality (approximation to the pareto front). We used real world data on price to inform the cost choices and the results from our previous ATAM study [4] to determine the topologies to consider. However, we have no real-world reliability data available. Therefore, we study the effects of various models of the relationship between cost and reliability (logarithmic, linear and exponential) and various degrees of correlation strength (stronger, medium, weaker) between cost and reliability.
The primary contribution of this paper as follows:
1. We introduce a multi-objective solution to service-oriented test data gener-ation1. This approach is the first to apply multi-objective optimisation to service-based testing.
2. We present an investigation of the behaviour of our approach using different price-reliability models. We confirm that NSGA2 performs almost optimally on those problems for which problem size is sufficiently small to support exhaustive search for the globally optimal pareto front. On larger problems we find that size and topology have more effect on quality and performance than the number of service choices discovered. This is encouraging because it provides evidence that the approach may cope with (widely anticipated) significant increases in the number of services that will become available in the coming years.
The rest of this paper is organised as follows. Section 2 discusses existing test data generation approaches that use optimisation techniques and the concept of QoS in SOA. Section 3 explains the details of the proposed multi-objective optimisation for our approach. Sections 4 present the case study we used in our experiments. Section 5 describes our experimental methodology and presents discussion on the results from the experiments. Section 6 presents future work and concludes the paper.
2
Background
In this section, we discuss the approaches to test data generation that are most closely related to our approach and also provide a brief information on the con-cept of QoS in SOA. Due to space constraints we did not include how ATAM build topologies and group discovered services. The concept of service-oriented test data generation and details of the ATAM tool are discussed in an earlier paper [4].
2.1 Test Data Generation and Optimisation
Our approach formulates test data generation as application for multi-objective SBSE [12]. We seek service compositions that generate realistic tests of a given type using services not are necessarily designed for testing.
Multi-objective optimisation is not new to test data generation domain. Though our work is the first to use a multi-objective approach to service-based testing. Lakhotia et al. [13], Oster and Saglietti [18] and Pinto and Vergilio [19] already proposed multi-objective test data generation. These approaches focus on structural coverage as the main objective and use additional objectives such as execution time, memory consumption and size of test set. There are other approaches such as Sagarna and Yao [21] where branch coverage is formulated
1
as constrained optimisation problem. Similarly, Alshahwan and Harman [2] used a single objective search-based testing approach to generate test data to achieve branch coverage of server side code in PHP. The use of multi-objective opti-misations in test case selection has also been proposed. For example, Yoo and Harman [23] used objectives such as code coverage and execution cost in test case selection.
Search-based techniques are gaining popularity in testing and earlier ap-proaches applied some of these techniques to SOA. For example, Blanco et al. [3] used scatter search to generating test data for service compositions. Di Penta et al. [9] applied search-based techniques to reveal service level agreement vio-lations.
2.2 Quality of Service Models
Our approach leverages the ability to compose and orchestrate web services to achieve goals for which individual services may not have been defined. One of the advantages SOA is the ability to discover and compare services with similar business logic. The ability to compare services is enabled by a well-known concept called QoS in SOA.
QoS requirements generally refer to several functional and non-functional qualities of services in SOA [6, 22]. According to Wan Ab. Rahman [22] the most common QoS characteristics are service response time, performance, reliability, execution price (price from here on), availability and security. The explanation given to the four of these characteristics that are covered in this paper are:
1. Price: The monetary cost of invoking a service. There might exist multiple price plans for services but ATAM only considers the pay per use option. 2. Reliability: The capability of maintaining the quality of service. We accept
reliability as the percentage of invocations that maintained the expected QoS levels.
3. Availability: The presence of a service for invocation. We consider avail-ability as the percentage of time that the service available for invocation. 4. Response time: The amount of time that a service takes to respond
var-ious requests. Response time might be provided in different ways such as maximum or average time. In this research, we assume maximum response times are provided by QoS.
The need for a QoS model that covers necessary quality aspects of SOA also addressed by industry. OASIS introduced a QoS specification called Business QoS (bQoS) [17] in 2010.
3
Multi-objective Optimisation
In this section, we explain the necessary elements required to support replica-tion of results for the multi-objective optimisareplica-tion approach we propose here: the objective function and genetic operators. We also discuss the choice of our algorithm and parameter values selected for the genetic algorithm.
3.1 Objective Function
We introduce three different functions for the four QoS parameters we intend to include in the next version of ATAM: price, reliability, availability and response time. The reason for having three different objective functions is caused by our perception of combined reliability, availability and response time for composi-tions.
The objective function for the price parameter is straightforward. The func-tion is the sum of the costs of all services required in a topology. In our approach we considered price as an objective rather than a constraint in order to allow the tester to explore all the possible solutions on the pareto-optimal front. The following is introduced as the objective function for minimising total cost of test data generation: M inimize n X i=1 psi
wherenis the total number of services in the selected topology andpsi is price of theith service.
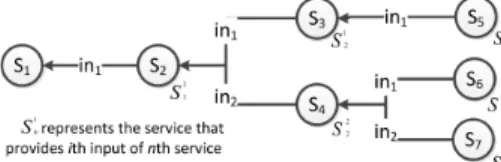
The objective function for the other three QoS characteristics are not as straightforward. The total reliability, availability or response time of a topol-ogy is as high as the combined value of each characteristic for all the services used in that topology. We introduced the concept of ‘combined characteristic value’ (referred to as combined value from this point on) because the reliability, availability and response time of an individual service is not solely defined by the behaviour of that service in isolation. For example in the case of reliability, the reliability of a service S also depends on the reliability of the services that generate the necessary input forS. Figure 1 illustrates an example solution and explains necessary concepts in combined value calculations.
Fig. 1: Example topology scenario for generating realistic test data using services. In the figure, each node in the topology represents a service description. In this scenario serviceS1is the service that
provides the required test input. The services on the other end, such asS5,S6andS7, are services
that either require tester input or automatically generated input using a predefined algorithm. Each edge in the figure represents an input required by the service that is targeted by the edge. The source of the edge is the service that provides the required input. For example, in this scenario, the input forS1is provided byS2.
The same formulation can be used in the calculation of combined values for reliability and availability. For response time however, we provide a third formulation. Due to space constraints we explain our formulation for reliability and availability focusing on the reliability only. The combined value for reliability (referred to as combined reliability (cr)) of a service is formulated as:
cr(Sn) =rSn×ir(Sn)
where cr(Sn) is the combined reliability andrSn is the reliability of the service
Sn andir(Sn) is the reliability function that calculates the combined reliability of the services that provide inputs forSn.
The reliability calculation for inputs (ir(Sn)) varies based on the number of services providing the input. This is because in our approach a service in the composition can get the required inputs in two possible manner:
case1 From the tester or predefined algorithm: In this case, the input reliability of the service is accepted 100% reliable (i.e. reliability score = 1.0). Services
S5, S6andS7in Figure 1 are examples to this case.
case2 From some arbitrary number of services: In this case, the input reliability of the service is equal to the lowest of the combined reliability of the services that provide its inputs. For example, serviceS3 takes input from serviceS5
whileS4takes input from two services S6 andS7as depicted in Figure 1.
In the light of these definitions, we formulated our input reliability function to suit these two cases as follows:
ir(Sn) = ( 1.0 ifSn is case 1 M IN(cr(S1 n), cr(Sn2), ... , cr(S in(Sn) n )) ifSn is case 2 whereSi
nis the service providingith input for serviceSn andin(Sn) is the total number of inputs serviceSn has.
The reliability score of a composition is equal to the combined reliability of the first service (service at the highest level). In the light of the given combined reliability calculation, the objective function for maximising the total reliability is formulated as:
M aximise rS1×ir(S1)
Having services that require inputs from multiple services allows ATAM to invoke the services which provide the inputs in parallel. Due to this parallel invocation ability response time needs to be calculated in a similar fashion to reliability and availability.
We formulated combined response time as:
cres(Sn) =resSn+ires(Sn)
where cres(Sn) is the combined response time andresSn is the response time of the serviceSn andires(Sn) is the response time function that calculates the combined response time of the services that provide inputs forSn.
There is also a minor difference in combined response time calculation. Even though the cases (case1 and case2) are also valid for response time the values for the cases are different. Function that suits these two cases for response time as follows: ires(Sn) = ( 0 ifSn is case 1 M AX(cres(S1 n), cres(Sn2), ... , cres(S in(Sn) n )) ifSn is case 2 whereSi
nis the service providingith input for serviceSn andin(Sn) is the total number of inputs serviceSn has.
We believe the testers use expected response time as a means to minimise the time it takes to generate test cases. As a result, the objective function needs to minimise the response time.
3.2 Representation and Genetic Operators
After discovering all possible topologies ATAM asks the tester to select one topology for test data generation. Then ATAM applies the optimisation process only to the selected topology using the service groups for this topology.
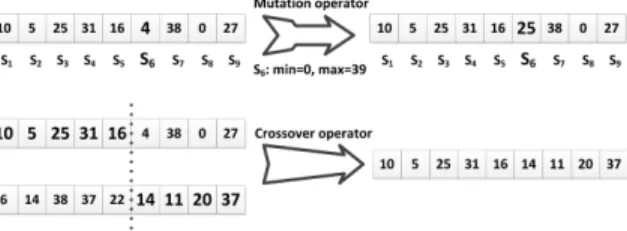
ATAM was implemented in a way to facilitate genetic operators (mutation and crossover) with service groups and topologies. As a result, in our multi-objective solution, genomes are represented as an array of integers as depicted in Figure 2. Each element in the array represents a ‘service group’ and values in each element represent a service that belongs to that group. The numbering of service groups and web services are based on the order of their discovery. For example, if the tester selects one of the topologies from Figure 2 the values of the elements in each genome represent the services which are in the places of
S1, S2, ..., S9 based on their order in the genome.
The initial population is generated using the number of services in each ser-vice group that form the selected topology. Each solution in the initial population is generated by randomly assigning a number to each array between 0 and the number of services in the service group which is represented by the element.
The mutation operator modifies the value in an element with a number be-tween 0 and the number of services that the group contains. The crossover op-erator produces a new solution by combining two solutions into a new solution as depicted in Figure 2.
Fig. 2: The mutation and the crossover operators
3.3 Mutli-Objective Algorithm and Parameters
We selected the Non-dominated Sorting Genetic Algorithm-2 (NSGA2) as op-timization technique for our problem due to its reported performance against other algorithms for similar problems [24]. We used a modified version of the popular ECJ framework [10] which provides a built-in NSGA2 algorithm, and integrated it to ATAM. After some tuning we found out that the ideal parame-ters that provide the most diverse solutions for our problem are: 35% mutation probability and one-point crossover with 50% crossover probability.
4
Case Studies
Not having real-world case studies is one of the major set backs in SOA testing research [6]. As expected, we were unable to find existing services with mea-sures of suitable QoS values. The only QoS characteristic that the authors have
access to is service cost. As a result, we selected a group of existing commer-cial services with publicly available pricing details (presented in Table 1) which are collected from the Remote Methods website [20]. Due to access restrictions on non-commercial users we were unable to verify the accuracy of the provided prices. We were also unable to verify continual service availability.
Service Price (per query)
Group Description Max Company Min Company 1 Phone verification $0.300 StrikeIron Free WebServiceMart 2 Traffic information $0.300 MapPoint Free MapQuest 3 Geographic data $0.165 Urban Mapping $0.010 Urban Mapping 4 Bank info verification $0.160 Unified $0.090 Unified
5 IP to location $0.020 StrikeIron Free IP2Location
6 Stock Quote $0.020 XIgnite $0.008 CDYNE
7 Historical financial data $0.017 Eoddata $0.007 XIgnite 8 Nutrition data $0.010 CalorieKing Free MyNetDiary
9 Web search $0.005 Google Free Bing
Table 1: Services used as a basis for the synthetically generated case study. The services and the given prices in this table are collected from Remote Methods website [20].
For 7 out of 9 groups in Table 1 we were able to identify at least two existing services with price details as a basis for determining the maximum and minimum prices. For groups 3 and 4 we were unable to find multiple services. However, for these two groups we used the prices from different subscription models of the same service. In some of the groups, outputs of free to use services might not be the same as the paid ones (due to the level of detail provided), however, we accepted these services as alternatives to the paid ones due to their similar service descriptions.
In our case study we focused on two QoS characteristics: cost and reliability. The reason for choosing cost is due to existence of real-world references and for choosing reliability is our better understanding of the concept compared to availability and response time.
At present, making a realistic projection on the relation between reliabil-ity and cost is a challenging task due to lack of real-world reliabilreliabil-ity data. To compensate, we defined three price-reliability models (referred to as model) that construe the relation between price and reliability as illustrated in Figure 3.
(a) Linear model (b) Logarithmic model (c) Exponential model
Fig. 3: Example reliability-price distribution of services in a group (Group size: 40 services) for all three models (with three very strong correlation).
We started generating our case study with the assumption that reliability and price are positively correlated. The reliability value for each service in each group cover is between 0.50 to 0.99. The cost value for each service in each group
is assigned using the minimum and maximum prices given on the Table 1. We generated 9 service groups with 40 services in each group for all 3 models initially. Data for other group sizes (20 and 30) are generated by removing service entries from the initially generated groups.
Composition size in the experiments represents the number of groups (start-ing from Group 1) that are included in a given topology. For example, composi-tion size 4 means a composicomposi-tion which includes the first 4 groups.
Fig. 4: Illustration of the topologies that are used in order to answer RQ2 and RQ4.
5
Research Questions and Experimental Validation
In this section, we provide the four research questions we used to investigate our approach, our method of investigation, results from our experiments and our answers to the research questions.
5.1 Research Questions
We ask the following four questions:
RQ1 Is there a relation between the used price-reliability model and the discovered pareto front?
RQ2 How is discovered pareto front affected by different levels of price-reliability correlation in the models?
RQ3 What are the effects of parameters such as composition size, group size and topology complexity on the discovered pareto front?
RQ4 What are the effects of parameters on performance?
5.2 Method of Investigation
In order to answer RQ1, we generated pareto fronts for all three models with most of the possible combinations (allowed by our cases study) using different group sizes (20, 30 and 40) and composition sizes (3,4,5,7 and 9). Then we investigated the fronts generated from these groups.
In order to answer RQ2, we created new case studies by introducing 3 differ-ent level of correlation (low, medium and high) in each model and investigated the fronts generated from these case studies. Figure 5 illustrates these three levels of correlation on the linear model.
(a) High (b) Medium (c) Low
Fig. 5: Different levels of correlation for the linear correlation model. The calculated Pearson’s cor-relation coefficients for each corcor-relation level from low to high are 0.8574, 0.9459 and 0.98412. The original distribution for this group is depicted in Figure 3a.
In order to answer RQ3 and RQ4, we developed 7 different topologies with different complexities as depicted in Figure 4. First, we investigated the fronts generated from these topologies to answer RQ3. We also compared the execution times of the generated topologies using different population size and number of generations in order to answer RQ4.
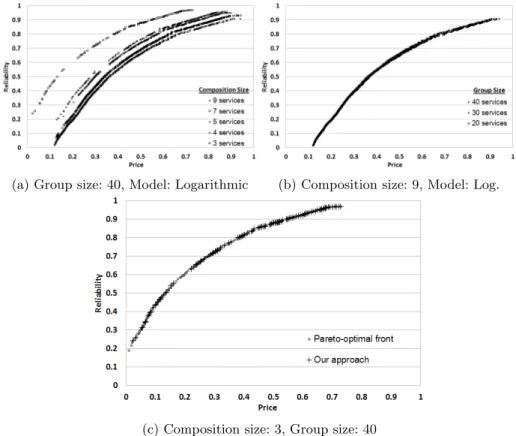
(a) Group size: 40, Model: Logarithmic (b) Composition size: 9, Model: Log.
(c) Composition size: 3, Group size: 40
Fig. 6: The effects of the parameters used in our experiments on the generated pareto-front. Com-position size represents the number of service groups that form a topology. Group size represents the number of web services in a service group. Model represents price-reliability relation. Figure 6c depicts the difference between the globally optimal front and the front discovered by our approach.
5.3 Results
The discovered pareto fronts for all models are depicted in Figure 6 and 9 (using the topology complexity (c1) in Figure 4). As can be observed from these figures, the discovered fronts are very closely related to the model used. Due to space constraints we only provide the fronts discovered using the logarithmic model from the original case study. We found out that the other models also comply with the trends observed from the logarithmic model. This similarity can be also observed in Figure 9.
The results suggest that the group size and composition size does have a minor effect on the overall form of the discovered pareto front. Composition size, as expected, causes a shift on the position of the discovered front. The results provide evidence for the fact that the observed shift is closely related with price of the added/eliminated service group in the composition. As depicted in Figure 6a, the biggest shift is observed between composition sizes 3 and 4 due to the relatively high price of the services in group 4. The effect of the reliability in this case is less observable due to the relatively low difference between reliability scores of services in each group.
Search-based optimisation techniques are often applied to problems with large solution sets due to their effectiveness in such scenarios. In our problem, the search space is not fixed and it can vary greatly (based on the composition and group sizes). We investigated the performance of our approach in small search spaces in order to compare to known globally optimal fronts. For topologies small enough for exhaustive search we found that NSGA2 finds a pareto front very near the true pareto front as depicted in Figure 6c. The Euclidean distance between the optimal front and the discovered front is∼0.00024 price-reliability points. We also measured the average execution time of our approach and the time it takes to calculate the optimal pareto front in Figure 6c. Exhaustive calculation of the optimal front took 4.5 seconds where as our approach (using NSGA2 with population size 400 and 100 generations) took 0.8347 seconds.
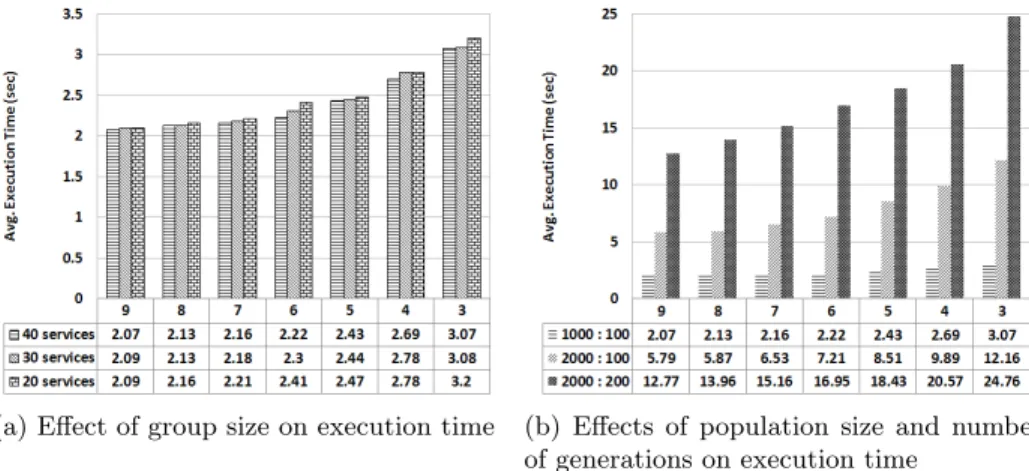
(a) Effect of group size on execution time (b) Effects of population size and number of generations on execution time
Fig. 7: The effects of the parameters used in our experiments on the execution time. The values in each graph represent the composition sizes. The average execution times for different group and composition sizes are provided in Figure 7a. The average execution times in Figure 7b are for dif-ferent population sizes and number of generations (given in the format “population size : number of generations”).
The effects of the parameters such as group size, composition size, population size and number of generations on the execution time are depicted in Figure 7. The results suggest that the effect of group size is negligible as depicted in Figure 7a. The performance difference between groups’ sizes is only fraction of a second for all composition sizes ranging from 0.02s up to 0.13s, whereas for almost all group sizes there is about 1s difference in execution times between composition sizes 9 and 3.
One unexpected effect which is very noticeable in both graphs is the negative correlation between the composition size and the execution time. We believe that this negative correlation is caused by ECJ’s internal mechanism that maintains crowding distance. In order to prove our hypothesis, we measured the execution of the same case study with different population sizes and different number of generations. The results from these experiments are depicted in Figure 7b.
During our experiments we also investigated the relation among composition size, number of generations and execution time. Our initial assumption was that higher the composition size and the number of generations longer it should take longer to execute. The results provided evidence for the validity of our assump-tion. When we increased the number of generations from 100 to 200 execution time increased 2.21 times for composition size 9 whereas 2.03 times for compo-sition size 3.
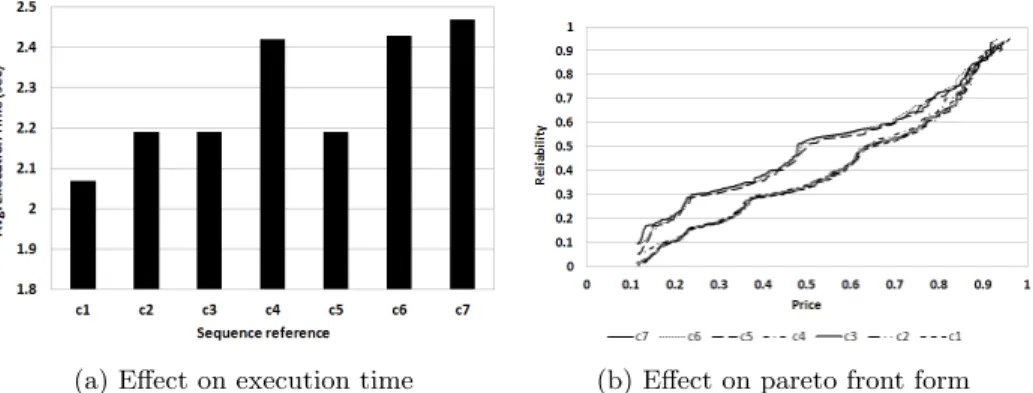
(a) Effect on execution time (b) Effect on pareto front form
Fig. 8: The effects of topology complexity on pareto-front and execution time. The labels on the graphs ((c1) to (c7)) represent the results for the topologies in Figure 4. Pareto fronts in Figure 8b are presented in a different form (lines instead of individual solutions as points) than the previous figures in order to make these 7 pareto fronts more distinguishable.
As mentioned, the results up to this point in the paper are collected using the topology (c1) in Figure 4. The effects of complexity on execution time and pareto front are depicted in Figure 8. Investigation of the results in Figure 8a shows a positive correlation between the number of services that require multiple inputs and the execution time. As in the case of topology (c1) the lowest execution time achieved because this topology doesn’t contain any services with multiple inputs. Whereas the topologies (c4), (c6) and (c7) (topologies containing 2 multiple in-put services) have the highest execution times. Another important observation was that a topology’s form has a negligible effect on execution times. For ex-ample, very similar topologies such as (c5) and (c7) have different execution times.
Complexity is found to have the highest effect among all parameters on the from of the discovered pareto front. This effect can clearly be observed in Figure 8b where the discovered fronts are separated into two distinct groups. The first group consists of topologies (c5), (c6) and (c7) and the second group consists of (c1), (c2), (c3) and (c4). The cause of this grouping is the similarities between the forms of the topologies in each group. The effect of complexity is almost negligible in higher reliability scores whereas, for the rest of the pareto front it is more visible. The fronts (c1) and (c7) in Figure 8b are a distance of ∼0.073 price-reliability points apart.
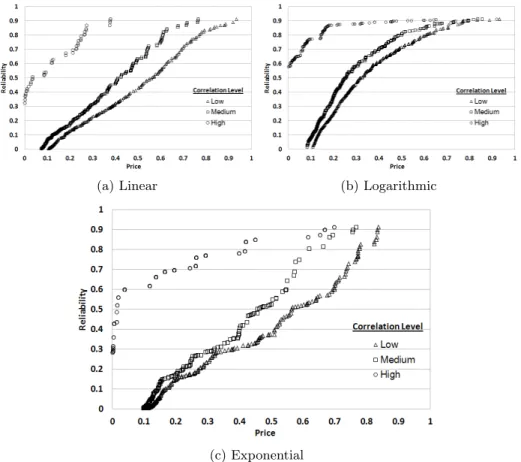
(a) Linear (b) Logarithmic
(c) Exponential
Fig. 9: Pareto fronts discovered from all three models (Composition Size: 9, Group size: 40 services) with different levels of correlation. The original distribution for this group is depicted in Figure 6.
The results suggest that correlation level in models have the highest effect on the form of the discovered pareto fronts as depicted in Figure 9. Comparison between the fronts of the original case study (Figure 6) and the modified ones shows that there is a positive correlation between the correlation level and the number of solutions on the discovered front. Correlation level has the same effect on all three models as depicted in Figure 9. We believe that this effect is caused by NSGA2 tendency to generate solutions around the services with better QoS scores than expected in the model.
5.4 Answers to Research Questions
The results depicted in Figure 6 and 9answer RQ1by providing evidence for the fact that thecost-reliability relationship is replicatedin the discovered pareto fronts when correlation is high. However, as the price-reliability correlation de-creases, less smooth fronts with fewer solutions are discovered.
The results also provide evidence for the fact that level of correlation in a model can effect the form of the discovered pareto fronts. The results, which
answer RQ2, suggest anegative correlation between the model correlation level and the number of solutions on the discovered front.
In order toanswer RQ3we have to provide a separate explanation for each parameter. The evidence from Figure 6b suggests thatgroup size has a negligible effect on the discovered pareto front compared to composition size and topology complexity. As for the effects of the composition size, the results suggest that as one might hope, thelower the composition size, the cheaper and more reliable the solution will be (using the same set of services and topology). The results from Figure 8b suggest that among all the three parameters we investigatedtopology complexity has relatively highest impact.
As for the answer to RQ4 regarding the performance, we find that com-position size has the strongest effect, with smaller topologies consuming more machine time; a curious effect we believe is due to the influence of crowding distance. The results suggest that group size has a negligible effect.
6
Conclusion and Future Work
In this paper, we presented a multi-objective solution to service-oriented test data generation. We focused on the cost of test data generation and the reliability of the test data sources as our primary objectives. We chose a widely used multi-objective algorithm NSGA2 and investigated the behaviour of our approach in possible different situations, drawn from different models and parameters for our problem and solution domain. The results provided evidence for robustness of our approach.
As for future work, we believe that our approach can be extended to be used in multi-objective service selection in service composition. The results from our experiments provide evidence for the robustness of our approach and to the possibility of adapting it to service selection (based on the detailed analysis on the execution times).
References
1. Alshahwan, N., Harman, M.: Automated session data repair for web application regression testing. In: ICST ’08. pp. 298–307. IEEE, Lillehammer, Norway (April 2008)
2. Alshahwan, N., Harman, M.: Automated web application testing using search based software engineering. In: ASE ’11. pp. 3–12. Lawrence,KS,USA (November 2011) 3. Blanco, R., Garc´ıa-Fanjul, J., Tuya, J.: A first approach to test case generation
for BPEL compositions of web services using scatter search. In: ICSTW ’09. pp. 131–140. IEEE, Denver, CO, USA (2009)
4. Bozkurt, M., Harman, M.: Automatically generating realistic test input from web services. In: SOSE ’11. pp. 13–24. IEEE, Irvine, CA, USA (December 2011) 5. Bozkurt, M., Harman, M.: Optimised realistic test input
gen-eration. Presented at the SSBSE ’11 (September 2011), http://www.ssbse.org/2011/fastabstracts/bozkurt.pdf
6. Bozkurt, M., Harman, M., Hassoun, Y.: Testing & verification in service-oriented architecture: A survey. STVR (To Appear)
7. CBDI Forum: http://everware-cbdi.com/cbdi-forum
8. Conroy, K., Grechanik, M., Hellige, M., Liongosari, E., Xie, Q.: Automatic test generation from GUI applications for testing web services. In: ICSM ’07. pp. 345– 354. IEEE, Paris, France (October 2007)
9. Di Penta, M., Canfora, G., Esposito, G., Mazza, V., Bruno, M.: Search-based testing of service level agreements. In: GECCO ’07. pp. 1090–1097. ACM, London, UK (July 2007)
10. ECJ 20: http://cs.gmu.edu/ eclab/projects/ecj/
11. Elbaum, S., Rothermel, G., Karre, S., Fisher II, M.: Leveraging user-session data to support web application testing. IEEE Transactions on Software Engineering 31(3), 187–202 (March 2005)
12. Harman, M.: The current state and future of search based software engineering. In: Briand, L., Wolf, A. (eds.) FOSE ’07. pp. 342–357. Los Alamitos, CA, USA (2007)
13. Lakhotia, K., Harman, M., McMinn, P.: A multi-objective approach to search-based test data generation. In: GECCO ’07. pp. 1098–1105. ACM, London, UK (July 2007)
14. Luo, X., Ping, F., Chen, M.H.: Clustering and tailoring user session data for testing web applications. In: ICST ’09. pp. 336–345. IEEE, Denver, CO, USA (April 2009) 15. McMinn, P., Shahbaz, M., Stevenson, M.: Search-based test input generation for string data types using the results of web queries. In: ICST ’12. p. 141150. IEEE, Montreal, Canada (April 2012)
16. McMinn, P., Stevenson, M., Harman, M.: Reducing qualitative human oracle costs associated with automatically generated test data. In: STOV ’10. pp. 1–4. ACM, Trento, Italy (July 2010)
17. OASIS: SOA-EERP business quality of service (bQoS) (September 2009), http://docs.oasis-open.org/ns/soa-eerp/bqos/200903
18. Oster, N., Saglietti, F.: Automatic test data generation by multi-objective opti-misation. In: G´orski, J. (ed.) Computer Safety, Reliability, and Security, Lecture Notes in Computer Science, vol. 4166, pp. 426–438. Springer Berlin (2006) 19. Pinto, G.H.L., Vergilio, S.R.: A multi-objective genetic algorithm to test data
gen-eration. In: ICTAI ’10. vol. 1, pp. 129–134. IEEE, Arras, France (October 2010) 20. Remote Methods: http://www.remotemethods.com/
21. Sagarna, R., Yao, X.: Handling constraints for search based software test data generation. In: ICST ’08. pp. 232–240. IEEE, Lillehammer, Norway (April 2008) 22. Wan Ab. Rahman, W., Meziane, F.: Challenges to describe QoS requirements for
web services quality prediction to support web services interoperability in electronic commerce. In: IBIMA ’08. vol. 4, pp. 50–58. International Business Information Management Association (IBIMA), Kuala Lumpur, Malaysia (June 2008) 23. Yoo, S., Harman, M.: Pareto efficient multi-objective test case selection. In: ISSTA
’07. pp. 140–150. ACM, London, United Kingdom (July 2007)
24. Zhang, Y., Harman, M., Mansouri, S.A.: The multi-objective next release problem. In: GECCO ’07. pp. 1129–1137. London, UK (July 2007)
![Table 1: Services used as a basis for the synthetically generated case study. The services and the given prices in this table are collected from Remote Methods website [20].](https://thumb-us.123doks.com/thumbv2/123dok_us/1114915.2648400/8.918.208.716.267.454/services-synthetically-generated-services-collected-remote-methods-website.webp)