ISSN 1750-4171
DEPARTMENT OF ECONOMICS
DISCUSSION PAPER SERIES
Entry and Exit in a Liberalised Market
Maria Jose’ Gil-Molto and Claudio Piga
WP 2005 - 10
Dept Economics
Loughborough University Loughborough
LE11 3TU United Kingdom Tel: + 44 (0) 1509 222701 Fax: + 44 (0) 1509 223910
http://www.lboro.ac.uk/departments/ec
Entry and Exit in a Liberalised Market
Maria José Gil-Moltó and Claudio A. Piga
Department of Economics
Loughborough University
May 16, 2006
Abstract
We analyze the entry and exit activity in the UK airline markets in the post-liberalisation period and study the di¤erential traits between tra-ditional and low cost carriers. Alongside with the characteristics tradition-ally highlighted as determinants of entry (e.g., airport presence and network economies), we …nd that the existence of charter or seasonal operators, prod-uct di¤erentiation opportunities and the level of quality provided by the in-cumbents are also relevant in explaining entry and/or exit. Despite the liber-alisation policies, the contestability of important large markets still seems to be limited.
J.E.L. Classi…cations: L11, L93
Keywords: Entry, Exit, Airlines, Conditional Logit.
1
Introduction
The airline industry has changed dramatically throughout the world in the last years. Technological innovations, deregulation and changes in demand characteristics have reshaped considerably the industry and as a consequence, the competitive practices
Corresponding author. Loughborough, Leicestershire LE11 3TU, United Kingdom, tel +44-(0)1509-222755 fax +44-(0)1509-223910 email: c.a.g.piga@lboro.ac.uk. Piga gratefully acknowl-edges the British Academy grant LRG-35378
by the participants in those markets (Borenstein, 1992).1 In Europe, the liberali-sation process started in 1987 and has developed gradually, granting progressively more rights to European carriers to operate within the European market, till 1997 when permission was granted to European carriers to operate domestic ‡ights in member countries other than their home market. In 2004, a last legislative package was issued by the Commission with the aim to create a Single Paneuropean Sky by integrating the air management structures of the member countries.2
With regards to the e¤ects of liberalisation various empirical studies have shown positive e¤ects on fares and increases in consumer welfare (Morrison and Winston, 1990; Schipper et al., 2003). Whether a market liberalisation is socially bene…cial hinges around the creation of the conditions for a sustainable contestable market structure. These include low sunk costs, both exogenous and endogenous, and the existence of potential competitors who can easily enter and exit (Bailey and Panzar, 1981; Motta, 2004). Generally, an airline is considered a potential entrant if it is already serving one or both of the endpoints of a route (Berry, 1992; Morrison and Winston, 1990). Such a presence, when the costs of entry and exit are low, is sup-posed to be su¢ cient to limit the exercise of market power (Hurdle at al., 1989; Ito and Lee, 2004; Goldsbee and Syverson, 2004). Other studies of the airlines market, however, reveal how the competitive outcome is best approximated when potential competition turns into actual competition (Borenstein, 1992). Interestingly, in a combined study of entry and exit, Joskow et al. (1994) show that entry and exit have opposite sign e¤ect on average price levels but not on output. A particular type of actual and potential competitors that has become increasingly important in recent years is that of the low cost carriers (henceforth, LCC), the most notable examples being Southwest Airline in the U.S. and Ryan Air and Easyjet in Europe (Boguslaski et al., 2004; Piga and Filippi, 2002). These have been posing a very signi…cant competitive pressure on traditional carriers, both in the roles of potential and actual competitors.3
To address the issue whether market forces are operating as freely as possible,
1For a discussion of the economic aspects of code-sharing alliances, see Brueckner (2001).
Evi-dence suggesting that non-linear pricing and price discrimination are common yield management practices is given in Giaume and Guillou (2004), Pels and Rietveld (2004) and Stavins (2001).
2Regulations (EC) No 549/2004, 550/2004, 551/2004 and 552/2004.
3The success enjoyed by these companies’business strategy has induced the imitation by airlines
located in other parts of the world. For instance, de Oliveira (2004) studies the entry patterns of the Brazilian LCC Gol and its evolution over time.
various studies investigated what drivers a¤ect an entry or exit decision. Airport presence seems to be a key factor for the after-entry pro…ts of operating in a given citypair route (Berry, 1992). Moreover, an airline’s entry and exit behavior is found to be signi…cantly in‡uenced by its own (but not its competitors’) network (Mor-rison and Winston,1990). Both results support the notion that, in the U.S. post-deregulation, hub-and-spoke networks were valued not only for the cost savings they permitted, but also for the market power they o¤ered (Borenstein, 1989).4
Here, the analysis will focus on the entries and exits by airlines in European routes departing from the ten main UK airports for the period January 1997 to June 2004, that is, immediately after the industry was fully liberalised. Our study is in the line of Berry (1992) and Boguslaski et al. (2004) but departs from previous contributions in a number of aspects. First, we study the characteristics that make an entry (or an exit) arise in one route but not in another substitute route, using a conditional logit model.5 Second, this is, to the best of our knowledge, the …rst study
of entries conducted with European data. More speci…cally, the entries (exits) made by the main airlines (main LCC and main traditional carriers) are considered. Third, given the LCC increasing presence in the European markets, we investigate whether their entry (exit) behavior di¤ers from that of the traditional carriers (TC).6 Finally, we tackle some issues not previously studied, such as the impact of the presence of seasonal and charter carriers and the level of quality provided by incumbents on the likelihood of entry and exit.
Our descriptive analysis shows that the LCC, relative to the TC, were responsible for a greater share of entries and a lower share of exits in the period under study. Further, a considerable increase in the number of routes operated to/from regional airports is also observed. Our econometric analysis indicates that entry and exit are less likely in large markets, suggesting that they tend to occur in routes not covered by traditional carriers. The presence of charter ‡ights attracts entry, but appears unrelated to exit. As far as concentration is concerned, the …ndings suggest
4Although the hub-and-spoke model remains the predominant network structure in the airline
industry, Boguslaski et al. (2004) observe that in the 1990s Southwest, a LCC, has avoided building a hub-centric network of its own, preferring to enter denser markets with higher per-capita incomes.
5Traditionally, the empirical studies of entry in airline markets have used cross-sectional probit
models in order to explain entry vs. no-entry in a given route. This implies assuming that the decisions of entry across alternative routes are independent.
6Some studies such as Boguslaski et al. (2004), de Oliveira (2004) and Lederman and
Januszewski (2003) have aimed at explaining the entry strategies of LCC without comparing them with those of traditional carriers.
a greater probability to observe entry where at least another company is already operating. Consistently with the descriptive analysis, the main UK LCC exhibit a greater propensity to entry relative to the main traditional counterparts: this is particularly evident for the countries with the largest share of passengers’ tra¢ c. Overall, the estimation results indicate that many factors that have been overlooked in the existing literature, are important indicators of the probability to observe an entry or an exit from a route. Finally, we observe limited entry and exit activity in important, large markets, which raises concerns about their contestability in spite of the liberalising e¤orts to enhance competition.
The remainder of the paper is structured as follows. Section 2 describes the data sources and de…ne entry and exit while Section 3 illustrates some of the dis-tinguishing traits characterising the post-liberalisation evolution of the British Civil Aviation market. In section 4 we present the hypotheses underlying the variables used in the empirical models together with some descriptive statistics. In section 5 and 6 we illustrate our methodology and present the estimation results respectively. Section 7 concludes by discussing some of the policy implications of our study.
2
De…ning entry and exit
We de…ne an "entry" as the …rst scheduled operation by an airline on a speci…c route. Analogously, an "exit" is de…ned as the last scheduled operation by an airline on a speci…c route. This solves the problem of wrongly identifying seasonal ‡ights (i.e. ‡ights operated only in periods of high demand) as entries/exits. For de…nitional purposes, henceforth a route corresponds to an airport pair (e.g., London Stansted - Rome Ciampino), while a market to a citypair (e.g., London with its four main airports and Rome with two).
We have used data produced by the UK Civil Aviation Authority (henceforth, CAA) to identify entries and exits. The CAA publishes on-line two types of data that were used in this study. The …rst considers punctuality statistics for all the ‡ights (i.e., domestic, European and International) operated from the ten main UK airports.7 Information is published each month which shows the average delays
7These are London Heathrow, Gatwick, Stansted, Luton and City Airport, Birmingham,
Manchester, Glasgow Int., Edinburgh, Newcastle. The choice of these airports is mostly based on historical reasons, as in the past they were classi…ed as the largest in terms of passengers tra¢ c. Although such a classi…cation may not hold any more, the CAA continues to release information on these airports.
on scheduled and charter services at each of the airports both in total and at an individual route/airline level. Also, other company-speci…c monthly data are made available, such as the number of ‡ights operated on a given route. This is su¢ cient to determine airlines’entries and exits. Indeed, the date of entry or exit corresponds to the …rst or the last period in which the CAA reports data for an individual route/airline combination.
Various cautions were taken in the coding of these entry and exit dates. For instance, entry/exit may result from the merger of two airlines. Although it was not possible to track the e¤ects of all the mergers that took place over the period of interest, corrections for the two most important ones in the British market were made, namely for the Ryan Air Buzz merger in March 2003 and the Easyjet -GoFly one in December 2002.8 Also, there were cases where some traditional carriers
created their low-cost subsidiary, e.g., BMI British Midland and BMIBaby. In these cases, the CAA may have started by coding the route serviced by the subsidiary as if run by the holding company but, at a later stage, it may have switched to using the proper subsidiary name. To prevent the spurious creation of entries and exits, the subsidiary names were all recoded to that of the holding company.
The second type of CAA data used in our study is a collection of monthly passengers tra¢ c statistics from practically the universe of UK airports, broken down, at the route level, into scheduled and charter ‡ights. From these records it is possible to build up pictures of the activity at each reporting airport. It is noteworthy that the tra¢ c statistics are not company-speci…c, therefore it is not possible to determine how a company expanded its operations by making use of secondary airports. However, tra¢ c information from the entire network of British airport enables the creation of market (i.e., citypairs) attributes that may in‡uence a …rm’s observed decision to start or exit a route departing from one of the ten main airports located in the same citypair. Punctuality statistics, and therefore entry and exit dates, are available from January 1995, while tra¢ c statistics are available only from January 1997 until June 2004. Consequently, the latter time interval is the one used in our estimation sample.9
8Because both Easyjet and Ryan Air continued to service the majority of routes of the merged
…rms, it would be incorrect to code their operations as new entries into a route. Similarly, the route terminations by GoFly and Buzz were not coded as exits. More generally, services terminated due to a company’s bankrupt were coded as exits.
9June 2004 was obviously excluded from the exit model estimation sample, as it was impossible
3
The Evolution of the British market
Liberalisation of air transport in the European Union was the subject of a number of “packages" of measures, the third of which was adopted in July 1992 and applied as from January 1993. This package gradually introduced freedom to provide services within the European Union and led in April 1997 to the freedom to provide cabotage, i.e. the right for an airline of one Member State to operate a route within another Member State.10 Thus, before discussing the features of the empirical model of entry and exit, a descriptive analysis of the evolution of the British airline market with regards to its domestic and European routes is developed, in an attempt to highlight some of the e¤ects of the liberalisation policies. Such an analysis will also provide some basis for the estimation strategy.
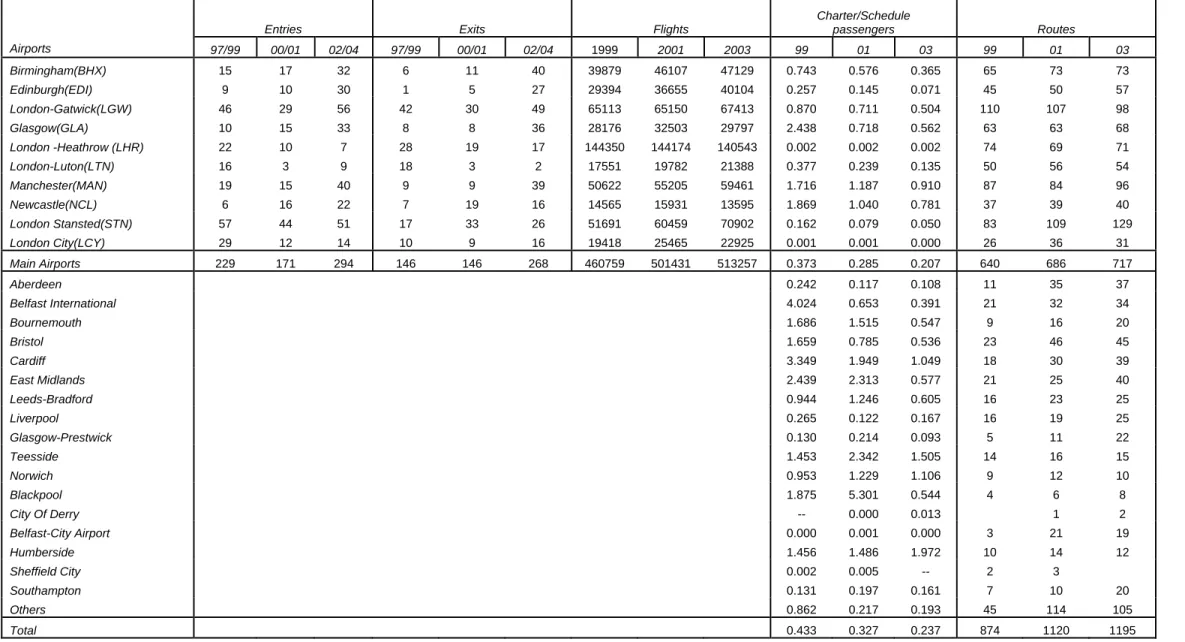
Table 1 provides yearly statistics on the number of entries, exits, ‡ights, routes, and the mean number of competitors in the operated routes, broken down at the company’s level. The …gures reported pertain only to the airlines’ activity from the ten airports for which punctuality statistics are available. The companies are broken down in three groups. First, data is reported for the six main LCC: Ryan Air, Easyjet, GoFly, KLM UK (Buzz), MyTravelLite and FlyBe. Second, the largest traditional carriers are considered. These include former ‡ag-carriers and other important players in either the UK or in other countries. The combination of main LCC and main traditional carriers will be referred to, in the remainder of the study, as "Main Airlines". Third, a fringe of other airlines is included in the data whose consideration may shed some light on the e¤ects of the liberalisation process on the British market, in particular as far as its contestability is concerned.
First, note the increasing number of entries/exits taking place after the liber-alisation process, which became e¤ective in 1997. Overall, one can see that in the period 97-99, a mean of 76 entries occurred yearly in the period 1997-1999 (229 in total), increasing to an average per year of 86 in the period 2000-01 (171 in total for that period) and 117 in the period 2002-2004 (294 in total).11 With respect to LCC,
one can see that in the period 97-99, a mean of 20 entries occurred yearly in the period 1997-1999 (59 in total), increasing to an average per year of 29 in the period 2000-01 (58 in total for that period) and 38 in the period 2002-2004 (96 in total). A
10See http://europa.eu.int/comm/transport/air/index_en.htm for more on the legislative and
the institutional framework.
similar picture can be drawn from the data on exits, routes and number of ‡ights, which also show an increasing trend. Moreover, it is noteworthy that the ratio of LCCs’entries over LCC’s exits is higher than that of the total sample, showing that LCCs have been partly replacing traditional carriers in the market. As a result, the proportion of routes operated by LCCs rose from 18.90% in 1999 to 31.25% in 2003. Similarly, the proportion of LCCs’‡ights rose in the period 1999 to 2003 from 18.90% to 28.02%.
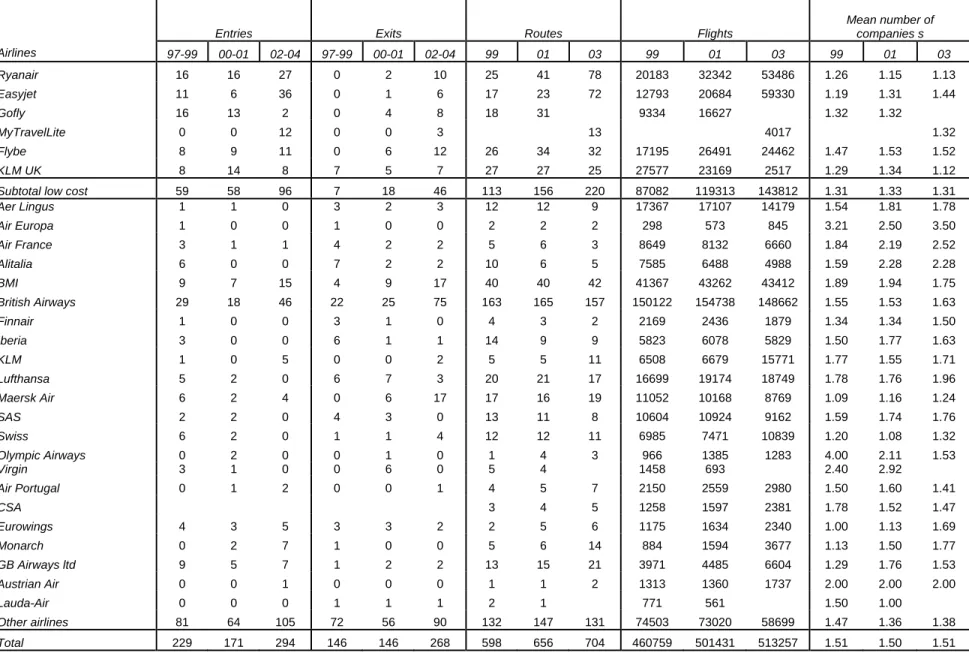
Table 2 reports yearly …gures by country on the number of entries, exits, ‡ights, companies, routes and the ratio of number of scheduled and charter passengers. Note that the latter two statistics are derived from the tra¢ c data source, and therefore include information on routes originating from all the UK airports. For the subset of the eight largest countries in terms of passengers’ tra¢ c - namely Spain, France, Italy, Germany, Irish Republic, Netherlands, Switzerland and UK -a subtot-al is -also provided. This subset is henceforth denoted -as "M-ain Countries". Not surprinsingly, the majority of entries and exits (80.70% and 80.53% respectively) take place in routes with origin or destination in the main countries. Moreover, the total number of airlines operated in each country has remained fairly stable throughout the series (increasing only in Finland and Portugal), while the number of routes has generally increased in all countries, with the notable exceptions of the Netherlands, Norway and Sweden. Quite relatedly, the number of ‡ights to the Netherlands, Belgium, Finland and Norway have slightly decreased. The latter two points suggest a di¤erential e¤ect of the liberalisation process based on route distance. Borenstein (1992) points out an increase in concentration of shorter routes after deregulation in the U.S., and argues that this is a re‡ection of the growth of the hub-and-spoke operations that disappears once direct ‡ights only are considered. In the present case, only direct routes are included in the sample, and therefore the more intense activity in destinations to farther countries is likely to be due to the presence of economies of scale arising from the …xed costs in the take-o¤ and landing phases. Another relevant aspect, which will the subject to further econometric analysis, regards how the proportion of charter ‡ight passengers over scheduled ‡ight passengers has been consistently decreasing, an indication that charter ‡ights are being replaced by scheduled ‡ights.
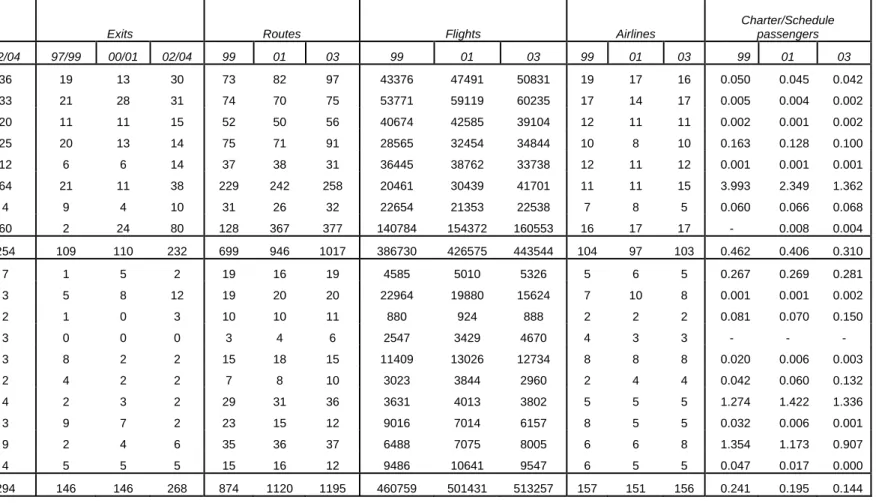
Table 3 shows yearly statistics by UK departing airport on the same variables illustrated in Table 2. The three largest airports for number of ‡ights and routes are Heathrow, London Gatwick and London Stansted. Interestingly,
London-Heathrow and London-Luton have the lowest ratios of entries and London Luton and Manchester the lowest ratios of exits proportionally to their size (measured in number of routes or number of ‡ights at the beginning of the sample). This might indicate that large established airports are less attractive for new entrants and also that they are more stable (i.e., they may exhibit a lower exit rate). Furthermore, the number of routes from the main airports has increased substantially only for the case of London-Stansted, while secondary airports managed to expand signi…cantly the routes covered, as the cases of East Midlands, Aberdeen, Bristol and Cardi¤, Glasgow-Prestwick, Belfast-City and Southampton indicate. This is one of the most visible e¤ects of the liberalisation, resulting in a greater variety of products available to British and European travellers.12 Quite relatedly, the ratio of number of char-ter/scheduled ‡ights passengers has constantly declined in both main and secondary airports, remaining stable only for the Teesside and Norwich airports. Generally, this is indicative of a replacement e¤ect that may have important implications on the Civil Aviation market structure and that of other vertically related sectors, such as the tourist industry where charter ‡ights are sold as part of package holidays o¤ered by tour operators.13
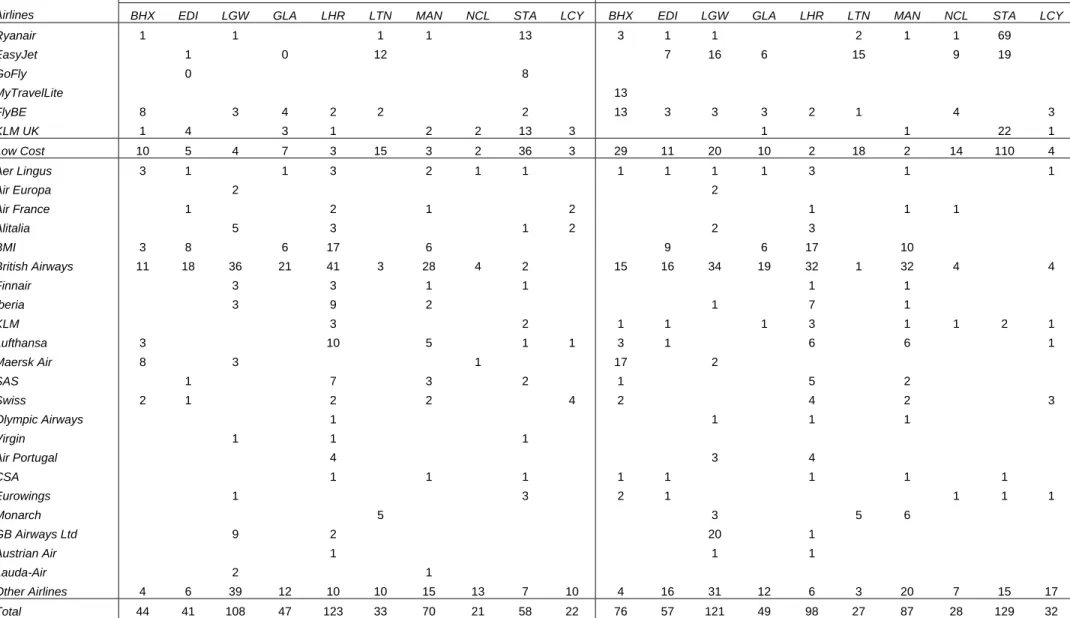
Table 4 illustrates the number of routes served by each airline from each of the UK ten main airports. The existence of a large proportion of routes that are operated by an airline originated from the same airport might indicate the existence of a hub or at least, the existence of a dominant …rm in the airport. Interestingly, London Heathrow and Manchester seem to be hub airports for British Airways and BMI and London Gatwick for GB Airways. Note how LCC have been rarely operating from those "hub" airports (especially from Heathrow) and seem to have concentrated in other airports with no clear dominant …rm. Also, it is clear that in a strategy similar to creating "hubs", some of the LCC have concentrated their business in one airport, as it is the case of Ryanair and KLM UK in Stansted and MytravelLite and FlyBe in Birmingham, while Easy Jet has diversi…ed its airport presence since 1998.
12As predicted in Salop (1979), excessive entries may have taken place. However, the di¤erence
between the socially optimal number of routes and the actual one is small when the …xed cost of opening a route is also small. The latter is being suggested by the easiness with which some established LCC have created a very large European network in the 1997-2005 period.
13It has been noted that the success of LCC may have started a process of disintermediation,
where travel agents are being replaced by Internet booking, and unbundling, where transport is not part of the tour operators’packages (see Motta, 2004). Such tour operators as MyTravel, Thomson and TUI have reacted by establishing their own LCC, respectively, MyTravellite, ThomsonFly and HapagLLoyd.
In our empirical study we will test whether entries are more likely to take place in less established airports without a dominating …rm and whether hub economies are important determinants of the likelihood of entry for both low cost and traditional carriers.
4
An empirical model of entry and exit
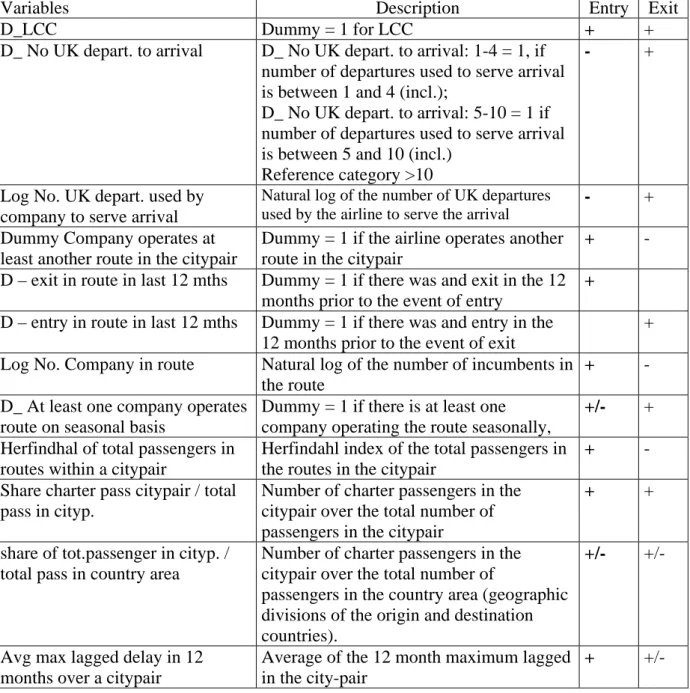
A …rm’s decision to enter or exit a route is analysed by focussing on the character-istics of the route itself, de…ned here as an airport pair (e.g., London Stansted and Rome Ciampino). In addition to route attributes, the characteristics of markets, de-…ned as citypairs (e.g., London-Rome) are considered, together with an evaluation of how both route- and market-speci…c factors di¤er in the case of the main LCC operating in UK. In this section we provide a detailed description of the explanatory variables used in our models of entry and exit. Table 5 shows how the variables were constructed and the expected sign of their e¤ect on the dependent variable.
Number of UK departures serving the arrival - D_ No UK depart. to arrival Some major destinations tend to be served by many di¤erent, geographically dispersed, departure airports. In order to di¤erentiate its service, an airline might choose to begin to service a destination only as long as there are not too many other departure airports with ‡ights to the same destination. It is expected that the likelihood of an airline starting ‡ights to a destination decreases with the number of departure airports o¤ering services to that destination. Arguably, a …rm is also more likely to consider exiting from a destination served by many origins.
Number of UK departures used by the airline to serve the arrival - Log No. UK depart. used by company to serve arrival
The descriptive analysis has already highlighted the airlines’tendency to depart from a limited number of airport, possibly as a consequence of the sunk and bu-reaucratic costs involved (Berry, 1992). The introduction of this variable aims at measuring whether operating ‡ights to a destination from many di¤erent origins in the same country reduces a …rm’s incentive to seek other origins (entry) or to exit existing ones.
Another route in the citypair already operated by the airline - Dummy Company operates at least another route in the citypair
a citypair have a greater propensity to enter that market. Similarly, we focus on whether a company that is already operating a route within a citypair (say, Lon-don Stansted to Rome Ciampino) is more willing to open a new route in the same market (say, London Luton to Rome Ciampino) or to exit one or more of the routes it is already operating in that market. To this purpose, a dummy is used to indi-cate whether an airline is serving at least two routes in a citypair. A priori, entry could be stimulated by the airline’s desire to strengthen its market position in or-der to discourage entry by other potential companies through capacity expansion (Dixit, 1980). Furthermore, entry may also be spurred by possible synergies among the routes in the citypair market, perhaps in terms of network or scope economies, product di¤erentiation or schedule convenience. So a positive relationship is ex-pected in the entry model. A clear-cut prediction cannot be made for the case of exit.14
Existence of an exit in the 12 months prior to entry respectively. - D – exit in route in last 12 mths
Always at the route level, we control whether entry is more likely to occur in a route where another …rm has exited in the 12 months prior to the entry. This would be consistent with a high degree of contestability characterising some of the routes under study (Borenstein, 1992).
Existence of an entry in the 12 months prior to exit - D –entry in route in last 12 mths.
As the above for the exit model.
Number of airlines in a route - Log No. Company in route.
It has often been the case that airlines, especially LCC, at an early stage of their operations, have sought entry in routes where no other airlines were present. However, the availability of such routes may have become scarcer as the liberalisation process gained momentum, forcing the entrant airlines to target routes where other carriers were already active. The e¤ect of this variable (which is a proxy for market concentration) is unclear, although standard economic arguments would suggest a negative coe¢ cient in the entry model, and a positive one in the exit equation.
Presence of seasonal operators - D_ At least one company operates route on seasonal basis.
14Cost and product synergies may fail to materialize, inducing a positive sign for the coe¢ cient
of this variable in the exit equation. On the other hand, the presence of high entry barriers and of cost/product synergies would be re‡ected in a negative sign for this variable in the exit model.
The most successful LCC in Europe, Ryan Air, and to a great extent its main equivalent competitor, EasyJet, tend not to open routes on a seasonal basis but commit themselves to run the service throughout the year: this is suggestive of a market-stealing strategy played by LCC trying to replace seasonal operators. Hence, it should also be expected that exits are more likely to take place when a seasonal operator is active in a route.
Her…ndahl index of total passengers over routes in the citypair - Her…ndhal of total passengers in routes within a citypair.
In order to di¤erentiate its service and thereby avoid intense price competition, an airline may target some arrival airports located in a market which was not pre-viously served from a given departure city.15 Relatedly, an airline may choose to occupy a niche in a citypair market where one of its routes attract a very high vol-ume of passengers.16 In both cases, the Her…ndahl index of total passengers over
the routes in a citypair would measure a high degree of concentration of tra¢ c, and would be positively associated with entry. Similarly, lack of viable product di¤er-entiation opportunities, indicated by high levels of this variable, may increase the likelihood of observing an exit.
Presence of charter operators - Share charter pass citypair / total pass in citypair Traditionally charter operators have been linked with the travel distribution sys-tem in the context of an integrated tourist package holiday industry. The increasing reliance on the Internet as the major distribution system for both traditional and low-cost carriers is therefore likely to have put charter operators at a cost disadvan-tage, given that they cannot rely any more on the very high load factors they could achieve in the past, as passengers now prefer to book on-line.17 Thus, we expect that
entry and exit are more likely in markets where the proportion of charter passengers over the total number of passengers is high.
Relative size of the market - Share of tot.passenger in cityp. / total pass in country area.
15In this case the route, say, e.g., Stansted to Alghero in North Sardinia, coincides with the
citypair as there are no other alternative routes available during the analysed period.
16An example in this case could be London-Barcelona citypair, where substitute arrivals are
Reus and Girona.
17Traditional carriers responded to the LCC’ ability in using the Internet as a distribution
channel in two ways. First, they expanded their own web sites where they o¤er promotional fares. Second, on-line travel agents were created which are owned by a pool of airlines and an international computer reservation agency, e.g., Amadeus. A notable example of the latter type of strategy is Opodo.
On the one hand, relatively larger markets should constitute richer targets for potential entrants.18 If entry is successful, it is also likely that old incumbents may be forced to exit. On the other hand, large markets have been dominated for long by established carriers, possibly former national ‘‡ag-carriers’, which may remain pro-tected by such barriers to entry as the "grandfather" rights which post-liberalisation allocated slots in the main European, most congested airports to airlines on the basis of previous use. In this case, entry would be very di¢ cult and exit unlikely.
Incumbents’service quality - Avg max lagged delay in 12 months over a citypair. Punctuality is used as a proxi for service quality (Mazzeo, 2003). It often con-stitutes a critical element in driving businesspeople’s willingness to use an airline. Low levels of quality, proxied by the presence in the market of long delays, may thus induce entry as the entrant perceives the presence of weak incumbents. This variable should then be positively associated with entry and exit activities.19
LCC pro…le - D_LCC
Finally, to capture some of the peculiarities characterising the strategies of the main LCC, a “low-cost” dummy variable was included for the six main LCC indi-cated in Table 1. It is expected that these are characterised by a higher entry and a lower exit rate. Also, this variable is included interacting with the other explanatory variables in order to capture the di¤erential e¤ect of the above factors on the main LCC.
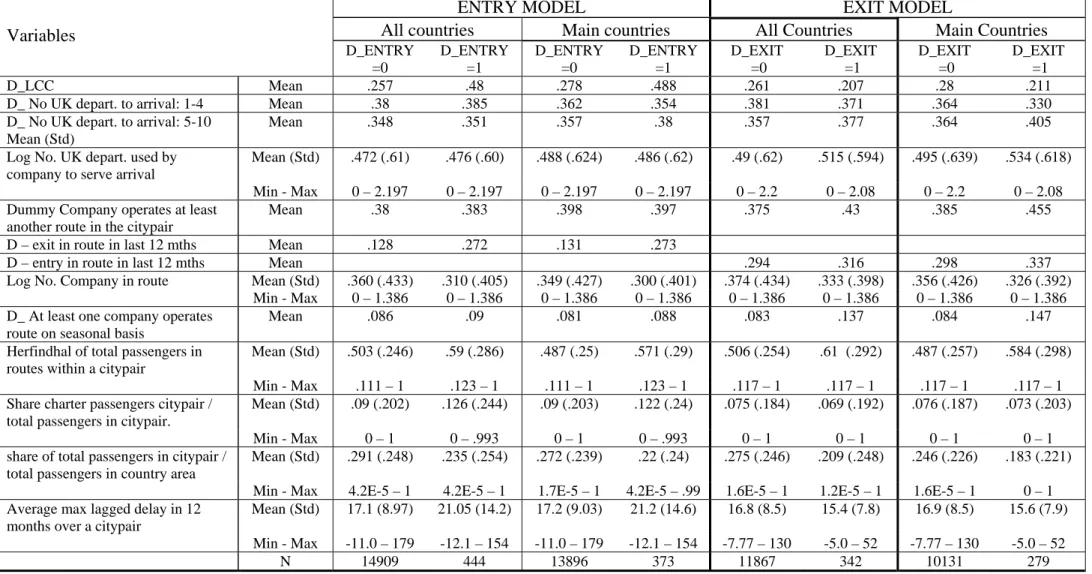
Tables 6 presents some descriptive statistics for the variables introduced above, broken down by the dummies for entry and exit, respectively. LCC are responsible for about 48% of the entries and 21% of the exits. While con…rming the …ndings in Table 1, this evidence also points out how the major LCC primarily targeted the main countries to secure a stable foothold in the British market. A greater share of charter passenger in the citypair seems to be positively correlated with entry activity, but more weakly so for the case of exits, while market size, proxied by the share of total passengers in the citypair over the total passengers in the country area, seems to be greater in routes with no entries or exits. Also, about 27% of entries occurred in routes where an exit had taken place in the previous twelve months, while only about 13% of routes with no entry exhibited an exit in the same period. Such a drastic di¤erence does not feature in the case of exits where an entry took
18Consider, for instance, Milan. This variable captures the fact that Milan attracts a very high
share of passengers ‡ying from, say, London, to the North of Italy.
place in the previous twelve months. As far as other notable features are concerned, routes with entry tend to exhibit a larger average delay in their citypair and to have a smaller number of …rms. The latter comment applies also to routes with exits, which also show a greater share of seasonal carriers.
5
Methodology
Airlines are assumed to rank the routes to enter and exit in order of pro…tability. More formally, the pro…ts obtainable by airline i from route j at time t can be represented as
ijt =V1(Aijt; Rjt) 1+V2(FG) 2+ejGt (1) whereAijt is a vector of time-varying attributes of airlineioperating in routej,Rjt is a vector of time-varying characteristics of routej and its related citypair,FG is a vector of characteristics of the geographical areasG de…ned by routej’s endpoints, V1 and V2 are vector values functions, 1 and 2 are correspondingly dimensioned parameter vectors, andejGt is a disturbance term. For an airline ichoosing to enter (exit) routej at time t over all the possible route choicescin the geographical area G, the (opposite to the) following condition must hold:
V1(Aijt; Rjt) 1+V2(FG) 2+ejGt 0 V1(Aict; Rct) 1+V2(FG) 2+ecGt for all c2Gt (2) or
[V1(Aijt; Rjt) V1(Aict; Rct)] 1 ecGt ejGt for all c2Gt (3) If theejGtare distributed according the type I extreme value cdf, then the random utility model in (3) is known as the conditional or …xed e¤ect logit model (Haab and McConnell, 2002; Wooldridge, 2002).20
Area-speci…c attributes that do not vary by alternatives within the choice set can-not be included in the estimation, unless they are interacted with airline attributes, since they cancell out in (2). These …xed e¤ects depend on the way the geographic areas (Gt)are determined. To this purpose, we divide both the departure countries (i.e., England, Wales, Scotland and Northern Ireland) and the arrival countries
(in-20This is the same approach used by Hannan (1983) to study entry in the U.S. banking industry
cluding the UK ones for the case of domestic ‡ights) in sub-areas (mostly North, Centre and South) and group all the observations from routes in each combination of geographic subareas. Thus, for instance, routes (and citypairs) from the North and the South of England to the South and the North of France would fall into four di¤erent groups. Therefore, each group includes routes that in each point in time: 1) may be operated by di¤erent airlines; 2) are homogeneous in terms of pop-ulation at endpoints, distance and other area-speci…c characteristics, which do not have to be speci…ed among the regressors, unlike the cross-sectional Probit studies, where route …xed-e¤ects are often included (Berry, 1992; Boguslaski et al. 2004; de Oliveira, 2004; Morrison and Winston, 1990).21
Furthermore, the time e¤ects are considered by tracking the routes connecting two sub-areas for a time span of six months, namely the …rst and the second half of each year. Observations from geographic areas where no entry (no exit) occured in the six months’period are automatically dropped during the estimation process. More than one instance of entry or exit may take place for the same period in a given geographic area. To enable a more precise study of the di¤erences in the entry and exit patters of the main LCC and TC, the estimation strategy considers only the entries and exits by the "Main Airlines", but not those of the "Other airlines" in Table 1 that are smaller and tend to operate in geographically limited markets.22
6
Results
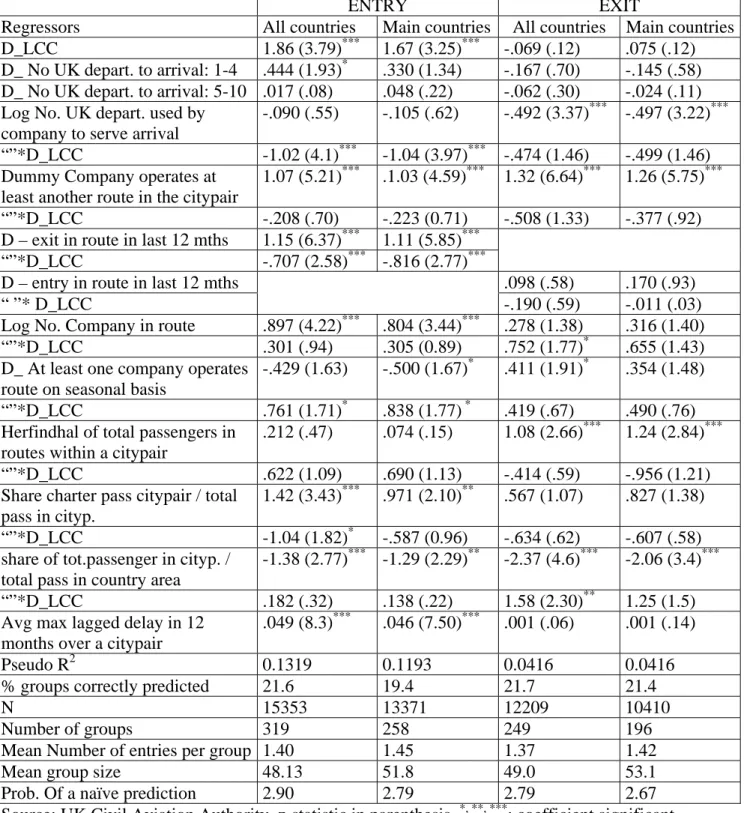
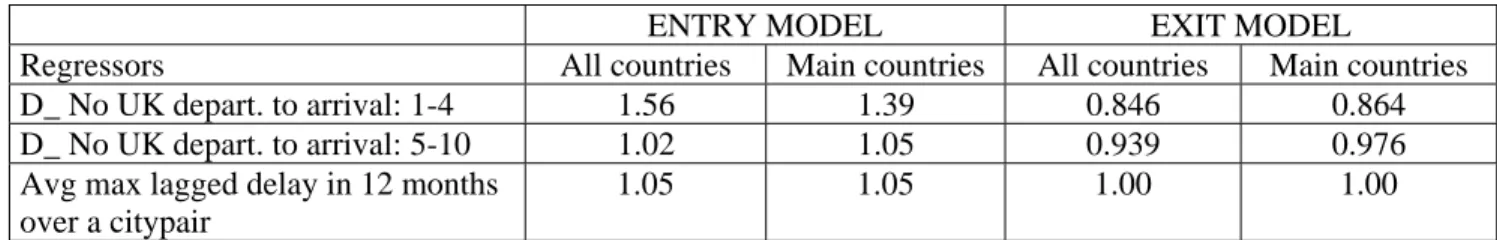
Tables 7 reports the estimation results for the entry and exit models, obtained from our two di¤erent samples,“All Countries”and “Main Countries”. Pseudo R2 values range from 0.1319 to 0.1193 in the entry models and are 0.0416 in the exit model. Tables 8 and 9 report the odds ratios for the non-interacted and interacted variables in our model.23
21This is related to the di¤erence in the focus between the two approaches. Our focus is on
the di¤erences in the combination of route/airline characteristics that make an entry or exit arise in one route and not in another route in a given geographic area. The focus of the traditional cross-sectional probits of entry is on estimating the probability of entering a route independently of the choices with respect to the other routes. Our drawback is the arbitrary construction of the groups. In our opinion, the geographic divisions are appropriate since they include routes which are close substitutes among them from the point of view of the airline.
22However, their presence in a route is included in our estimation for comparison purposes. 23Please refer to the appendix for details on how odds ratios were calculated for the interacted
It is important to note that the main LCC were more active in entering relative to the other main, established carriers, but not in exiting. To further investigate the di¤erent behaviour of the LCC, the dummy “D_LCC”was interacted with the majority of the regressors.24 Interestingly, the interpretation of the odds ratio of the
low cost dummy (computed at the mean of the interacted variables) as a risk ratio yields an interesting result: On average, an entry is four to …ve times more likely to have been undertaken by a LCC than by an established carrier.
The probability of entry in a given route appears to be signi…cantly increased in the "All Countries" sample when the number of departure airports serving an arrival is between one and four, and falls losing signi…cance when the number is between …ve and ten. If we interprete our odds ratios as risk ratios, this would mean that for the all countries sample (main countries sample) entry is 56% (39%) more likely to be observed when the number of departure airports serving an arrival is between one and four than when it is higher than 10. The number of departure airports serving an arrival does not seem to impact the likelihood of an exit. Quite relatedly, the number of departure airports used by an airline to serve a destination is signi…cantly and negatively associated with entry for LCC and exit for TC. Furthermore, as far as the strategic implications of the network structure are concerned, the …ndings suggest how entry and exit occur more often in markets where the airlines already operates at least another route. This e¤ect is in fact stronger for non-low cost than for low cost airlines, yielding higher odds ratios for the former than for the latter (2.92 vs. 2.37 in the all countries sample and 2.81 vs. 2.25 for the main countries sample). All this suggests an attempt by airlines, especially non-low cost, to rationalize their networks by entering routes in markets where they have a foothold so as to strengthen their competitive position, and exiting others while still retaining a presence in the market. The fact that this variable’s coe¢ cients are positive in the exit model indicates low barriers to entry at the market (citypair) level. Again, the odds ratios for this variable are much larger for non-low cost than for low cost airlines. Again, if we interprete the odds ratios as risk ratios, this would mean that a non-low cost (a low cost) airline is more than three (two) times more likely to exit a route when it is already present in another route in the citypair than when it is not.
24Initially, all the regressors were interacted. However, in a few cases, the interaction term turned
out to be very small and highly insigni…cant. In these cases, to save on space and reduce possible collinearity, the interaction term was dropped: the results, which are available on request, were not a¤ected.
A similar indication of contestability is supported by the fact that in the two samples, entry in a route is highly and signi…cantly correlated with exits in the same route in the twelve months’ prior to entry, although less strongly so for the main LCC (in fact the values of the odds ratios for non low cost doubles those of the non low cost). Low barriers to entry and exit are a condition for market contestability, and such …ndings suggest a similar interpretation. They also shed some light on a typical LCC’s strategy: that of entering routes previously closed to tra¢ c, and for which no previous exit was recorded. The presence of other airlines in the route does not seem to deter entry and could explain LCC’s exit from routes not in the main countries.
However, strong evidence indicates how markets enjoying a large share of pas-sengers in a country area exhibit a low entry and exit activity.25 This is consistent
with the presence of entry barriers in important markets, such as those connecting the U.K. with the countries’capitals or business areas (e.g., Milan, Barcelona etc), where traditional carriers still occupy a dominant position. The “Main Airlines” exhibited a greater propensity to exit from citypairs where tra¢ c is concentrated in one or two routes, suggesting a positive relationship between lack of product di¤erentiation opportunities and the probability to abandon a route.
Both the hypotheses that routes with seasonal and charter operators are targets for entry …nd some support in the data. More precisely, relative to the traditional airlines, LCC have often chosen to enter routes with at least one seasonal operator, but not so much in markets characterized by the presence of charter ‡ights, which has been, however, an important driver for entry by TC. Exit appears to be highly uncorrelated with the presence of charter ‡ights, and only weakly associated to seasonal routes. Long delays at the citypair level appear to attract new entrants but are not associated with exits.
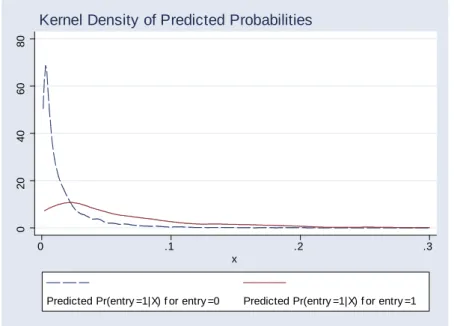
In the bottom part of Table 7 we provide details on the explanatory power of our models. The predicted outcome (route expected to be entered or exited) is the one with the highest predicted probability in each choice set (Greene, 2002). As a matter of fact, our prediction coincides with the actual entered (exited) route in the 21.6 (21.7)% of the cases for the "All Countries" sample and in the 19.4 (21.4)% of the cases for the "Main countries". This implies a signi…cant increase in the prediction accuracy with respect to the naive prediction, obtained as the mean
25Results do not change if the share is worked out considering the total number of passengers to
number of entries per group over the mean group size, which would be correct only in the 2.9% and 2.8% of the entry cases, and in the 2.8% and 2.7% of the exit ones. To further test the predictive power of the model, in Figure 1 we show the density distribution of the predicted probabilities in the cases of actual entries and actual "not entries". The same applies for the case of exits in Figure 2. It can be seen from Figure 1 that this distribution tends to be accumulated around values closer to zero for actual "not entry" than for actual entries thereby indicating how our model assigns higher estimated probabilities of entry to actually entered routes than to those not entered. Similar comments can be made on Figure 2 for the case of exit.26
7
Conclusion
To our knowledge, this is the …rst paper to study the post-liberalisation entry and exit activity by the main traditional and low cost carriers operating from the 10 main main British airports. Using a conditional logit model, the study identi…ed a number of airline, route and citypair characteristics that make a route the most likely to be entered or exited in a given geographic area. These included some explanatory variables that have not been studied so far, such as the presence of seasonal or charter operators in the pre-entry (pre-exit) period and the level of quality provided by the incumbents. These factors proved to be signi…cant and positively correlated with entry and/or exit. Another contribution regards the di¤erential impacts of the model’s variables in driving the entry and exit behaviour of the main low cost carriers.
From a policy viewpoint, the results from this study can be used to draw some conclusions regarding how the British airlines market has changed after the liber-alisation measures were fully implemented. This is particularly important because such a market was the …rst to experience the low cost revolution, that is, where Ryan Air and Easyjet, the two most successful low cost carriers in Europe, among others initially created their hubs. Only in more recent years such companies have expanded by creating a truly pan-European network with hubs outside the UK. The descriptive analysis revealed how the low cost carriers, relative to the traditional carriers, were responsible for a greater share of entries and a lower share of exits:
26The low predicted probabilities of entry and exit reported in the horizontal axis are the result
of the numerosity of observations in a choice set, given that the sum of the predictive probabilities for each observation in a group has to equal one.
this was particularly true for the 8 main countries that account for about 85% of all the ‡ights from the 10 main airports to the 18 main European countries. However, a considerable increase in routes from the regional airports was also observed, sup-porting the widespread notion that the liberalisation process has helped revitalise minor airports. This also indicates more variety available to the passengers, and an attitude by airlines to exploit product di¤erentiation as a way to prevent head-on competition.
The econometric analysis has highlighted other policy implications. First, the limited entry and exit activity in important, large markets, which suggests the pres-ence of barriers to e¤ective competition. This is in line with the observation by Bachis and Piga (2006) of higher price increases in larger markets in the period 2002-2005 and raises concerns as to their degree of contestability and the presence of barriers to entry which the liberalisation process has not eroded.Second, the tradi-tional carriers strategy to ratradi-tionalise their network structure by maintaining routes whose arrival is served from many di¤erent departures and abandoning routes in markets where they already o¤er a substitute route. Relatedly, traditional carriers also seem likely to enter a market following an exit by another company. Unfor-tunately we do not have information regarding whether the entrant is part of the same strategic alliance of the exiter, an hypothesis that deserves further research in the future. Finally, the presence of at least an incumbent does not seem to lead to a reduced entry activity: while this potentially seems a positive outcome, establish-ing whether reductions in European markets concentration are responsible for lower prices as in Evans and Kessides (1994) for the U.S. routes, is also a matter for future research.
References
[1] Bachis, E. and C. Piga, 2006, What Drives Yearly Changes in Airlines’Prices? An Investigation Using Online Fares, Discussion Paper Series, N 2006_08, Dpt Economics, Loughborough University.
[2] Bailey, E. E. and J. C. Panzar, 1981, The Contestability of Airlines Markets during the Transition to Deregulation,Law and Contemporary Problems, 44(1), pp. 125-145.
[3] Berry, S.T., 1992, Estimation of a Model of Entry in the airline Industry, Econo-metrica, 60(4), pp. 889-917.
[4] Boguslaski, C., Ito, H. and D. Lee, 2004, Entry Patterns in the Southwest Airlines Route System, Review of Industrial Organization, 25, pp. 317-350. [5] Borenstein, S., 1989, Hubs and High Fares: Airport Dominance and Market
Power in the U.S. Airline Industry, Rand Journal of Economics, 20, pp.344-365.
[6] Borenstein, S., 1992, The Evolution of U.S. Airline Competition, Journal of Economic Perspective, 6, pp.45-73.
[7] Brueckner, J.K., 2001, The economics of international code sharing: an analysis of airline alliances, International Journal of Industrial Organization, 19, 1475-1498.
[8] Buestorf, G. and S. Klepper, 2004, The Origin and Location of Entrants in the Evolution of the U.S. Tire Industry, Working Paper, Max Planck Institute Jena.
[9] de Oliveira, A.V., 2004, Estimation of a model of Low Cost Carrier Entry,
mimeo.
[10] Dixit, A., 1980, The Role of Investment in Entry Deterrence,Economic Journal, 90, pp.95-106.
[11] Evans, W. and Kessides, I., 1994, Living by the "Golden Rule": Multimarket Contact in the U.S. Airline Market, Quarterly Journal of Economics,109, 341-366.
[12] European Commission, 2004,EC Regulation No 549/2004-550/2004-551/2004-552/2004.
[13] Giaume, S. and S. Guillou, 2004, Price Discrimination and Concentration in Eu-ropean Airline Markets, Journal of Air Transport Management, 10(5), pp.305-310.
[14] Goldsbee, A. and C. Syverson, 2005, How do incumbents respond to the threat of entry? Evidence from Major Airlines, NBER Working Paper, n. 11072, January.
[15] Greene, W.H., 2002,NLogit Version3.0 Reference Guide, Econometric Software, Inc., New York.
[16] Haab, T.C. and K. E. McConnell, 2002, Valuing Environmental and Natural Resources, Edward Elgar, Cheltenham, UK.
[17] Hannan, T., 1983, Prices, Capacity and the Entry Decision: A Conditional Logit Analysis,Southern Economic Journal, 50, pp. 539-550.
[18] Hurdle, G.J., Johnson R. L., Joskow, A. S., Werden, G. J. and M. A. Williams, 1989, Concentration, Potential Entry and Performance in the Airline Industry,
The Journal of Industrial Economics, 38, pp. 119-139.
[19] Ito, H. and D. Lee, 2004, Incumbent responses to lower cost entry: Evidence from the US Airline Industry, mimeo
[20] Joskow, A.S., Werden, G.J. and R.L. Johnson, 1994, Entry, Exit and Perfor-mance in Airline Markets,International Journal of Industrial Organization, 12, 457-471.
[21] Lederman, M. and S. Januszewski, 2003, Entry Patterns of Low-Cost Airlines,
mimeo.
[22] Mazzeo, M. J., 2003, Competition and Service Quality in the US Airline Indus-try, Review of Industrial Organization, 22, pp. 275-296.
[23] Morrison, S. A. and C. Winston, 1990, The Dynamics of Airline Pricing and Competition, American Economic Review, 80, , pp.389-393.
[24] Motta, M., 2004,Competition Policy. Theory and Practice, Cambridge Univer-sity Press, Cambridge, UK.
[25] Norton, E.C., Wuan, H. and C. Ai, 2004, Computing Interaction E¤ects and Standard Errors in Logit and Probit Models,The Stata Journal, 4, pp. 154-167. [26] Pels, E. and P. Rietveld, Airline Pricing behaviour in the London-Paris market,
Journal of Air Transport Management, 10, pp.279-283.
[27] Piga, C. A and N. Filippi., (2002), Booking and Flying with Low-Cost Airlines,
International Journal of Tourism Research, 4, pp. 237-249.
[28] Salop, S., 1979, Monopolistic Competition with Outside Goods. Bell Journal of Economics, 10, pp.141-156.
[29] Schipper, Y., Rietveld, P. and P. Nijkamp, European Airline Reform: An Em-pirical Welfare Analysis, Journal of Transport Economics and Policy, 36, Part 2, pp. 189-209.
[30] Stavins, J., 2001, Price Discrimination in the Airline Market: The E¤ect of Market Concentration, The Review of Economics and Statistics, 83, pp. 200-202.
[31] Wooldridge, J. M., 2002, Econometric Analysis of Cross Section and Panel Data, MIT Press, Cambridge, MA.
8
Appendix
It is widely known that in a logit model, the odds ratios of a non-interacted variable k are the exponential of the estimated coe¢ cient k. As shown by Norton (2004), this is not true for the case of interacted variables. In fact, the odds ratios for interacted variables are usually miscalculated by standard econometric packages. In this appendix we show how we calculated the odds ratios according to our model
In our model, the dummy variableD_LCC which identi…es LCC, is interacted with m of the other n explanatory variables m < n (total number of explanatory variables = n+ 1). The estimated probabilities of entry (P1) and not entry (P0) for observationi can be written as27:
P1 = Exp[ 0D_LCC+Pmk=1 kXkD_LCC+ Pn k=1 kXk] 1 +Exp[ 0D_LCC +Pmk=1 kXkD_LCC] +Pnk=1 kXk] P0 = 1 1 +Exp[ 0D_LCC+Pmk=1 kXkD_LCC +Pnk=1 kXk]
where and correspond to estimated coe¢ cientes of the non-interacted and inter-acted terms respectively. The odds of observation ican hence be written as:
P1 P0 =Exp " 0D_LCC+ m X k=1 kXkD_LCC + n X k=1 kXk #
Recall that the odds ratio (OR) for a variable Xk is the ratio of odds of two observations that di¤er only in the value of the explanatory variable Xk. For the sake of simplicity, let us consider that Xk is a dummy variable, which takes values 1 and 0.28 Obtaining its odds ratio would imply calculating the following:
ORk = P1
P0 jXk=1
P1
P0 jXk=0
As commented before, if the P1s are close to zero, (as in our case, where the average probability of observing an entry (or an exit) in a given route is less than 3%), then the odds ratio is a good approximation to the much more easily interpretable
27For notational simplicity, in this section we drop out the subscripts corresponding to the
observation. We also refer only to the event of entry. We also apply this analysis to the exit estimations.
28The resulting expressions for the odds ratios in the case of non-dummy variables would be the
risk ratio, RRk:
RRk=
P1 jXk=1
P1 jXk=0
IfXkis one of the variables which is interacted with the LCC dummy, (k (m; n]), its odds ratio can be writt en as:
ORk = Exp[ 0D_LCC+ kD_LCC+ Pm k=2 kXkD_LCC + k+ Pn k=2 kXk] Exp[ 0D_LCC +Pmk=2 kXkD_LCC +Pnk=2 kXk] which yields: ORk =Exp[ k+ kD_LCC]
It is thus implicit that the odds ratios of a variable k will di¤er for low cost and for non low-cost airlines. Table 9 report respectively the odds ratios of the interacted variables for non LCC (D_LCC = 0 and hence, ORk = Exp[ k]) and for LCC (D_LCC = 1 and hence, ORk =Exp[ k+ k]).
It is straightforward to show that if Xk is a non-interacted variable, its odds ratio will be:
ORk =Exp[ k]
Table 8 reports the odds ratios for non-interacted variables.
Finally, the odds ratio of the dummy variable D_LCC can be written as: ORk= Exp[ 0 +Pmk=1 kXk+Pnk=1 kXk] Exp[Pnk=1 kXk] which yields: ORD_LCC =Exp " 0+ m X k=1 kXk #
The interpretation of the odds ratio for the dummy variableD_LCC is somehow trickier, as it also comprises them interacted variables. We evaluate this odds ratio at the mean of these variables and interpret it as an "average" e¤ect. The odds ratios for D_LCC are also reported in Table 9.
Figure 1: Predicted probabilities of entry (All Countries Sample) 0 20 40 60 80 0 .1 .2 .3 x
Predicted Pr(entry =1|X) f or entry =0 Predicted Pr(entry =1|X) f or entry =1
Kernel Density of Predicted Probabilities
Figure 2: Predicted probabilities of exit (All Countries Sample)
0 20 40 60 0 .05 .1 .15 .2 x
Predicted Pr(exit=1|X) f or exit=0 Predicted Pr(exit=1|X) f or exit=1
Table 1: Number of entries, exits, routes, flights and mean number of companies in operated routes by airline.
Entries Exits Routes Flights
Mean number of companies s Airlines 97-99 00-01 02-04 97-99 00-01 02-04 99 01 03 99 01 03 99 01 03 Ryanair 16 16 27 0 2 10 25 41 78 20183 32342 53486 1.26 1.15 1.13 Easyjet 11 6 36 0 1 6 17 23 72 12793 20684 59330 1.19 1.31 1.44 Gofly 16 13 2 0 4 8 18 31 9334 16627 1.32 1.32 MyTravelLite 0 0 12 0 0 3 13 4017 1.32 Flybe 8 9 11 0 6 12 26 34 32 17195 26491 24462 1.47 1.53 1.52 KLM UK 8 14 8 7 5 7 27 27 25 27577 23169 2517 1.29 1.34 1.12
Subtotal low cost 59 58 96 7 18 46 113 156 220 87082 119313 143812 1.31 1.33 1.31
Aer Lingus 1 1 0 3 2 3 12 12 9 17367 17107 14179 1.54 1.81 1.78 Air Europa 1 0 0 1 0 0 2 2 2 298 573 845 3.21 2.50 3.50 Air France 3 1 1 4 2 2 5 6 3 8649 8132 6660 1.84 2.19 2.52 Alitalia 6 0 0 7 2 2 10 6 5 7585 6488 4988 1.59 2.28 2.28 BMI 9 7 15 4 9 17 40 40 42 41367 43262 43412 1.89 1.94 1.75 British Airways 29 18 46 22 25 75 163 165 157 150122 154738 148662 1.55 1.53 1.63 Finnair 1 0 0 3 1 0 4 3 2 2169 2436 1879 1.34 1.34 1.50 Iberia 3 0 0 6 1 1 14 9 9 5823 6078 5829 1.50 1.77 1.63 KLM 1 0 5 0 0 2 5 5 11 6508 6679 15771 1.77 1.55 1.71 Lufthansa 5 2 0 6 7 3 20 21 17 16699 19174 18749 1.78 1.76 1.96 Maersk Air 6 2 4 0 6 17 17 16 19 11052 10168 8769 1.09 1.16 1.24 SAS 2 2 0 4 3 0 13 11 8 10604 10924 9162 1.59 1.74 1.76 Swiss 6 2 0 1 1 4 12 12 11 6985 7471 10839 1.20 1.08 1.32 Olympic Airways 0 2 0 0 1 0 1 4 3 966 1385 1283 4.00 2.11 1.53 Virgin 3 1 0 0 6 0 5 4 1458 693 2.40 2.92 Air Portugal 0 1 2 0 0 1 4 5 7 2150 2559 2980 1.50 1.60 1.41 CSA 3 4 5 1258 1597 2381 1.78 1.52 1.47 Eurowings 4 3 5 3 3 2 2 5 6 1175 1634 2340 1.00 1.13 1.69 Monarch 0 2 7 1 0 0 5 6 14 884 1594 3677 1.13 1.50 1.77 GB Airways ltd 9 5 7 1 2 2 13 15 21 3971 4485 6604 1.29 1.76 1.53 Austrian Air 0 0 1 0 0 0 1 1 2 1313 1360 1737 2.00 2.00 2.00 Lauda-Air 0 0 0 1 1 1 2 1 771 561 1.50 1.00 Other airlines 81 64 105 72 56 90 132 147 131 74503 73020 58699 1.47 1.36 1.38 Total 229 171 294 146 146 268 598 656 704 460759 501431 513257 1.51 1.50 1.51
Table 2: Number of entries, exits, route, flights, operating airline sand ratio of charter passengers over schedule passengers by country
Entries Exits Routes Flights Airlines
Charter/Schedule passengers Contries 97/99 00/01 02/04 97/99 00/01 02/04 99 01 03 99 01 03 99 01 03 99 01 03 France 27 23 36 19 13 30 73 82 97 43376 47491 50831 19 17 16 0.050 0.045 0.042 Germany 36 17 33 21 28 31 74 70 75 53771 59119 60235 17 14 17 0.005 0.004 0.002 Irish Republic 14 11 20 11 11 15 52 50 56 40674 42585 39104 12 11 11 0.002 0.001 0.002 Italy 33 13 25 20 13 14 75 71 91 28565 32454 34844 10 8 10 0.163 0.128 0.100 Netherlands 9 6 12 6 6 14 37 38 31 36445 38762 33738 12 11 12 0.001 0.001 0.001 Spain 30 39 64 21 11 38 229 242 258 20461 30439 41701 11 11 15 3.993 2.349 1.362 Switzerland 16 4 4 9 4 10 31 26 32 22654 21353 22538 7 8 5 0.060 0.066 0.068 United Kingdom 6 22 60 2 24 80 128 367 377 140784 154372 160553 16 17 17 - 0.008 0.004 Main Countries 171 135 254 109 110 232 699 946 1017 386730 426575 443544 104 97 103 0.462 0.406 0.310 Austria 3 2 7 1 5 2 19 16 19 4585 5010 5326 5 6 5 0.267 0.269 0.281 Belgium 7 10 3 5 8 12 19 20 20 22964 19880 15624 7 10 8 0.001 0.001 0.002 Croatia 8 2 2 1 0 3 10 10 11 880 924 888 2 2 2 0.081 0.070 0.150 Czech Republic 0 0 3 0 0 0 3 4 6 2547 3429 4670 4 3 3 - - - Denmark 7 2 3 8 2 2 15 18 15 11409 13026 12734 8 8 8 0.020 0.006 0.003 Finland 0 2 2 4 2 2 7 8 10 3023 3844 2960 2 4 4 0.042 0.060 0.132 Greece 3 2 4 2 3 2 29 31 36 3631 4013 3802 5 5 5 1.274 1.422 1.336 Norway 10 3 3 9 7 2 23 15 12 9016 7014 6157 8 5 5 0.032 0.006 0.001 Portugal 10 7 9 2 4 6 35 36 37 6488 7075 8005 6 6 8 1.354 1.173 0.907 Sweden 10 6 4 5 5 5 15 16 12 9486 10641 9547 6 5 5 0.047 0.017 0.000 Total 229 171 294 146 146 268 874 1120 1195 460759 501431 513257 157 151 156 0.241 0.195 0.144
.
Table 3: Number of entries, exits, routes, ratio of charter passengers vs schedule passengers and number of flights in UK airports.
Entries Exits Flights
Charter/Schedule passengers Routes Airports 97/99 00/01 02/04 97/99 00/01 02/04 1999 2001 2003 99 01 03 99 01 03 Birmingham(BHX) 15 17 32 6 11 40 39879 46107 47129 0.743 0.576 0.365 65 73 73 Edinburgh(EDI) 9 10 30 1 5 27 29394 36655 40104 0.257 0.145 0.071 45 50 57 London-Gatwick(LGW) 46 29 56 42 30 49 65113 65150 67413 0.870 0.711 0.504 110 107 98 Glasgow(GLA) 10 15 33 8 8 36 28176 32503 29797 2.438 0.718 0.562 63 63 68 London -Heathrow (LHR) 22 10 7 28 19 17 144350 144174 140543 0.002 0.002 0.002 74 69 71 London-Luton(LTN) 16 3 9 18 3 2 17551 19782 21388 0.377 0.239 0.135 50 56 54 Manchester(MAN) 19 15 40 9 9 39 50622 55205 59461 1.716 1.187 0.910 87 84 96 Newcastle(NCL) 6 16 22 7 19 16 14565 15931 13595 1.869 1.040 0.781 37 39 40 London Stansted(STN) 57 44 51 17 33 26 51691 60459 70902 0.162 0.079 0.050 83 109 129 London City(LCY) 29 12 14 10 9 16 19418 25465 22925 0.001 0.001 0.000 26 36 31 Main Airports 229 171 294 146 146 268 460759 501431 513257 0.373 0.285 0.207 640 686 717 Aberdeen 0.242 0.117 0.108 11 35 37 Belfast International 4.024 0.653 0.391 21 32 34 Bournemouth 1.686 1.515 0.547 9 16 20 Bristol 1.659 0.785 0.536 23 46 45 Cardiff 3.349 1.949 1.049 18 30 39 East Midlands 2.439 2.313 0.577 21 25 40 Leeds-Bradford 0.944 1.246 0.605 16 23 25 Liverpool 0.265 0.122 0.167 16 19 25 Glasgow-Prestwick 0.130 0.214 0.093 5 11 22 Teesside 1.453 2.342 1.505 14 16 15 Norwich 0.953 1.229 1.106 9 12 10 Blackpool 1.875 5.301 0.544 4 6 8 City Of Derry -- 0.000 0.013 1 2 Belfast-City Airport 0.000 0.001 0.000 3 21 19 Humberside 1.456 1.486 1.972 10 14 12 Sheffield City 0.002 0.005 -- 2 3 Southampton 0.131 0.197 0.161 7 10 20 Others 0.862 0.217 0.193 45 114 105 Total 0.433 0.327 0.237 874 1120 1195
Table 4: Number of routes operated from/to main airports by airline.
1998 2003
Airlines BHX EDI LGW GLA LHR LTN MAN NCL STA LCY BHX EDI LGW GLA LHR LTN MAN NCL STA LCY
Ryanair 1 1 1 1 13 3 1 1 2 1 1 69 EasyJet 1 0 12 7 16 6 15 9 19 GoFly 0 8 MyTravelLite 13 FlyBE 8 3 4 2 2 2 13 3 3 3 2 1 4 3 KLM UK 1 4 3 1 2 2 13 3 1 1 22 1 Low Cost 10 5 4 7 3 15 3 2 36 3 29 11 20 10 2 18 2 14 110 4 Aer Lingus 3 1 1 3 2 1 1 1 1 1 1 3 1 1 Air Europa 2 2 Air France 1 2 1 2 1 1 1 Alitalia 5 3 1 2 2 3 BMI 3 8 6 17 6 9 6 17 10 British Airways 11 18 36 21 41 3 28 4 2 15 16 34 19 32 1 32 4 4 Finnair 3 3 1 1 1 1 Iberia 3 9 2 1 7 1 KLM 3 2 1 1 1 3 1 1 2 1 Lufthansa 3 10 5 1 1 3 1 6 6 1 Maersk Air 8 3 1 17 2 SAS 1 7 3 2 1 5 2 Swiss 2 1 2 2 4 2 4 2 3 Olympic Airways 1 1 1 1 Virgin 1 1 1 Air Portugal 4 3 4 CSA 1 1 1 1 1 1 1 1 Eurowings 1 3 2 1 1 1 1 Monarch 5 3 5 6 GB Airways Ltd 9 2 20 1 Austrian Air 1 1 1 Lauda-Air 2 1 Other Airlines 4 6 39 12 10 10 15 13 7 10 4 16 31 12 6 3 20 7 15 17 Total 44 41 108 47 123 33 70 21 58 22 76 57 121 49 98 27 87 28 129 32
Table 5- The variables and their expected signs.
Variables Description Entry Exit
D_LCC Dummy = 1 for LCC + +
D_ No UK depart. to arrival D_ No UK depart. to arrival: 1-4 = 1, if number of departures used to serve arrival is between 1 and 4 (incl.);
D_ No UK depart. to arrival: 5-10 = 1 if number of departures used to serve arrival is between 5 and 10 (incl.)
Reference category >10
- +
Log No. UK depart. used by company to serve arrival
Natural log of the number of UK departures used by the airline to serve the arrival
- +
Dummy Company operates at least another route in the citypair
Dummy = 1 if the airline operates another route in the citypair
+ -
D – exit in route in last 12 mths Dummy = 1 if there was and exit in the 12 months prior to the event of entry
+
D – entry in route in last 12 mths Dummy = 1 if there was and entry in the 12 months prior to the event of exit
+ Log No. Company in route Natural log of the number of incumbents in
the route
+ -
D_ At least one company operates route on seasonal basis
Dummy = 1 if there is at least one company operating the route seasonally,
+/- +
Herfindhal of total passengers in routes within a citypair
Herfindahl index of the total passengers in the routes in the citypair
+ -
Share charter pass citypair / total pass in cityp.
Number of charter passengers in the citypair over the total number of passengers in the citypair
+ +
share of tot.passenger in cityp. / total pass in country area
Number of charter passengers in the citypair over the total number of
passengers in the country area (geographic divisions of the origin and destination countries).
+/- +/-
Avg max lagged delay in 12 months over a citypair
Average of the 12 month maximum lagged in the city-pair
Table 6 - Descriptive Statistics of the variables from the estimation samples of the ENTRY and EXIT.
ENTRY MODEL EXIT MODEL
All countries Main countries All Countries Main Countries Variables D_ENTRY =0 D_ENTRY =1 D_ENTRY =0 D_ENTRY =1 D_EXIT =0 D_EXIT =1 D_EXIT =0 D_EXIT =1 D_LCC Mean .257 .48 .278 .488 .261 .207 .28 .211
D_ No UK depart. to arrival: 1-4 Mean .38 .385 .362 .354 .381 .371 .364 .330
D_ No UK depart. to arrival: 5-10 Mean (Std)
Mean .348 .351 .357 .38 .357 .377 .364 .405 Log No. UK depart. used by
company to serve arrival
Mean (Std) .472 (.61) .476 (.60) .488 (.624) .486 (.62) .49 (.62) .515 (.594) .495 (.639) .534 (.618)
Min - Max 0 – 2.197 0 – 2.197 0 – 2.197 0 – 2.197 0 – 2.2 0 – 2.08 0 – 2.2 0 – 2.08
Dummy Company operates at least another route in the citypair
Mean .38 .383 .398 .397 .375 .43 .385 .455
D – exit in route in last 12 mths Mean .128 .272 .131 .273
D – entry in route in last 12 mths Mean .294 .316 .298 .337
Log No. Company in route Mean (Std) .360 (.433) .310 (.405) .349 (.427) .300 (.401) .374 (.434) .333 (.398) .356 (.426) .326 (.392)
Min - Max 0 – 1.386 0 – 1.386 0 – 1.386 0 – 1.386 0 – 1.386 0 – 1.386 0 – 1.386 0 – 1.386
D_ At least one company operates route on seasonal basis
Mean .086 .09 .081 .088 .083 .137 .084 .147 Herfindhal of total passengers in
routes within a citypair
Mean (Std) .503 (.246) .59 (.286) .487 (.25) .571 (.29) .506 (.254) .61 (.292) .487 (.257) .584 (.298)
Min - Max .111 – 1 .123 – 1 .111 – 1 .123 – 1 .117 – 1 .117 – 1 .117 – 1 .117 – 1
Share charter passengers citypair / total passengers in citypair.
Mean (Std) .09 (.202) .126 (.244) .09 (.203) .122 (.24) .075 (.184) .069 (.192) .076 (.187) .073 (.203)
Min - Max 0 – 1 0 – .993 0 – 1 0 – .993 0 – 1 0 – 1 0 – 1 0 – 1
share of total passengers in citypair / total passengers in country area
Mean (Std) .291 (.248) .235 (.254) .272 (.239) .22 (.24) .275 (.246) .209 (.248) .246 (.226) .183 (.221)
Min - Max 4.2E-5 – 1 4.2E-5 – 1 1.7E-5 – 1 4.2E-5 – .99 1.6E-5 – 1 1.2E-5 – 1 1.6E-5 – 1 0 – 1
Average max lagged delay in 12 months over a citypair
Mean (Std) 17.1 (8.97) 21.05 (14.2) 17.2 (9.03) 21.2 (14.6) 16.8 (8.5) 15.4 (7.8) 16.9 (8.5) 15.6 (7.9) Min - Max -11.0 – 179 -12.1 – 154 -11.0 – 179 -12.1 – 154 -7.77 – 130 -5.0 – 52 -7.77 – 130 -5.0 – 52
N 14909 444 13896 373 11867 342 10131 279 Source: UK Civil Aviation Authority. D_ stands for Dummy.
Table 7 - Conditional Logit estimations for Entry on European routes from UK.
ENTRY EXIT
Regressors All countries Main countries All countries Main countries D_LCC 1.86 (3.79)*** 1.67 (3.25)*** -.069 (.12) .075 (.12) D_ No UK depart. to arrival: 1-4 .444 (1.93)* .330 (1.34) -.167 (.70) -.145 (.58) D_ No UK depart. to arrival: 5-10 .017 (.08) .048 (.22) -.062 (.30) -.024 (.11) Log No. UK depart. used by
company to serve arrival
-.090 (.55) -.105 (.62) -.492 (3.37)*** -.497 (3.22)*** “”*D_LCC -1.02 (4.1)*** -1.04 (3.97)*** -.474 (1.46) -.499 (1.46) Dummy Company operates at
least another route in the citypair
1.07 (5.21)*** .1.03 (4.59)*** 1.32 (6.64)*** 1.26 (5.75)*** “”*D_LCC -.208 (.70) -.223 (0.71) -.508 (1.33) -.377 (.92) D – exit in route in last 12 mths 1.15 (6.37)*** 1.11 (5.85)***
“”*D_LCC -.707 (2.58)*** -.816 (2.77)***
D – entry in route in last 12 mths .098 (.58) .170 (.93)
“ ”* D_LCC -.190 (.59) -.011 (.03)
Log No. Company in route .897 (4.22)*** .804 (3.44)*** .278 (1.38) .316 (1.40) “”*D_LCC .301 (.94) .305 (0.89) .752 (1.77)* .655 (1.43) D_ At least one company operates
route on seasonal basis
-.429 (1.63) -.500 (1.67)* .411 (1.91)* .354 (1.48) “”*D_LCC .761 (1.71)* .838 (1.77) * .419 (.67) .490 (.76) Herfindhal of total passengers in
routes within a citypair
.212 (.47) .074 (.15) 1.08 (2.66)*** 1.24 (2.84)*** “”*D_LCC .622 (1.09) .690 (1.13) -.414 (.59) -.956 (1.21) Share charter pass citypair / total
pass in cityp.
1.42 (3.43)*** .971 (2.10)** .567 (1.07) .827 (1.38) “”*D_LCC -1.04 (1.82)* -.587 (0.96) -.634 (.62) -.607 (.58) share of tot.passenger in cityp. /
total pass in country area
-1.38 (2.77)*** -1.29 (2.29)** -2.37 (4.6)*** -2.06 (3.4)*** “”*D_LCC .182 (.32) .138 (.22) 1.58 (2.30)** 1.25 (1.5) Avg max lagged delay in 12
months over a citypair
.049 (8.3)*** .046 (7.50)*** .001 (.06) .001 (.14)
Pseudo R2 0.1319 0.1193 0.0416 0.0416
% groups correctly predicted 21.6 19.4 21.7 21.4
N 15353 13371 12209 10410
Number of groups 319 258 249 196
Mean Number of entries per group 1.40 1.45 1.37 1.42
Mean group size 48.13 51.8 49.0 53.1
Prob. Of a naïve prediction 2.90 2.79 2.79 2.67 Source: UK Civil Aviation Authority. z-statistic in parenthesis. *, **, ***: coefficient significant,
respectively, at 10%, 5% and 1% level. D_ stands for Dummy. “”*D_LCC = interaction of variable in previous row with the dummy D_LCC.