New Digital Service Pricing
The Impact of Price-Setting Practices on
Market Performance and Pricing Power
Master’s Thesis
Joakim Sundqvist
5 April 2017
Information and Service
Economy
Approved in the Department of Information and Service Economy __ / __ / 20__ and awarded the grade
Abstract of master’s thesis
i
Author Joakim Sundqvist
Title of thesis New Digital Service Pricing: The Impact of Price-Setting Practices on Market Performance and Pricing Power
Degree Master of Science in Economics and Business Administration
Degree programme Information and Service Economy
Thesis advisor(s) Merja Halme
Year of approval 2017 Number of pages 74 Language English
Abstract
This thesis examines the concept of new digital service pricing from a theoretical and an empirical point of view. Theoretically the topic was approached by summarizing materials in pricing frameworks from 1950 until 2016 to be applied for a model that may assist managers making pricing decisions for new digital services. The model consist of four parts representing the identification of: Value creation and value drivers, market strategy and corporate objectives, the competitive price range and lastly pricing strategy in the form of a scheduled set of final prices with the objective to maximize total discounted lifetime profits.
The starting point for the empirical study was to adopt the conceptual and measurement model by Ingenbleek et al. (2013) which was modified to the needs of digital services. A new scale is developed for cost-informed pricing while the scales for relative cost and relative price are modified to better suit pricing research in the digital services industry. Upon testing the conceptual framework, suggestions for further modifications are proposed. Most notably, a new construct for market potential should be included. Further issues not currently covered by the framework are value transparency and the more complex structure of the final set of prices, as opposed to the study of a final single price point. A recommendation is also made for the reimagination of the outcome variables to better approximate total discounted lifetime profits. The proposed effects had to be studied in an exploratory manner as a cause of the small sample obtained (N=20). Careful support is given to the proposition of value-informed pricing having a positive effect on market performance. Higher use of value-informed pricing also seem to increase the variance in relative price, which leads to the hypothesis that a construct for market potential should be included in the conceptual framework. Careful support is also found for the proposition that the negative impact of cost-informed pricing on relative price is larger when relative service advantage is high. Competitive intensity might affect market performance negatively, while the effect on relative price was inconclusive.
ii
Table of Contents
1 Introduction ... 5
1.1 Research Questions and Objectives ... 7
1.2 Structure of the Thesis ... 8
1.3 Terminology ... 9
2 Literature Review ... 10
2.1 Value Creation and Value Drivers ... 11
2.2 Corporate Objectives and Strategy ... 15
2.3 The Competitive Price Range ... 18
2.4 Pricing Strategy ... 21
3 Methods ... 27
3.1 Survey as a Research Method ... 27
3.2 Construct and Scale Development ... 28
3.3 Methods of Statistical Analysis ... 29
3.3.1 Exploratory Factor Analysis ... 29
3.3.2 Confirmatory Factor Analysis... 30
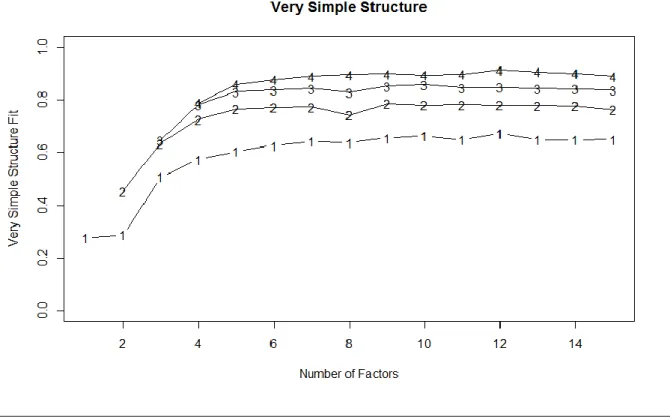
3.3.3 Very-Simple-Structure ... 31
3.3.4 Reliability Tests ... 32
4 Survey Design ... 33
4.1 Construct Development ... 33
4.2 Scale and Item Development... 36
4.3 Survey Testing ... 41
5 Propositions ... 42
6 Results ... 44
6.1 Description of Sample ... 44
6.2 Construct Validity and Scale Reliability ... 45
6.3 Interpretation of Observable Effects ... 53
6.4 Further Exploratory Findings ... 57
7 Discussion ... 59
7.1 Managerial Implications ... 62
7.2 Further Research Topics ... 62
7.3 Limitations, Validity, and Reliability ... 63
References ... 64
iii
List of Figures
Figure 1. New Digital Service Pricing Model ... 11
Figure 2. Economic Value ... 13
Figure 3. The SBIFT Model (Iveroth et al. 2013)... 15
Figure 4. Price Range for Positively and Negatively Differentiated Offerings ... 20
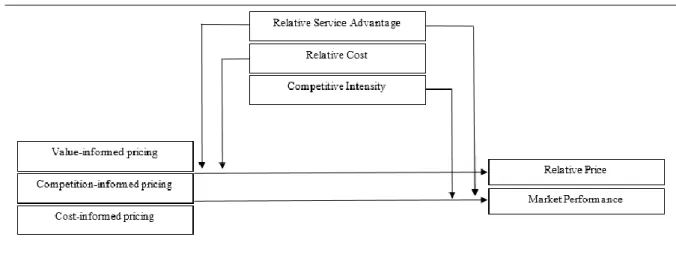
Figure 5. Conceptual Framework (Ingenbleek et al. 2013) ... 34
Figure 6. VSS Analysis Graphical Output ... 45
Figure 7. Value-Informed Pricing on Market Performance ... 53
Figure 8. Cost-Informed Pricing and Relative Cost on Market Performance ... 54
Figure 9. Value-Informed Pricing and Relative Service Advantage on Relative Price ... 54
Figure 10. Cost-Informed Pricing and Relative Service Advantage on Relative Price ... 55
Figure 11. Competitive Intensity on Relative Price ... 56
Figure 12. Competitive Intensity on Market Performance ... 56
Figure 13. Relative cost on Relative Price ... 57
iv
List of Tables
Table 1: Pricing Literature Mainly Utilized for the New Digital Service Pricing Model ... 10
Table 2: A Taxonomy of Pricing Strategies (Dixit et al. 2008, based on Tellis 1986) ... 23
Table 3: Definitions of Price-Setting Practices (adapted from Ingenbleek et al. 2003) ... 35
Table 4: EFA Factor-Loadings, All Items Included ... 46
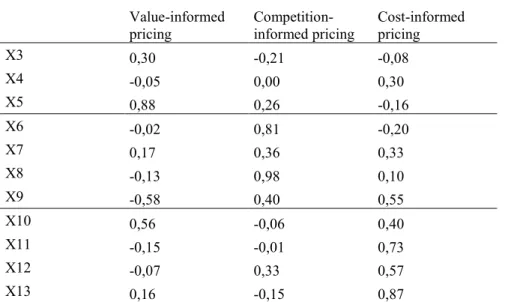
Table 5: EFA Factor-Loadings of Items Related to Price-Setting Practices ... 47
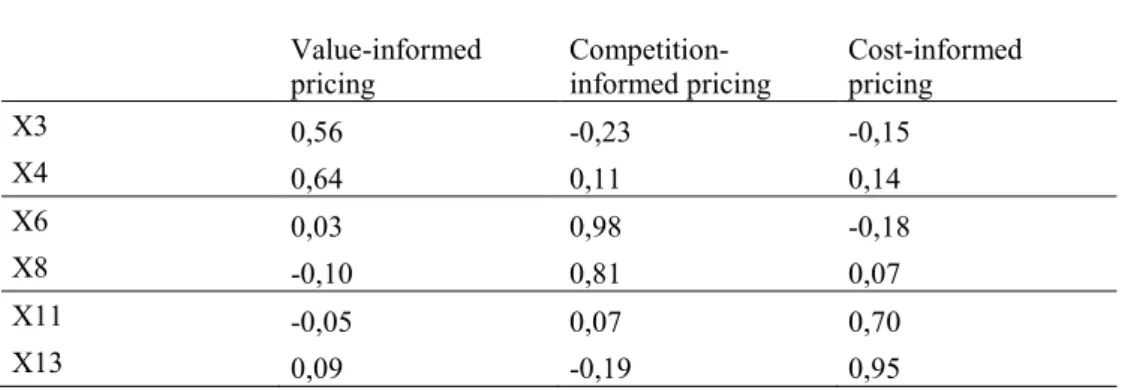
Table 6: Purified EFA Factor-Loadings Related to Price-Setting Practices ... 48
Table 7: Factor Loadings Not Related to Price-Setting Practices... 48
Table 8: Factor-Loadings of Final Item Structure ... 49
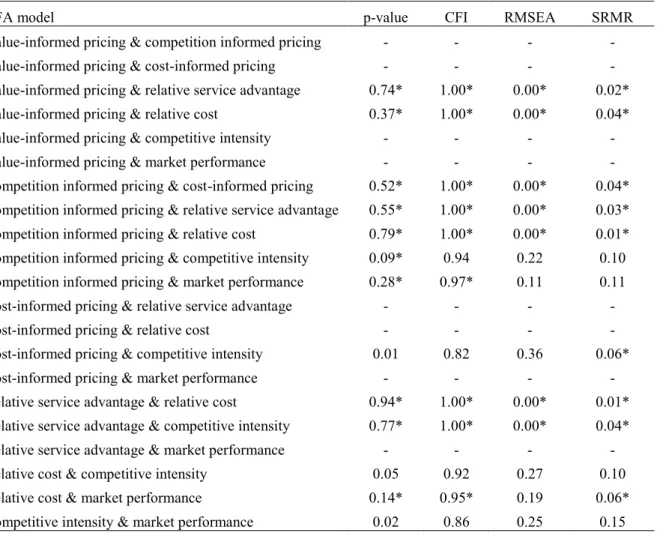
Table 9: Two Factor CFA Results ... 50
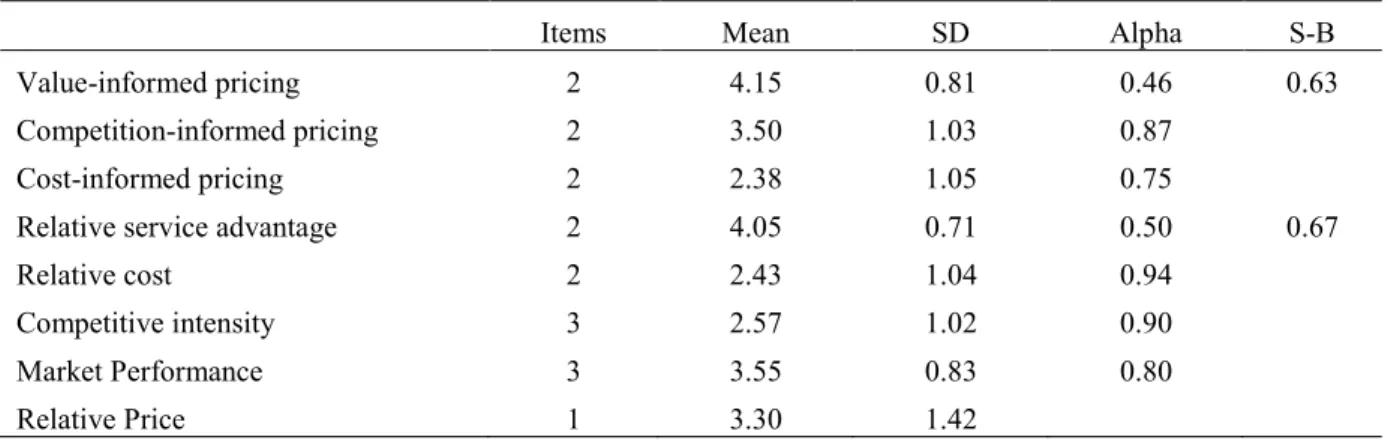
Table 10: Properties of Purified Measures... 51
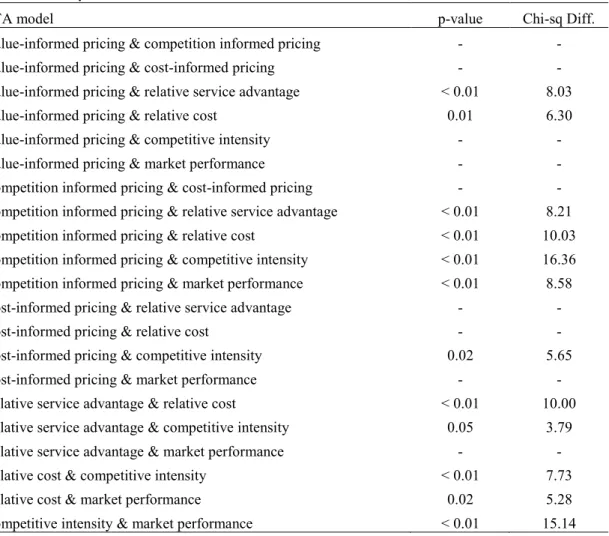
Table 11: Correlation Matrix of Purified Measures ... 51
5
1 Introduction
When launching a new product or service, pricing is a highly complex decision puzzling top management around the world (Ingenbleek et al. 2013; Dean 1976). Too often, the management responsible for the decision does not have the required expertise to take these decisions, nor the money to hire pricing consultants as expensive as they are rare (Jensen 2013). Jensen states that an annual pricing conference is the U.S. typically only draws 30-40 people. In Europe, the EADA pricing research center was the first of its kind in history and established as late as 2011. Traditionally, new product pricing has been viewed as the choice between market skimming and market penetration pricing. Despite the call for more complex approaches, papers on the subject have been few and far between (Ingenbleek 2013). As a result of this lack of pricing knowledge in companies today prices may often be set too low. Urbany (2001) shows that managers might routinely set prices too low in order to aggressively buy market share or because of fear of being overpriced as compared to competitors. This behavior will too often lead to damaging industry wide price cuts that hurt the profitability of all participants in price-wars. Marn et al. (2003) state that, in their experience, 80-90 % of new offerings are priced too low. They also argue that underpricing is a far larger problem than overpricing since high prices can be cut while low prices are
cemented in customer’s minds as reference prices, making it hard or impossible to raise
prices by much. The foregone profits of such mistakes are substantial in many industries. Cressman (1999) noticed an alarming absence of value-informed approaches in the pricing taxonomy by Noble and Grucca (1999), criticizing the internal focus of these pricing practices and called for action in order to educate managers on more modern value-informed approaches. Also, even if new product advantage over competition is considered one of the strongest predictors of new product performance (Henard & Szymanski 2001), a recent study has shown evidence that wrongful pricing practices can erode the effect of a significant product advantage (Ingenbleek et al. 2013). This shows us evidence that all the hard work put into product development might be lost if the wrong pricing decisions are made.
The Director of EADA’s Pricing Center Manu Carricano does however note several hints at the growing importance of pricing in organizations (EADA View). First, Carricano notes that pricing seems to have developed an entirely new function within organizations in the last 10-15 years. It is also more and more common to see Chief Pricing Officers in organizations. Second, Carricano cites research stating that a 1 % improvement in price has an impact on profit in the range 8-11 %, while a 1 % improvement in cost reduction only
6
increases profits by 3-7 %. Value improvements of 1 % only impact profits by 2 %. In
today’s digital, global and fast-paced competitive environment, firms now more than ever feel the pressure to act on these opportunities (EADA View). There is a clear correlation between the rising importance of pricing and the rise of the internet, as the internet provided the infrastructure needed for full globalization and greater price transparency (Homburg et al. 2009; Marn et al. 2003). In Europe, the introduction of a common currency has also contributed to increased price transparency between countries. With this background in mind, we cannot expect the importance of good pricing principles to go away anytime soon.
One issue with pricing is that price itself represents more than one thing, and is thus complex. Price in its most basic form is what the customer pays, while price from a more customer oriented view is what values the customer has to give up in order to get the benefits of the offer (Lauterborn 1990). This can include not only money, but also time spent searching for information, retrieving the product or a conscious cost in form of guilt. Dean calls this cost for the customer (Dean, 1976). Deciding what price to set is also not an isolated decision. Nowadays it is well known that prospects can use price as an indicator of quality (Rao, Monroe, 1989). The price also has a designated spot in the traditional marketing mix, and it is recommended to be set in harmony with the other parts of the marketing mix. Armstrong and Kotler (2006) states that a price will ultimately be set between a price ceiling, above which there is no demand for the product, and a price floor, below which the company cannot turn a profit. In between these points, the price will vary as a cause of marketing strategy, objectives and mix, the nature of the market and demand, competitors’ strategies and prices as well as “a number of internal and external factors”. The establishment of this competitive price range is supported by many researchers (e.g. Monroe, 2003; Nagle, Hogan, Zale, 2016; Marn et al., 2003; Jensen, 2013). Much like a stock price reflects all publicly available information on a company, the price a company put on its product reflects on the company’s strategy as well
as its communicated quality, among other things. Hence, it is important to set a price
consistent with the rest of the company’s objectives (Dean 1973; Ingenbleek et al. 2013; Nagle, Hogan, Zale, 2016).
Even if price is a component of the marketing strategy as a whole, it is also a part of the marketing mix that has some distinct features that should be highlighted. Homburg et al. (2009) points out four distinct features of pricing as part of the marketing mix. First, they point out that pricing decisions can be implemented relatively quickly as compared to other instruments in the marketing mix. Second, they point out that pricing decisions are “Hardly
7
reversible”. By this they mean that a fixed price works as a point of reference for customers
and prospects, it is against this point of reference later price changes are evaluated. Here, Marn et al. (2003) argue that this effect is stronger when trying to raise prices, as opposed to lowering them. This also falls in line with prospect theory, which states that people experience losses as worse than corresponding gains (Kahnemann 2012). Lastly, they point out that pricing decisions have a major impact since the price set is what customers are giving up to get the value of the product or service. Accordingly, pricing decisions also have a fast impact leading to rapid customer responses in many markets.
Summarized, we can see that pricing has a major impact on the profitability of firms. Price decisions and responses to price introductions and changes are also relatively rapid as opposed to other parts of the marketing mix. Though holistic research on pricing frameworks has been scarce and simplistic, this thesis will try to find common ground between both academics and practitioners in order to present a conceptual model to analyze new digital service pricing. In the empirical part, I am adopting the conceptual framework and scales of Ingenbleek et al. (2013) which are modified to better suit pricing research in the digital services industry. A completely new scale is developed suitable for the analyzing of digital service pricing, while several other items are modified to suit pricing research in this industry. The thesis ends with testing of propositions and other exploratory results before concluding with a discussion of these results.
1.1 Research Questions and Objectives
This thesis aims to find consensus among academics and practitioners in order to find a conceptual framework suitable for new digital service pricing. The empirical part of the thesis aims to develop scales and items suitable for pricing research in the digital service industry and to test the viability of proposed effects in an exploratory manner. Based on the findings in this thesis, suggestions for future research are made. Accordingly, this thesis aims to answer the following questions:
1. What insights for new digital service pricing are there to be gained from the pricing literature?
2. How should the conceptual framework by Ingenbleek et al. (2013) be changed to be more suitable for research on digital service pricing?
8
1.2 Structure of the Thesis
The theoretical part of the thesis examined holistic pricing papers and books on pricing from 1950 to today. As the aim of the study is to find consensus among academics as well as practitioners, common themes were identified and structured in a new pricing conceptual model. The empirical part utilizes the conceptual framework developed by Ingenbleek et al. (2013) and modifies the scales used to better suit pricing research in the digital services industry. The new measures are tested using exploratory factor analysis and reliability tests. Lastly, proposed effects are tested in an exploratory manner.
The thesis starts with a literature review, structured after the final new digital service pricing model. Thereafter, in the methods section, research methods and statistical methods are presented on a theoretical level. The thesis continues with a chapter on survey design, which includes construct and scale development building on the conceptual framework by Ingenbleek et al. (2013). Six proposed effects are described in the propositions section before the results are presented. The thesis ends with a discussion on the contributions, limitations, and suggestions for further research.
9
1.3 Terminology
Reference price: The benchmark price buyers refer to when evaluating offered prices (Arsmtrong & Kotler 2006; De Mayer & Estelami 2013; Erdem et al. 2010).
Reference value: The price of the next best offer (Nagle, Hogan, and Zale, 2016).
Pricing Strategy: “a set of alternative prices (or price schedules) that aim at profit
maximization within a planning period in response to a given scenario.” (Tellis, 1986) An alternative view is the traditional differentiation between skimming and penetration pricing strategies (Dean, 1976). In this thesis, the definition by Tellis (1986) is used.
Price-setting practice: “the set of activities executed by an prganization’s managers that lead to a price decision” (Ingenbleek et al., 2003).
Competitive Price Range: The pricing choice space between a price ceiling and a price floor. The term competitive price range, or range of competitive prices, derives from Dean (1976). Other terms used are price discretion (Monroe, 2003) and price window (Nagle, Hogan, and Zale, 2016).
Value Transparency: The degree to which prospects are aware of and understand the differential value delivered. (Anderson et al., 2010)
Digital Service: “Any activity or benefit that one party can give to another, that is,
essentially intangible and does not result in the ownership of anything.” (Kotler and
Armstrong, 2006) Additionally, the definition in this thesis requires the digital service to have zero variable cost. The digital service can still incur stepwise fixed cost as shown by Huang and Sundararajan (2011).
10
2 Literature Review
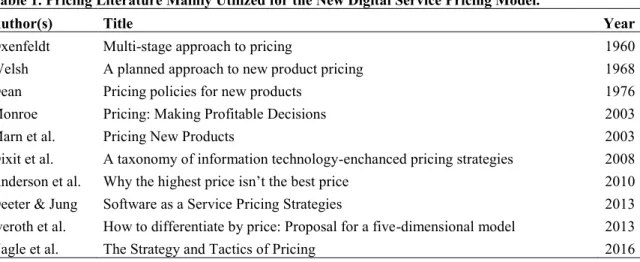
In the pricing literature reviewed, ten pricing frameworks were mainly utilized. The
oldest was Oxenfeldt’s 1960 framework with the most recent being the updated 2016 framework of Nagle, Hogan and Zale. Reviewing common themes in these ten frameworks, as well as other supporting literature, a summarized model for analyzing new digital service pricing consisting of four broad steps was developed. The ten papers and books laying the groundwork for the new model in this thesis are shown in table 1.
Table 1. Pricing Literature Mainly Utilized for the New Digital Service Pricing Model.
Author(s) Title Year
Oxenfeldt Multi-stage approach to pricing 1960
Welsh A planned approach to new product pricing 1968
Dean Pricing policies for new products 1976
Monroe Pricing: Making Profitable Decisions 2003
Marn et al. Pricing New Products 2003
Dixit et al. A taxonomy of information technology-enchanced pricing strategies 2008 Anderson et al. Why the highest price isn’t the best price 2010 Deeter & Jung Software as a Service Pricing Strategies 2013 Iveroth et al. How to differentiate by price: Proposal for a five-dimensional model 2013
Nagle et al. The Strategy and Tactics of Pricing 2016
Among the themes recognized early on there was the need to price over the whole life-cycle and the need to take competitors’ reactions into consideration (e.g. Dean, 1976; Welsh, 1968), while formal value-based approaches to pricing, on which there was consistent approval, was introduced about thirty years later. This section will present the conceptual new digital service pricing model in figure 1 by going over the steps of the conceptual model one by one. It is, however, important to recognize that pricing should take a holistic approach where each part interact with one and another (e.g. Nagle, Hogan, and Zale, 2016; Dean, 1976), instead of a pure stepwise approach. For educational purposes, the conceptual model is still presented as a stepwise process with step-order based on what lays the foundation for the next step.
11
Figure 1. New Digital Service Pricing Model
The model starts by identifying how a company creates value through its service and how the pricing should be structured in order to best capture this value. Then the company’s
strategy for the market and its impact on pricing is taken into consideration along with price and value communication strategies. Next, the competitive price range is identified, which is the range of prices between the lowest and highest possible price and different scenarios in this range are evaluated. Lastly, the company arrives at its pricing strategy, which is the final set of prices to be offered over the lifecycle. For digital services, the same underlying principles comply, which is considered important for the purpose of this thesis. Key differences between digital services, and ordinary products and services are the ease of versioning the options of pricing models available.
2.1 Value Creation and Value Drivers
The first step of any pricing decision is to truly understand how a company’s service is
creating value for its customers (Nagle, Hogan, Zale, 2016; Deeter and Jung, 2013). Part of this understanding of value creation is to identify value drivers. Is the service generating time savings, cost savings, more sales leads or reduced risk? These are examples of monetary value drivers, which are already quantifiable, and hence, fairly easy to estimate.
12
Psychological value drivers, such as satisfaction and ease of use, are much harder to quantify but just as important. There are many methods available for estimating psychological value, of which conjoint analysis is the most widely used (Green et al., 2001). Conjoint analysis allow the researcher to make trade-offs between service attributes (Green et al., 2001). The results can be useful for pricing purposes as well as research and development. These two functions of a company should follow in parallel as both are interested in what service attributes drive customer value. There is no need for R&D to develop features that customers do not value (Nagle, Hogan, Zale, 2016). Anderson et al. (2010) point out the benefits of involving customers in the development process in order to better align service features with those that customers are willing to pay for. Accordingly, pricing research can be a very effective tool for identifying development opportunities as it creates a direct link between features and customer value. Marn et al. (2003) also point out the importance of in depth interviews with the customers or prospects in order to find potential hidden values that would not be visible with formalized approaches for analysis alone.
When the drivers behind value creation have been identified, they need to be quantified. Nagle, Hogan and Zale (2016) recommend the use of the term economic value, from economics, to have a unified and distinctive measure of value. The economic value is interpreted as the maximum price a purchaser would be willing to pay. It is based on two other types of values: Reference value and differential value. The reference value is the price of the next best offer. Differential value, on the other hand, is the positive or negative value of any features or attributes added or missing as compared to the reference offer. The economic value is then calculated as the price of the next best offer plus positive differential value minus negative differential value. Anderson et al. (2010) agree with this approach assigning a whole step in his approach to the adequate identification of the next best offer, since the use of total customer value can often be misleading and lead to overpricing. This view is supported by Marn et al. (2003) as they state that the optimal price can be less than the maximum value for a number of different reasons. A real world example of this is Spotify. What is the value of a having a music collection that large on every device? For obvious reasons, a total customer value approach was not appropriate. Instead, they identified
the average spend on CD’s and doubled that number for their premium service (Spotify for
13
Figure 2. Economic Value
The economic value estimated here should not be interpreted as the final price. It is more of an agreement as to what value should be measured throughout the price-setting processes. There are many more considerations to be made before a final price optimal price can be estimated.
Once the value to the customers has been established on a general level, companies should research the possibilities for segmentation. Note that segmentation should not be done on arbitrary variables, but rather on variables that directly affect purchase motivation (Nagle, Hogan, Zale, 2016) or those that are most important to the buyer (Deeter & Jung, 2013) and hence perceived value. Segmenting on these types of variables, different values can be extracted from the segments and present an opportunity to price discriminate (Deeter and Jung, 2013). Nagle, Hogan and Zale (2016) call this value-based segmentation. As the name indicates, companies should strive to segment on the variables where the service delivers value for the customer. For example, a 3D visualization service for architects probably would have higher value for a large company working with large deals than it would for students of architecture that might get no income from the service at all. Value-based segmentation requires careful thought in order to appropriately determine the correct discriminating value drivers for each segment. Choosing the wrong value driver will ultimately lead to the company focusing on delivering the wrong value. Deeter and Jung (2013) identify three
14
common criteria for segmentation equaling those of Tellis (1986) characteristics of consumers (in determining pricing strategy to pursue): differences in search costs, differences in reservation prices (willingness-to-pay) and special transaction costs. In determining the most appropriate segments to focus on, companies should also focus on their operational advantages and disadvantages (Nagle, Hogan, and Zale, 2016). Again emphasizing the holistic approach to pricing, companies should ask themselves what segments they can serve more efficiently than other segments (Oxenfeldt, 1960; Nagle, Hogan, Zale, 2016). While the question is important, further exploration is beyond the scope of this thesis. For a full six-step analysis for value-based segmentation, see Nagle, Hogan, and Zale (2016).
The last step of the segmentation procedure is to identify what Nagle, Hogan, and Zale (2016) call metrics, fences and price-offer configuration. This can be understood to be equivalent to that other researchers call pricing models. Metrics are the measure for how customers receive and pay for value (e.g. fare per km for taxi rides) while fences are what rules customers have to follow or fulfill in order to qualify for a discount compared to higher priced segments (volume or student discounts). Price-offer configuration is a literal description of bundling and unbundling options of features in order to best serve customers service requirements and willingness to pay. Iveroth et al. (2013) proposed a five-dimensional model with the aim of helping companies to differentiate by price through
pricing models. The model’s five dimensions are scope, base, influence, formula and
temporal rights. This abbreviates to simply the SBIFT model.
The first dimension, scope, equals the price-offer configuration of Nagle, Hogan, and Zale (2016), or the granularity of the offer from a full bundled package to a pay-per-attribute model. The second dimension, base, refers to the competitive price range, or the choice to set a price close to the maximum or minimum realistic price or somewhere in-between. We will return to the competitive price-range later. Influence reflects the degree to who determines the final price, from a company determined price-list to pay-what-you-want-pricing or the occasional exogenous pricing, where price is out of influence from both seller and buyer (such as when it is tied to an index). The last two dimensions bear similarities with the earlier mentioned metrics by Nagle, Hogan, and Zale (2016). Formula is simply a description of how price is connected with volume, while temporal rights describe how long customers have the right to use the offering. Figure 3 describes the five-dimensional model by Iveroth et al. (2013).
15
Figure 3. The SBIFT Model (Iveroth et al. (2013).
While going into more detail on the processes to arrive at an optimal pricing model is out of the scope of this thesis, it is deemed sufficient to state that companies can use these price modeling tools and concepts in order to experiment with different pricing models. The general goal should always be to identify pricing models where price aligns as closely as possible to the value received by the customer. The tools here incorporate all most common pricing models such as tiered and consumption models. The freemium pricing model is notably missing, since it is actually as much of a value communication tool as a pricing model. Hence, more information on the freemium pricing model will be presented in the section covering value communication.
2.2 Corporate Objectives and Strategy
Corporate objectives are very much dependent on the company strategy, and so should also pricing be (Dean, 1976; Nagle, Hogan, Zale, 2016; Anderson et al., 2010). The definition
of corporate objectives should be understood as “what does the company want to accomplish in this segment”. The objective should not be just to “sell more”, instead rather more sophisticated objectives aimed at improving and maintaining profitability should be stated (Anderson et al., 2010; Nagle, Hogan, Zale, 2016). For example, companies might accept lower profits for a service if they think they can lock in customers for upsells to a more profitable segment. As with company strategy, pricing strategy should also be dependent on what competitive advantage the company has. The character of the service and the type of market the service is to be introduced also play a critical role in determining corporate
16
objectives. For example, entering a new market requires a different strategy than introducing an evolutionary service to an old market. Accordingly, different corporate objectives, and hence pricing guidelines, should be set (Anderson et al., 2010). Also in the traditional marketing mix, it is recommended that price should be aligned with the other elements of the marketing mix (Homburg et al., 2009; Oxenfeldt, 1960). The market potential also plays a crucial role in determining corporate objectives, as it sets the stage for the total collectable profits for the service and whether to pursue a relatively high or low price (Dean, 1976). The higher the market potential, the larger the threat from existing and potential competitors is as well. On the other hand, some companies do indeed have a competitive advantage through cost efficiency. This is the only way a company can motivate competing on price (Nagle, Hogan, Zale, 2016).
Once the company has clear objectives in line with the company strategy for continued profitability, there is one more dimension with which companies should align their objectives. The important question is; what is the differential value that is transparent to
customers?” (Anderson et al., 2010) In other words, do the potential customers understand the differential value of the service? This dimension requires companies to formulate value communication strategies, should the differential value not be transparent. Some companies bringing cost-savings to the table offer their customers calculators that estimate potential cost-savings from the service based on the customers’ own data. Others spend money on
educating the potential customers through advertising or other media (Dean, 1976). According to Nagle, Hogan, and Zale (2016), the value communication strategy is dependent on two dimensions; relative cost of search and type of benefits. Type of benefits can be economic or psychological, while relative cost of search can be high or low. Most digital services have high relative search costs, as users will often have to spend time using the service in order to realize at least some of its value, notably user experience (while some economic benefits can be proved with statistics). Services with high relative cost of search fall in the category of experience goods, and they can be especially tricky from a value communication point of view. As Shapiro put it in his 1983 paper on optimal pricing of
experience goods: “…as buyers learn about the product, the demand curve shifts over time.”
(Shapiro, 1983) Shapiro also show that a two-step pricing scheme is optimal when consumers underestimate the quality of a service good. Specifically, a low introductory price followed by a higher maintained price. Introductory offers have been common in the marketplace for a
17
long time, but only recently have the most special case of introductory offers been introduced to the marketplace – the freemium model.
Generally considered a pricing model (e.g. Deeter and Jung, 2013) it is also a value communication tool. The freemium model allows users to get acquainted with a version of the service with limited functionality for free, while prompting for upgrade to a paid premium version should the user wish full functionality (Shankarananda, 2015). There is indeed some
magic with the word “free”. Shampan’er and Ariely showed in an experiment, having people to choose between two products, one cheap priced at one cent and one premium product priced at fourteen cents, that decreasing the price of both products with one cent to zero had an abnormally positive effect on how many people chose the now free product. The
difference is in fact so large that decreasing the price to zero not only affects people’s
perceived added value through the lower price, but in fact also seem to raise the valuation of the good itself (Shampan’er, Ariely 2007). Prospects might also be cautious because of the endowment effect, stating that out-of-pocket costs are viewed as losses while the opportunity cost of using a service is seen as a foregone gain (Thaler 1980). In prospect theory, this means that there will be a discount in the valuation of the foregone gains causing the out-of-pocket cost to be disproportionally large (Kahnemann, 2012).
While the freemium model has shown itself to work well for building market share and adoption, it is also a model that requires certain elements to be profitable. One of these elements is scale. Since freemium businesses often see their share of premium users as low as 2-5 % (Shankarananda, 2015), they must address a large market in order to gain profitability. The second element is service features, as companies deciding on a freemium model must strike a delicate balance between offering too much or too little in the free version. Offering too much could cannibalize on premium sales, since there would be no need to upgrade, while offering too little could slow down adoption or even drive customers away as they fail to see the true value of the service (Lee, Gupta, Kumar, 2013). Recently, more innovative models for pricing and value communication has come up such as paidmium, which allow users to experience applications first-hand but offer in-app purchases to build revenue (Shankararanda, 2015).
Summarized, companies can communicate value by educating customers through advertising, tools, or by allowing them to experience a full or limited version of the service first-hand for a specific or indefinite time. Understanding corporate objectives in line with
18
value transparency, company strategy, and market potential will help managers in determining what the best total profit-maximizing pricing strategy would be in the long term.
2.3 The Competitive Price Range
Once managers understand how its service drives customer value and what part of that value is transparent, the company strategy and objectives suitable for the market they are operating in, it is time to determine the range of realistic or possible prices. Research efforts have placed comparatively much effort on this stage, as it provides a natural starting point when companies think about what price to set (e.g. Ingenbleek et al., 2013; Marn et al., 2003; Dean, 1976; Monroe, 2003). The basic idea is to identify the possible range of prices between a price ceiling and a price floor. Monroe (2003) separates this identification into two steps. First, companies determine an initial competitive price range. Then, factors that shrink this range are identified, such as downward pressure from competitive factors and upwards pressure from corporate objectives or regulatory constraints. Besides identifying the maximum and minimum prices that create the boundaries for the competitive price range, companies should also identify reference price points in that range to better understand the competitive landscape (Jensen, 2013; Nagle, Hogan, Zale, 2016). A reference price is the benchmark price buyers refer to when evaluating offered prices (Arsmtrong & Kotler 2006; De Mayer & Estelami 2013; Erdem et al. 2010). All of these points, including price floor and ceiling, should be established separately for each segment (Nagle, Hogan, Zale, 2016).
The price ceiling is the maximum realistically obtainable price and is dependent on
customers’ perception of value delivered by the service (Ingenbleek et al., 2003; Dean, 1976). Based on the findings when the company first researched how the service creates value for its customers, they should now turn this value into the highest possible price above which there is no demand (Armstrong, Kotler, 2006). While this price may not be realistic for a variety of reasons, such as too low demand, customers buying power leaving or competitive forces, it ensures that all possible prices are thought of (Marn et al., 2003; Ingenbleek et al., 2003; Henard, Szymanski, 2001). As discussed earlier, value transparency is also a key factor that can put downwards pressure on the price ceiling.
The price floor, on the other hand, is the lowest possible price at which the company still will remain profitable. Though cost-informed pricing generally is considered bad practice as the sole form of pricing information (e.g. Heymann, 1980; Dean, 1976), it still holds an important role in determining the price floor (Nagle, Hogan, Zale, 2016; Marn et al., 2003).
19
Determining an appropriate price floor is especially useful for “birth-control” of new
services, as the company can estimate whether the service will generate at least minimum return on investment. As pointed out by Marn et al. (2003), companies still often overlook important costs when determining their price floor. For example, all research and development expenses should be included, also costs for incomplete projects as these will affect the minimum rate of return a company requires from all its services. Goodwill from acquisitions that lead directly to new services should also be accounted for. For digital services, determining a cost floor is especially difficult since their cost structure usually comprise of a large share of fixed costs. In order to get an accurate estimate of a cost floor, accurate estimates of volume are needed (Ingenbleek et al., 2003). This increases the ambiguity of the cost floor for digital services. Marn et al. (2003), Jensen (2013), and Dean (1976) recommend that several volume estimates are made for each price point, or that a sensitivity analysis is performed. This is also important so that the company later can make accurate price-volume trade-offs when determining the final set of prices (Nagle, Hogan, Zale, 2016).
It can also be effective to analyze the prices of competitors. Methods of competition-informed pricing have taken a lot of critique over the years as a cause of its simplistic structure (copy-pasting competitors’ prices), but used correctly it has been shown to give
companies important knowledge of their competitive price range. Ingenbleek et al. (2013), show that competition-informed pricing practices can be useful in stable markets when the product advantage is high. Presumably, this is due to prices being set below prospects reference prices, which according to prospect theory should give a larger choice share to the new service or product (Kahnemann 2012). Ingenbleek et al. (2013) also show the benefit of competition-informed pricing in markets where the company’s relative product advantage is high and relative costs are low. The reason for this lies in numerical cognition literature. The authors explain that people make larger estimation mistakes when comparing a stack of 10 items against a stack of 100 items, as opposed to comparing a stack of 90 items against a stack of 100 items. Then, in the case when product advantage is high, and accordingly the price ceiling should be high, and the relative costs of the firm are low, and correspondingly a low price floor as well, companies might be better of focusing more on the price of the competition as opposed to their own cost in order to get a more accurate estimate of the price-ceiling through value informed pricing. Jensen (2013) on the other hand stresses the value of the information companies can get from competitors’ sales and prices. Much like conjoint
20
analysis, Jensen recommends that companies do a thorough mapping of competitors’
attributes and prices in order to get a complete view of the competitive landscape. By objectively comparing your product to those of your direct and indirect competitors, you can often get a decent sense of what your prospects value and are ready to pay. With all these additional price points established, the competitive price range of the new product should now feel more tangible as to what is expected at each price point.
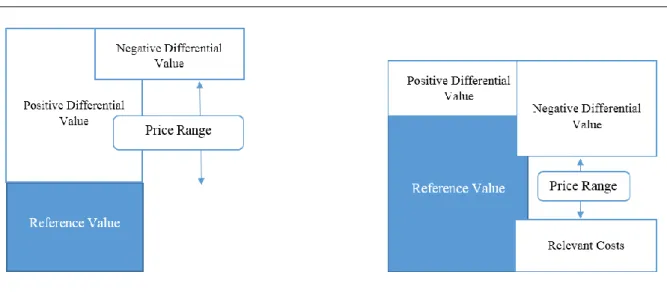
Nagle, Hogan, and Zale (2016) rely on economic and differentiation value in order to establish the competitive price range. They identify the price ceiling similarly to other models, equal to the economic value. The approach to the price floor is split into two possibilities. If the product is positively differentiated, the price floor is the reference price of the next best offering. It is only if the service is negatively differentiated that the price floor is established by relevant costs. The approach is illustrated in figure 4.
Figure 4. Price Range for Positively and Negatively Differentiated Offerings.
The authors stress the importance of allowing negatively differentiated services to keep their low prices in order to maintain a stable market. Engaging in a pricing war with these services would hurt profits for the whole industry. If a negatively differentiated service is
faced with a cut in a competitor’s price, they are wise to respond as this is the only option
they have (at least in the short term). Competitors’ reactions in general is a topic that has been present in many pricing models since the beginning (Welsh, 1968; Dean, 1976) and has continued to play an important role until this day (Marn et al., 2003; Nagle, Hogan, Zale, 2016) since pricing should be performed over the whole life-cycle. A large risk with high competitive intensity is the risk of price war, where total industry profits typically fall and all
21
participators loose. This is negative-sum competition, which should be avoided. Another example would be war of nations, where all participants end up losing resources. Negative-sum competition is distinctive from positive-Negative-sum competition, such as sports or research and development efforts, where all participants have something to gain. If nothing else, experience is gained for the next time. When facing the threat of negative-sum competition, such as price wars, managers should carefully consider the consequences of their actions as the negative consequences could often be irreversible. Accordingly, setting the price of a new service, managers should not necessarily try to outprice their competitor, if their competitor has a cost advantage that is non-achievable for the company itself (Nagle, Hogan, Zale, 2016). Should the introduced service present a significant threat to the competitor, they would probably follow through on the price-cut in order to protect market share. That is, if this price-cut would be less costly than the cost of losing market share. Chen and MacMillan (1992) showed that competitors are indeed more likely to respond and to respond quickly to price moves as compared to other competitive moves. Their findings are well in line with later advocates of thoughtful competitive pricing strategies; avoid initiating an aggressive price move if you can attract customers with any other approach.
2.4 Pricing Strategy
Once the competitive price range has been identified, companies can evaluate what
pricing strategy to pursue. Tellis (1986) defines a pricing strategy as “a set of alternative
prices (or price schedules) that aim at profit maximization within a planning period in
response to a given scenario.” This can be understood as how to price the product over its
lifetime, including planned discounts, in order to maximize profits. This definition is chosen over the classical definition that simply splits the competitive price range into skimming pricing, neutral pricing and penetration pricing (e.g. Dean, 1976, Marn et al., 2003; Nagle, Hogan, Zale, 2016) since it includes tactics, such as discounts or bundling, for strategic use. In the classical definition, skimming pricing targets the segment with the highest reference price first and then subsequently lowers the price to capture the value of other segments with lower reference prices (Dean, 1976; Homburg et al., 2009). Penetration pricing targets faster market adoption at a lower price (Ingenbleek et al. 2013; Armstrong and Kotler, 2006). Neutral pricing means striking a careful balance between benefits and price in line with the competition (Nagle, Hogan, Zale, 2016; Jensen, 2013). This classical definition nicely explains what is sought at different points in the competitive price range, but has also
22
received criticism for being overly simplistic (Ingenbleek et al., 2013). For example, as stated before, it does not consider tactics. Several authors state that it is crucial that pricing tactics
motivate customers to take action that benefit the seller and not only to “win the same business at a lower price” (Anderson et al., 2010; Nagle, Hogan, Zale, 2016; Marn et al., 2003). For example, one common way for digital services to do this is by giving customers a discount for inviting a friend (e.g. Datacamp, Uber). Again, pricing is a tool that should be
used in alignment with other tools at the company’s disposal. It is also crucial that discounts are planned and managed, and not applied on an ad-hoc basis as such practices could quickly erode profits (Nagle, Hogan, Zale, 2016) and sabotage the reference price of the service (Marn et al., 2003). Notably, Tellis (1986) taxonomy of pricing strategies include the classical market penetration and market skimming pricing strategies, and also adds other options.
According to Tellis (1986), the best suitable pricing strategy appears when shared economies, or cross-subsidies, are observed. Tellis offers the following explanation for a
shared economy: “In a shared economy, one consumer segment or product bears more of the average costs than another, but the average price still reflects cost plus acceptable profit.”
Accordingly, pricing strategies are classified into three groups depending on which factor heterogeneity is present. These groups are differential pricing strategies, where consumer heterogeneity is utilized, competitive pricing strategies, which is based on heterogeneity in the competitive positions of firms, and product line pricing strategies, which utilize the heterogeneity in a firms related set of products. Taking into account the characteristics of consumers, that some have high search cost, low reservation price or special transaction costs; a nine-cell matrix of pricing strategies is obtained. Even if Tellis taxonomy is dated, its underlying fundamentals of shared economies has proven to be applicable to later pricing strategies such as dynamic pricing and online auctions as well (Harmon et al., 2009; Dixit et al., 2008). The taxonomy is normative, but the author states that real world problems are more complex. Hence, joint effects of shared economies may occur at the same time and lead a company to pursue a combination of the pricing strategies listed. The rise of IT-enabled solutions, however, has reduced search costs and transactions costs while enabling more efficient segmentation of consumer heterogeneity in willingness to pay (Dixit et al., 2008). As such, it makes sense to present the pricing strategies only in the three dimensions representing company objectives, while only keeping the consumer characteristics in mind.
23
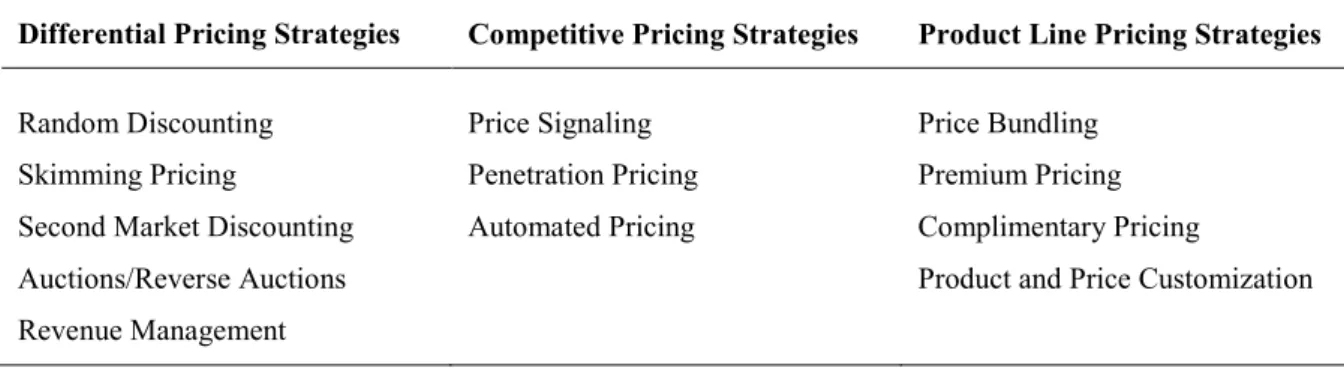
Dixit et al. (2008) presents an updated taxonomy, including IT-enhanced pricing strategies, in this way. Their taxonomy can be found in Table 2.
Table 2. A Taxonomy of Pricing Strategies (Dixit et al., 2008, based on Tellis, 1986).
Differential Pricing Strategies Competitive Pricing Strategies Product Line Pricing Strategies
Random Discounting Skimming Pricing
Second Market Discounting Auctions/Reverse Auctions Revenue Management Price Signaling Penetration Pricing Automated Pricing Price Bundling Premium Pricing Complimentary Pricing
Product and Price Customization
While a full examination of pricing strategies is beyond the scope of the thesis, a few examples are in place. Gaming companies, for instance, often use random discounting for their in-app purchases. Random discounting is like the name suggest the act of randomly and infrequently discounting the price in order to capture the additional value of consumers with a lower reservation price and lower search costs while keeping the value of consumers with a higher reservation price and higher search costs (Tellis 1986). Different types of service bundling strategies are a prime example of the tiered pricing models, where different versions of a service can be sold to customer segments with different needs and willingness-to-pay (Deeter and Jung, 2013). While the taxonomy is by no means comprehensive, it is a useful indication of what methods are available and stresses the importance of planning for discounts as a strategic option. Product-service line pricing strategies (Dixit et al., 2008) are also easily implemented for digital services, since versions of the service can have features added or removed with relative ease and fast scalability.
The final set of prices should be well aligned with the company strategy and objectives, while also considering price-volume trade-offs as well as the customers’ response (Nagle,
Hogan, Zale, 2016). For example, Amazon.com had a company strategy that emphasized fast growth so that a considerable market share could be achieved and allow the company to become top-of-mind for consumers before any competitor could copy their business model. Even though the service created considerable value, a low price was motivated by these strategic goals that maximized expected long-term profits.
The price-volume trade-off is well established in economic theory; marginal revenue should be equal to marginal cost in order to maximize profits. The problem is that these
24
numbers are usually hard to establish in reality. Hence, it has been proposed that firms use a more practical set of questions in order to necessarily accurately estimate the price-volume trade-off. For a price increase, firms should ask themselves how much volume they can afford to lose before the price increase becomes unprofitable, and vice versa for a price decrease (Nagle, Hogan, Zale, 2016). Others recommend demand estimation at several points in the price range and a sensitivity analysis (Dean, 1976; Marn et al., 2003). The consensus is that the price-volume trade-off must be taken into account by any means available in order to find a profit maximizing trade-off. The magnitude of these trade-offs will of course be dependent on the sellers margins. Digital services notably often have high margins, and hence often find themselves at an advantage lowering prices since less volume is needed to make up for the price cut (Huang, Sundararajan, 2016; Nagle, Hogan, Zale, 2016).
The last issue to be considered is the customers’ response to the new set of prices and
how to manage the price expectations of customers (Anderson et al., 2010; Nagle, Hogan, Zale, 2016). There is wide range of research available on behavioral pricing and how prices are perceived. While classical pricing research aims at developing normative models, behavioral pricing strives to explain observed behaviors with descriptive models (Thaler, 1980). In its essence, classical pricing theory does not account for anything else besides price and product characteristics (Thaler, 1985), while there are a range of proven biases that have been shown to affect purchase behavior. Such biases are for example framing, mental accounting and anchoring.
Two key factors that are affecting consumer behavior are price expectations and perceived fairness (Homburg et al. 2009). Thaler (1985) demonstrates this effect through a survey in which the respondents are to imagine themselves lying on a beach on a hot day, wishing to have a cold beer in their hand. A friend gets up to make a phone call and offers to buy a beer on the way back. Here, the survey splits into two scenarios. In the first, the beer is bought from a grocery store, and in the second it is bought from a fancy beach resort hotel. The results from this survey where in Thaler’s own words “dramatic”. At the grocery store,
the median price given was $1.50 while the median given at the beach resort hotel was as high as $2.65. Note that according to classical pricing theory atmosphere should have no impact on pricing, yet it does – as shown by behavioral pricing. In the case of digital services, there is no atmosphere to be taken into account, but the results of the survey are still applicable by thinking of services as if they are common or premium. In the beach example, the fair price of the beach resort was higher than that of the grocery store since the resort has
25
much higher costs, both for personnel and for making the hotel bar fancy enough for a beach resort hotel. Hence, the perceived costs affect the perceived fair price by consumers (Homburg et al. 2009). According to Thaler, businesses can use this principle to get higher prices by more clearly communicating high costs to the consumers (Thaler 1985). Anderson et al. (2010) put focus on the value communication strategies in order to manage customer expectations of a fair price, one key point being that customers should be able to verify the differential value with their own data when applicable.
According to prospect theory, behavioral biases should be taken into account when firms set their price in relation to the expected reference price as consumers react differently to gains (lower price than the reference price) than to losses (higher price than the reference price), reacting more disproportionally negatively to losses (Kahneman, 2012). The empirical results for this framing effect are mixed; however, as the loss aversion effect is reduced or disappears when consumers are segmented on their brand loyalty (Bell and Lattin 2000; Krishnamurthi et al. 1992; Mazumdar and Papatla 1995). The idea might still be worth considering for new services as there might be limited brand loyalty established.
Another principle affecting purchase behavior, especially when considering discounts, is the relative value of money (Homburg et al., 2009). Thaler (1980) demonstrates this through an example: Consider you are you are buying a clock radio. You find one for $25; however, a friend tells you that another store only 10 minutes away has the same clock for $20. You are now asked if you would go to the other store to get the same clock for $5 less. Then you are asked to consider the same situation, but now you are buying a TV for $500, and the other store has the same TV for $495. Would you be as willing to get the TV as the clock radio? For these reason, firms should evaluate promotions not only on dollar value, but rather on the relative price change from the original price. The same should also be true for the difference between real and reference prices.
Besides the effects already mentioned, Nagle, Hogan, and Zale (2016) summarizes additional factors influencing price sensitivity, or sensitivity to the price-value trade-off. These additional effects are the shared cost effect –buyers are less price sensitive when they are not paying the bill themselves, the switching cost effect –buyers are less price sensitive the greater the added cost of switching service, the perceived risk effect – buyers are less price sensitive when it is difficult to compare service providers and the cost of not getting expected results are high, and lastly the importance of end benefit – that buyers are less price
26
sensitive when the service is a small part of the cost of a benefit with high economic or psychological importance.
Summarized, firms striving to arrive at their final set of prices should ask themselves how much value they should try to capture with regards to the company strategy, and what the price-volume trade-offs would be at these alternatives. Also, they should ask themselves whether there are any shared economies or other circumstances that would make tactics such as discounting or bundling favorable for improvements of long-term total profits. Lastly, careful consideration should be placed on forecasting customer reactions to the price and its perceived fairness, and how to deal with these behavioral issues through a clear value communication strategy.
Once companies have gone through each of these four stages, they should have a good idea of what the optimal set of prices should be. On an ending note, it must again be stressed that pricing is not an isolated issue. Pricing is a tool that can have a great impact on the profitability of firms, but it cannot be the sole source of profitability. Good pricing practices puts pricing in alignment with other endeavors and objectives of the company while keeping an open dialogue with prospects and customers. Deviations in prices should be planned for throughout the life cycle.
The empirical section of the thesis will concentrate on a quantitative model of pricing. The conceptual framework used sees great similarities with the pricing model established in this theoretical section. Notably, the conceptual framework used in the empirical part starts at the competitive price range, and only implicitly include stages prior to that.
27
3 Methods
This section will present the theory behind the methods utilized in this thesis. First, surveying as a research method will be reviewed before drilling down into construct and scale development. Lastly, methods of statistical analysis will be presented.
3.1 Survey as a Research Method
The definition here of surveys is that of self-administered quantitative surveys, which are defined as those were respondents answer the survey without assistance or supervision and without open-ended answers. Surveys are the most common method to collect primary data (Armstrong and Kotler, 2006). They provide a clear instrument for collecting descriptive information when the researcher is aware of what information is to be sought and quantified.
There are a wide range of possible issues with surveys as a research method. Aaker et al. (2010) lists these possible issues depending on where in the procedure they are present. First, the researcher must make sure that the population has been correctly defined and that the sample is representative of the population (for example by controlling for non-response bias). Next, one must make sure that all respondents understand the questions asked correctly and in the same way. Even if they do, researchers must also make sure that the respondents have the appropriate knowledge required and remember that knowledge so that they can answer the questions appropriately. Further, respondents might also be tilting their response towards one that they find socially desirable, which introduces social response bias (Ingenbleek et al., 2013). A key issue is also that respondents might never had thought about the question being asked (Armstrong and Kotler, 2006). Lastly, the issue of response rates is more profound for self-administered surveys than for other methods of data collection. The issue is not always that adequate response rates cannot be obtained, but rather that they are hard to predict a priori (Aaker et al., 2010).
Researchers utilizing self-administered surveys should consider how the prospects of the survey should be contacted and addressed, as this can have a major impact on the response rate. Researchers should also, when possible, provide an incentive and consider the length and general user-friendliness of the survey to get a response rate as high as possible. Note, however, that a high response rate does not necessarily mean that non-response bias cannot be present in the data. Hence, it is important for researchers to identify and understand possible response and non-response patterns in their data. (Aaker et al., 2010)
28
3.2 Construct and Scale Development
The development of constructs is necessary when the variable to be observed cannot be observed directly. These directly unobservable variables are called latent variables (Borsboom et al., 2003). When these latent variables correspond to an hypothesized attribute assumed to be reflected in test scores, the term construct is appropriate (Cronbach and Meehl, 1955). These have to be approximated by creating scales (a group of questions) that tackle the measurement issue from several angles. The questions (or items) are then typically summed for the creation of a multi-item measure that works as an approximation of the latent variable. It is widely recommended to use multi-item measures instead of single-item measures in order to improve the performance of the scale (e.g. Churchill, 1979). One classic example of a latent variable is the measurement of intelligence (which in fact is a combination of five different latent variables). One may use theoretical knowledge, empirical research, or both when hypothesizing what latent variables could be present (Suhr, 2006). The issue, that a set of items forming a scale should only measure just one thing in common, is assessed by addressing unidimensionality (Hattie, 1985). Exploratory factor analysis can be used for preliminary assessment, but confirmatory factor analysis provides a more rigorous test of undimensionality and should hence be applied as demonstrated with synthetic data by Gerbing and Anderson (1988). Confirmatory factor analysis has, however, more stringent requirements on sample size, and was therefore excluded from this thesis (Suhr, 2006).
Even if unidimensionality is of great importance in successful scale development, it is not sufficient to assess only this. Reliability, or the internal consistency of the scale, is also of great importance. There would not be much use of a scale measure that fluctuated wildly as a cause of measurement error. Reliability is a measure of how stable the scale scores would be if they were tested again on a different sample. Reliability should, however, be assessed after unidimensionality has been accepted and established (Gerbing and Anderson 1988). Although unidimensionality and reliability has sometimes been confused and mixed (specifically, the most common measure of reliability has been confused with an indicator of dimensionality), they are two distinct issues. Gerbing and Anderson (1988) explain: “The
dimensionality of a scale can be evaluated by examining the patterning of its component indicator correlations, whereas the reliability of a scale is determined by the number of items that define the scale and the reliabilities of those items.” Based on unidimensionality and reliability tests scales are then purified by dropping items scoring badly on these tests. The final scale should then be a good measure of the hypothesized latent variable.
29
Summarized, the identification of constructs should be rooted in theory. Several items measuring the same latent variable should be identified at first, before a purification procedure is performed in order to obtain the final scale measuring the latent variable.
3.3 Methods of Statistical Analysis
For preliminary assessment of unidimentionality, exploratory factor analysis (EFA) has been utilized, though the analysis is not indeed a true test of unidimensionality. Confirmatory factor analysis (CFA) is one method recommended for testing unidimensionality (e.g. Gerbing and Anderson, 1988; Furr and Bacharach, 2013), and has been performed as well. A very-simple-structure (VSS) analysis was also utilized assisting the determination of the
optimal number of factors in the data. Cronbach’s alpha and Spearman-Brown have been used for assessing the reliability of the scales. These measures and techniques are presented in this section.
3.3.1 Exploratory Factor Analysis
Traditionally factor analysis has been utilized to explore the underlying structure of a set of interrelated variables without imposing any hypothesized structure on the outcome (Child, 1990). With EFA, the number of constructs and the underlying factor structure can be identified (Suhr, 2006). One issue with EFA is that it might suggest more factors than what is theoretically justifiable, often as a cause of garbage-items that do not load on the hypothesized factors but do lead to an extra number of factors being identified (Churchill, 1979). There are a number of different extraction methods and rotation options available from which to choose. For the purpose of this study, a minimum residuals extraction method was used along with a conventional orthogonal varimax rotation. The minimum residuals extraction method finds its advantage in producing similar solutions to the recommended maximum likelihood procedure even for badly behaved matrices (Personality-Project; Costello and Osborne, 2005). Costello and Osborne (2005) recommended the use of oblique rotation techniques, where factors are allowed to be correlated, since an oblique rotation will reproduce an orthogonal rotation but not the other way around. For this thesis, however, a conventional orthogonal varimax rotation was seen as a better choice since orthogonal rotations, where factors constrained to be uncorrelated, can improve interpretability. Note that rotation methods are only a transformation that improves the interpretability of the solution rather than improving the factor solution itself.
30
When using EFA as support for assessing unidimensionality and factor number identification, interpretability criteria were used along with a very-simple-structure analysis for the factor number identification. The interpretability criteria were the identification of high loadings and cross-loadings. High loadings, with loadings of at least 0.3 (Suhr, 2006) or 0.4 (Gerbing and Anderson, 1988) were kept. Cross-loadings, with factor loadings of 0.3 on at least two factors were removed (Costello and Osborne, 2005).
3.3.2 Confirmatory Factor Analysis
Confirmatory factor analysis (CFA) is a statistical technique used to verify a theorized factor structure of observed variables (Suhr, 2006). As such, an a priori belief of the factor structure is needed, as CFA is a validation test of a hypothesized factor structure. One may use theoretical knowledge, empirical research, or both when determining the hypothesized a priori factor structure to be tested. Confirmatory factor analysis is often used in behavioral sciences and other areas of research where surveys are used to collect data on multi-item scales that measure latent constructs. The role of CFA is that it can verify that these constructs are truly different, and that the data fit the hypothesized model. Though exploratory factor analysis can be used for preliminary assessment, confirmatory factor analysis provide a more rigorous test of undimensionality and should hence be applied as demonstrated with synthetic data by Gerbing and Anderson (1988).
To evaluate CFA model fit, several measures are used. Absolute measures used are the chi-square test, root mean squared error of approximation (RMSEA) and standardized root mean square residual (SRMR). The comparative fit index (CFI) has been used as a relative measure of model fit. Absolute measures of model fit directly examines how well the model fit the data, while relative measures compare the specified model to that of a null model, most often under the constraint that all variables are uncorrelated (McDonald and Ho, 2002). The chi-square goodness-of-fit statistic tests the magnitude of discrepancies between the data and the fitted covariance matrix (Hu and Bentler, 1999). In this study a conventional 5 % limit has been used to accept or reject the model, which means that a p-value below 0.05 rejects the null of perfect fit and that values higher than this should be accepted. Because of
this slightly backwards interpretation, it has sometimes been called the “badness-of-fit” test
(Hooper et al., 2008). Chi-square tests are, however, sensitive to sample size. The RMSEA on the other hand is less sensitive for sample size, and is reported with confidence intervals making it easier to interpret with small samples (Hooper et al. 2008). Hu and Bentler (1999) recommended a cutoff value of the RMSEA close to 0.06 while Hooper et al. (2008)