21 (2002) 319–337
Developing notions of inference using probability
simulation tools
夽Hollylynne Stohl
a,∗, James E. Tarr
b,1aDepartment of Mathematics, Science, and Technology Education, North Carolina State University,
326 Poe Hall, Raleigh, NC 27695, USA
bDepartment of Middle & Secondary Education, University of Missouri, 303 Townsend Hall,
Columbia, MO 65211-2400, USA
Abstract
This paper focuses on how notions of inference can be fostered in middle school through the use of carefully designed tasks, open-ended software simulation tools, and social activity that focuses on making data-based ar-guments. We analyzed interactions between two sixth-grade students who used software tools to formulate and evaluate inferences during a 12-day instructional program that utilized Probability Explorer software as a primary investigation tool. A variety of the software tools enabled students to understand the interplay between empirical and theoretical probability, recognize the importance of using larger samples to make inferences, and justify their claims with data-based evidence.
© 2002 Elsevier Science Inc. All rights reserved.
Keywords: Probability; Technology; Simulation; Middle school; Argumentation; Sample size; Concept formulation; Statistics
1. Introduction
In recent years, the National Council of Teachers of Mathematics (NCTM, 2000) has advocated that all students develop and evaluate inferences that are based on data. It is recommended that “upper-elementary and early middle grades students. . . begin to develop notions about statistical inference” (p. 50) and suggest the use of computer simulations to facilitate student learning in probability. Specifically, middle grade students “should make observations, inferences, and conjectures and develop new questions. . .and 夽An earlier version of these research findings were presented at the Twenty Fourth Annual Meeting of the North American Chapter of the International Group for the Psychology of Education, Athens, GA, October 2002.
∗Corresponding author. Tel.:+1-919-513-3544; fax:+1-919-515-1063.
E-mail addresses: [email protected] (H. Stohl), [email protected] (J.E. Tarr).
1Tel.:+1-573-882-4034; fax:+1-573-882-4481.
0732-3123/02/$ – see front matter © 2002 Elsevier Science Inc. All rights reserved. PII: S 0 7 3 2 - 3 1 2 3 ( 0 2 ) 0 0 1 3 2 - 3
use their developing facility with rational numbers and proportionality to refine their observations and conjectures” (p. 251).
Investigating students’ probabilistic reasoning with technology tools, however, is a recent endeavor (e.g.,Drier, 2000a, 2000b; Pratt, 2000). In fact, there exists a gap in knowledge about early adolescent learners’ development of probabilistic reasoning with open-ended, multi-representational software. Our research sought to determine how technology tools enable and constrain students’ development of the notion of inference from probabilistic situations. In this paper, we report how two students used software tools to formulate and evaluate inferences based on data randomly generated from simulations.
2. Conceptual framework
The framework for our research is based on a coordinated perspective of learning. In particular, we believe that learning is a constructive process of resolving perturbations through reflection on actions and effects of actions (Tzur & Simon, 1999) that allows for abstraction (von Glasersfeld, 1995). This process is coordinated with the social context in which meanings are negotiated through interactions with other cognizing individuals (Voigt, 1996). In addition, the process of resolving perturbations is enabled and constrained by tools and resources within the environment (Graue & Walsh, 1998). We believe that the intended and enacted mathematical tasks, students’ interactions with microworld tools, and the social inter-action among students and between students and teachers, all operate as potential meaning-making agents for the development of probabilistic reasoning. Thus, this constructivist framework guided the design of the microworld tools, instructional tasks, classroom teaching, and data analysis throughout our research. Aligned with this perspective, we used Simon’s (1995) notion of the Mathematics Teaching Cycle (MTC) to design and implement tasks we believed would place sixth grade students in situations where they could develop and resolve perturbations through social negotiations and by using tools in the learning environment. We utilized Simon’s conceptual framework to create purposeful pedagogy that reflected our goals for student learning yet was responsive to students’ ideas and practices. More specifically, we generated hypothetical learning trajectories prior to instruction and made adaptations based on our ongoing assessment of students’ probabilistic reasoning. In this regard the design of our curriculum was an iterative process based on student interaction with the instructional tasks, microworld tools, and the teacher–researchers. Details of our instructional program will be presented after a discussion of pertinent research on students’ learning of probability and use of simulation tools.
3. Research questions
Considering our theoretical perspective on teaching and learning in a technological environment, we sought to explore the following questions in our focused analysis of two case study sixth grade students:
• How do these students use Probability Explorer tools to simulate experiments and analyze data as part of their meaning-making processes in solving a variety of probability tasks?
• How do these students develop an understanding of the interplay of theoretical probability, empirical probability and sample size, and use these understandings and computer-based tools to formulate and justify inferences based on data?
4. Related research
Several researchers (e.g.,Battista, 1998; Biddlecomb, 1994; Land & Hannafin, 1996) have worked with children and developed principles for designing and using open-ended computer microworlds to facilitate students’ construction of knowledge.Biddlecomb (1994)emphasizes that “computer environments must be very flexible in order to make them as open as possible for the teacher and students to construct their own individual and shared mathematical environments” (p. 91). A well-designed, open-ended learning environment (OELE) enables learners to build and test their intuitive notions in an exploratory manner such that their understanding evolves as a continuous and dynamic process through observation, reflection, and experimentation (Land & Hannafin, 1996).
Probability Explorer (PE, Stohl, 1999–2002) is purposefully designed as an OELE with multiple ways to represent data that engage students in designing, simulating, and analyzing results of proba-bility experiments. At a fundamental level, data is represented in PE with randomly generated icons that can be sorted, stacked (in a pictograph) or lined up in the sequence in which they occurred. A pie graph (relative frequency), bar graph (frequency), and data table (counts, fractions, decimals, and percents) are also available to display results changing dynamically during a simulation (see
Fig. 1).
Students can use PE to develop their abilities to formulate and evaluate inferences when they have opportunities to explore a variety of probability situations, determine how many trials to run, and choose which tools to use to analyze data. One of the most important aspects of formulating and evaluating inferences is understanding the unpredictability of random phenomenon in the short-run but predictability in the long-run trends in data (i.e., the law of large numbers). Thus, the sample size in a simulation becomes an important factor for students to consider when making inferences
from a sample distribution to the population and making connections between empirical and theoretical probability.
Prior research has shown the difficulty students experience in reasoning consistently about the effect of sample size.Fischbein and Schnarch (1997)found that students’ acceptance of the use of small sample sizes increased dramatically from 5th to 11th grade. They hypothesize that “this misconception is based on the idea that a ratio is representative of an indefinite pair of numbers” (p. 101).Stavy and Tirosh (2000)
attribute this erroneous conception to an intuitive rule based on “Same A–Same B” by which students assume that if the results are in the same proportion, then the chance of each result occurring is the same. For example, students often recognize the proportional situation in tasks such as the following:
When flipping a fair coin, which is more likely to occur or are they equally likely? (a) 2 heads and 1 tail with 3 tosses.
(b) 200 heads and 100 tails with 300 tosses.
Students often incorrectly reason that the results are equally likely to occur since the distributions are proportional (e.g., 2/3=200/300) and ignore the role of sample size in the likelihood of the two events. Stavy and Tirosh also found that students’ use of this intuitive rule seems to become more prominent with age and as their ability to recognize proportionality stabilizes.
Research on instruction aimed at helping students develop intuitive notions about sample size has shown to positively affect students’ understanding about the power of sampling in making inferences.Metz (1999)
found that, after extensive experiences in designing, implementing, and critiquing investigations within a science context, 41% of second, fourth, and fifth-grade students made arguments for the use of large samples to make inferences about a population. In a study with sixth-grade students,Aspinwall and Tarr
(2001)found that prior to instruction, five of their six case study students showed no or little awareness
of the relationship between experimental probability and sample size, and typically thought that any size sample should reflect the parent distribution. Their analyses indicated that game-like situations in which the chance of winning is unequally distributed between players helped students to understand the role sample size plays in making probability judgments. Students learned that an outcome with a small probability is more likely to win a majority of times with a small number of trials but less likely to win as the number of trials increases.
Using computer tools and representations provides students with different ways to simulate and interact with data to make inferences. In prior research with PE,Drier (2000a, 2000b)found that fourth-grade students used the representations in PE as both objects to display and interpret data, and as dynamic objects of analysis during experimentation to develop a notion of an “evening-out” phenomenon. These students recognized that larger number of trials resulted in distributions that closely resembled what they expected from the theoretical probabilities based on how they had designed an experiment.Pratt
(2000)also found that 10-year-old students working with a Chance-Maker microworld made a connection
between the number of trials and the distribution of data (viewed in pictographs and pie graphs). He also reported that students used a “workings box” to control the sample space and theoretical probabilities, which they discovered affected the distribution of data. The findings of both Pratt and Drier suggest that simulation tools that give students control over designing experiments, running as many trials as they desire, and viewing graphical representations of results may help in the development of deeper understandings of how theoretical probability, empirical probability and sample size can be used to make inferences.
5. Instructional sequence design
UsingSimon’s (1995)MTC model, we developed and co-taught a 12-day probability unit for a class of average-level sixth grade students. Based on results from prior research (Drier, 2000a), a 3-day pilot study, and the researchers’ understanding of how students reason about probability tasks, the researchers devel-oped an initial hypothetical learning trajectory for the entire unit and drafted possible instructional tasks that utilized PE as a primary investigation tool. After each day’s lesson, the teacher–researchers revised the hypothetical learning trajectory based on students’ perturbations and developing understandings, and adjusted the initially planned tasks accordingly.
Six problem-based tasks were used in the unit to develop students’ probabilistic reasoning and notion of inferences in a variety of contexts with random phenomena (e.g., coin tosses, selecting marbles from a bag, catching fish from a lake). Typically, tasks required students to model the phenomena, carry out simulations using PE, and collect, display and analyze data in order to draw appropriate inferences and formulate convincing arguments based on data. The intent of each task is described inTable 1.
The first two tasks (Fair Coin Tosses and Fair Die Tosses) were designed to help students make connections between random events with familiar objects to the random events generated in PE. These tasks purposely posed questions to elicit students’ intuition about fairness, randomness, and theoretical probability so we could build upon those intuitions in developing deeper understanding of probability concepts throughout the unit. These tasks also involved students in re-presenting the data; by hand and in
PE in a variety of representations (e.g., bar graph, pie graph, pictographs, table). The students were able to
use the representations to analyze the distribution of data and begin discussions about the role of sample size, number of outcomes (two outcomes with coins vs. six outcomes with a die) in the distribution and variation in results.
After students had analyzed data from simulations with these first two tasks, we posed a task designed to provide students a situation with an unknown sample space. We intended for them to use simulations and data analysis to infer information about the contents of a bag of marbles when they only knew that the bag had x number of marbles and any number of six possible different colored marbles. We purposely designed the first part of the Mystery Marble Bag task withx = 10 marbles to promote students’ use of percents or proportional reasoning to infer the contents of the bag. The second part of the task had x = 12 marbles to provide a situation in which proportional reasoning was not as transparent. In this regard, we would be able to distinguish whether students were actually using proportional reasoning to make inferences from data.
As students worked on this task, it became apparent that only some students were using proportional reasoning, and that most students were using a technique that involved running simulations with the number of trials (n) equal to the number of marbles in the bag (x). This n = x strategy facilitated arguments based on small sample sizes. Thus, we needed to create a task that would induce a perturbation in the students’ thinking about how to determine the number of trials to run and when they would know that they had collected enough data. The task we designed was the Mystery Fish in a Lake task.
In the Mystery Fish in a Lake task, students were challenged to determine the probability of catching a certain type of fish if they knew only that the lake had just been stocked with two types of fish for a fishing contest. Not only did the task have an indeterminate population size x, the students were asked to make inferences about a probability rather than merely the counts of each type of fish. Eventually almost all groups ran significantly large numbers of trials (e.g., 500 or more) and made informed and reasonably accurate inferences about the probability of catching a “Green Gill” fish.
Table 1
Instructional tasks used in research
Days of unit Task Intent of task
1–2 Fair Coin Tosses To discuss the concept of fairness, randomness, and begin to compare empirical results with theoretical probability.
To analyze data from a fair coin toss with real coins and tools in PE such as: stack, lineup, bar graph, pie graph, and data table.
2–3 Fair Die Tosses To analyze data from a fair die toss with real die and PE tools. To discuss outcomes of a die toss for small and large trials.
To compare variability of results between a coin toss and die toss to establish the number of outcomes as a factor in “evening out.”
4–5 Mystery Marble Bags Students will analyze data from sampling with replacement from a bag of marbles. Given a bag of 10 marbles with two of six possible colors but unknown distribution of colors, students will use PE tools to simulate and analyze data and infer bags’ contents.
Given a bag of 12 marbles with three to six possible colors but unknown distribution of colors, students will use PE tools to simulate and analyze data and infer bags’ contents.
To use evidence from simulations to support inferences made about contents of bags of marbles.
6–7 Mystery Fish in a Lake Given a lake with two different types of fish and an unknown total population, students will use the PE tools to simulate and analyze data to infer the population ratio of fish and estimate the likelihood of catching each type of fish in a lake. Students will explore several mystery lakes with ratios for three fish and discuss connections between the ratio, probability, pie graph, bar graph, and percents. (1:2:2, 1:2:3, 2:6:8, 1:1:2, and 2:2:6).
8–9 Designing a Model: Weather and Spinner Simulations
Given both a discrete (weather) and a continuous (spinner) probability situation, students will use the Weight Tool to model the situation in PE.
Students will use proportional reasoning to justify why two sets of weights are equivalent, as well as why a given set of weights accurately models a spinner. Students will collect data and analyze the empirical distributions as evidence of whether their Weight Tool is an accurate model.
10–12 Schoolopoly task Students will use PE to simulate rolls of a die and display data using a variety of representations.
Students will draw inferences regarding the fairness of a die and estimate theoretical probabilities based on the outcomes of their experiments and simulations.
Students will evaluate the validity of arguments and claims based on data.
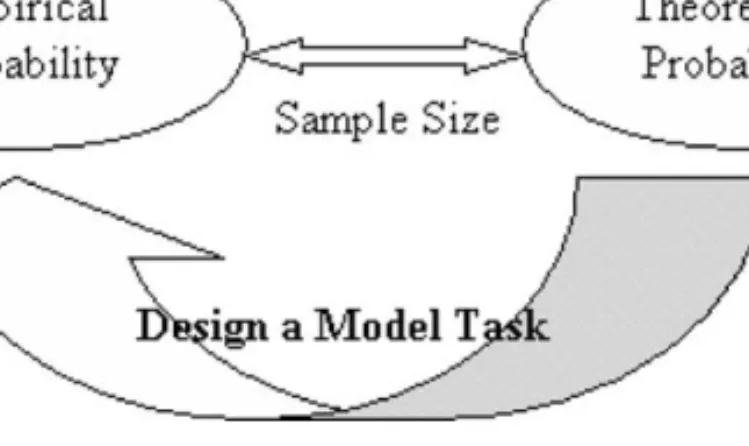
For most students, the Mystery Fish in a Lake task accomplished the goal of having students realize how collecting large amounts of data can allow one to notice trends in data and make inferences about the population in question. In the Designing a Model task, students were given a situation and had to build a model based on theoretical probabilities and use empirical data to test the “goodness” of their model. Thus, these two tasks together helped students develop an understanding about the bi-directional relationship between empirical and theoretical probability and the role of sample size in that relationship
(seeFig. 2). We felt that having a robust understanding of this bi-directional connection was important
Fig. 2. Establishing the bi-directional relationship between empirical and theoretical probability.
The Design a Model task was also purposely developed to put students into a situation where they could use a familiar context (e.g., parts of a circle) that would promote proportional reasoning as well as the use of the pie graph and percents in their data analysis. Up to this point, many students in the class were still using mainly part–part reasoning and we wanted to provide a situation that would elicit thinking about the relationship between parts, as well as between parts and a whole. The similarity between a spinner and a pie graph helped accomplish this goal.
The final task of the unit, Schoolopoly, posed a situation in which students were asked to investigate several die companies that were rumored to produce biased dice. Each group of students investigated a different die company using a PE file that was pre-designed to simulate rolls of a die. We purposely designed the files so different companies’ dice were weighted with varying degrees of bias — some biases were easier to detect than others. Each group of students was charged with the task of investigating the company’s die to: (1) determine if the die was fair, (2) recommend whether the school should buy dice from this company for the production of their Schoolopoly game, (3) provide convincing evidence (e.g., data, graphs) to support their recommendation, (4) make an estimate of the probability of obtaining each number on the die, (5) create a poster with information on the previous 1–4 tasks, and (6) present the poster and make an argument to support their claims to the class.
These six tasks were designed through careful, ongoing assessment of students’ understanding and through refinement of our hypothetical learning trajectories for students’ learning of the interplay between empirical and theoretical probability and the role of sample size in this relationship. Assessing students’ understanding of this relationship was done through the lens of analyzing their understanding of data and their ability to make inferences from data. Thus, the design of each of our tasks included students use of
PE tools for simulation, analyzing data, and making inferences based on data.
6. Methods of inquiry and data sources 6.1. Case study participants
This research report focuses on two average-level sixth-grade students who participated in a larger study of 23 sixth-grade students in an average-level mathematics class in an urban, southern public
middle school. Prior to instruction, in collaboration with the regular classroom teacher, we purposely selected (Lincoln & Guba, 1985) Manuel (Hispanic male) and Brandon (Caucasian male) to serve as one of three case-study pairs. These students were chosen to reflect the ethnic and socioeconomic diversity within the class and were representative of average-level mathematical achievement based upon scores on standardized tests in mathematics as well as a pre-instructional test in probability.
6.2. Research setting and data sources
All students were seated in pairs at tables in their regular classroom with a PC laptop, calculators, and manipulative materials (e.g., dice, spinners) readily available. Manuel and Brandon’s laptop computer was connected to a PC-to-TV converter in order to video-record their computer interactions while microphones captured their conversations. We used video recording because it is particularly helpful in trying to access students’ construction of mathematical understandings (Pirie et al., 2001) and it provided us with a direct record of how the students used the computer tools. For this paper, additional data gathered from the instructional sequence was used in the analysis. In particular, the whole-class video, students’ written class work and homework assignments comprised the data corpus.
6.3. Methods of analysis
To understand the interactions that comprise students’ meaning-making processes, our research draws upon an interpretivist approach to inquiry (Graue & Walsh, 1998) using a case study method (Stake, 1995). In particular, we used qualitative research methods to observe and critically analyze students’ probabilistic reasoning, meaning-making processes, and social and computer interactions while using
PE. In essence, case study analysis “was undertaken to make the case understandable” (Stake, 1995, p. 85) by searching for meaning through the identification of patterns in case-study students’ behavior exhibited in the data.
An analytic model for examining videotape data (Powell, 2001) was used to study the growth of students’ probabilistic reasoning and their use of computer tools. More specifically, we adapted this method to identify events (connected sequences of dialog and actions), traces (a collection of events that reveal insight into students’ thinking), and critical events (within traces) that seem significant in understanding students’ development of notions of inference. In addition we sought to identify and understand the students interactions with tools and each other that were embedded in these critical events. The research team (co-authors and several graduate students) viewed videotapes of classroom episodes and the case study students’ computer interactions. We crafted detailed descriptions of the episodes, identified critical events, transcribed excerpts of these events, and drafted analyses of the critical events. The descriptions, transcriptions, and analyses were subsequently discussed and verified among the research team, and triangulated with researchers’ on-site notes.
7. Analysis of students’ work
We present our analysis of Brandon and Manuel’s developing notions of inference and use of PE tools during critical events within three instructional tasks: Mystery Marble Bag, Design a Model (Spinner Simulation), and Schoolopoly. Across these critical events, Brandon and Manuel used several PE tools in
making informal inferences based on their developing understanding that simulations and data analysis should inform their judgments. The results presented below illustrate how they developed their ability to design and simulate experiments, use various microworld tools, support inferences with data, and formulate convincing arguments.
7.1. Mystery Marble Bag task
On the 4th day of instruction, students used PE to collect and analyze data in order to draw inferences regarding the composition of a bag containing 10 marbles (3 red, 5 yellow, 2 blue). Knowing only that there were six possible colors in the bag, Brandon and Manuel chose the Run Until tool as a novel heuristic in their problem solving. (The Run Until tool allows users to select an outcome and run a simulation until that outcome occurs.) They effectively used the Run Until tool in two distinct ways. By repeatedly sampling one marble with replacement they: (1) inferred which colors of marbles were most likely not in the bag, and (2) decided which colors were certainly present.
Brandon: Wait. Wait. Wait. This is what you do: Run experiment until you get an outcome of white. Do Run Until so you can see if there are any whites. [After 17 trials with no white outcomes] I don’t think there are any whites in the bag.
Manuel: Zippo!
Teacher: Why do you say that?
Brandon: [As marbles continue to be sampled with replacement] Because we’re running 30 trials and there’s no whites!
Manuel: So far, and we’ve run it until there’s a white. [After Run Until yields no white marbles in 54 trials, they use Run Until “green.” After the sample of 76 yields no white or green marbles, they stop the simulation, clear the data, and use Run Until “black.”]
Manuel: Well what do you know? No black! [After 14 trials yield no black marbles] Teacher: Why do you say that? You’ve done it (only) fourteen times.
Manuel: [As marbles continue to be sampled with replacement] Make that twenty-five — No, thirty! Teacher: At what point. . .do you have enough evidence to say, “There’s no black”? [As marbles
continue to be sampled with replacement] Manuel: Because you’ve run it, like. . ..
Both: Fifty times!
Teacher: But you were saying that back at ten (trials). . ..
Brandon: We knew what probably the outcome would be. And, well, that was our guess. Now we’re for sure (that there are no black marbles). Now we’re very confident and that was the goal, to be very confident.
Manuel: [After 84 trials yield no black marbles, they stop the simulation] I know what the colors are: Red, yellow and blue!
It is worth noting here that their inference regarding the absence of white, green and black marbles was sound, mathematically. In particular, if there were at least one green marble in the bag, the probability of obtaining no green marbles in 76 draws would be approximately 0.000333 (or 1 in 3000). Similarly, given the presence of at least one black marble, the probability of obtaining no black marbles in 50 draws is approximately 0.00516806 (or 1 in 193). They made initial hypotheses after a low number of trials (e.g.,
17 and 14), but felt confident enough after a more substantial number of trials (e.g., 76 and 50) to stop the simulation and conclude, “we’re very confident” about the absence of a color. Their intuitive sense of what constituted a sufficient number of trials is aligned appropriately with theoretical probabilities and makes their inference mathematically justifiable.
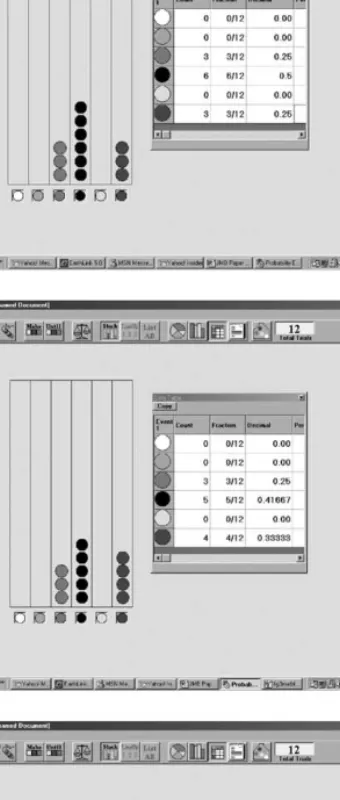
On the next day, Brandon preselected a distribution of 12 marbles (4 red, 4 black and 4 blue) and hid the bag’s contents from his partner. Manuel’s goal was to estimate the composition of the bag. He made efficient use of Run Until using it only once to decide which colors were and were not in the bag. After 140 trials yielded no white outcomes, the sample quickly grew to 500 after which Manuel observed that it contained no white, green, or yellow marbles. Moreover, he remarked that only red, black and blue marbles comprised the set of 500 outcomes. After concluding that only these three colors were present in the bag, Manuel subsequently ran 8 sets of 12 trials and used an informal approach for inferring the number of marbles of each color by estimating a mean from the observed frequencies. He displayed the results of each simulation in two ways, a stack column and data table (see sample data sets inFig. 3). He observed the number of red outcomes in the eight simulations, “rounded the numbers,” and concluded there were four red marbles. He used a similar technique to conclude there were six black marbles. In contrast, he used the fact that the bag contained 12 marbles and his belief that it contained 4 red and 6 black marbles to conclude that 2 blue marbles were present.
The tools available in PE proved to be both enabling and constraining for Manuel in formulating judgments related to the composition of the marble bag. More specifically, the Run Until feature enabled him to quickly deduce the presence of particular colors and the absence of other colors. His ability to set the number of trials in a PE simulation equal to the known number of marbles, coupled with his use of the stack column, enabled Manuel to make accurate estimations of the number of red marbles. On the other hand, the same tools ultimately constrained his ability to make accurate estimations of the other two colors. His use of a relatively small sample size and his inability to coordinate simultaneous analyses of multiple data sets yielded inferences that were inaccurate. Nevertheless, this task was posed early in the instructional program and, accordingly, Manuel’s appreciation of the power associated with large samples was only beginning to develop.
In this task, Brandon introduced the use of the Run Until tool as a strategy, but Manuel quickly realized how the data was providing relevant information. It is interesting that Manuel only used a large number of trials with the Run Until tool as evidence to infer which colors were in the bag, but repeatedly used a small sample size (12) to make his inference about the distribution of colors of marbles. Since he knew that the bag only contained 12 marbles, the use of a large number of trials may not have helped him unless he could use proportional reasoning to infer the distribution based on percentages or the empirical distributions of colors. Although Manuel did use a larger number of trials to infer which of the six colors were present in the bag, large numbers of trials would only have been useful to find the distribution if he was able to use proportional reasoning, which may not have been intuitive or accessible to him.
7.2. Spinner Simulation task
On the 8th and 9th days of instruction, Brandon and Manuel used the Weight Tool to create a model for a spinner (Fig. 4). They built the model using estimation and proportional reasoning. Manuel reasoned that the pink and blue areas in the spinner were the same and each less than 50%. Brandon thought they were each 40% and that the yellow would be 20% since it looked like “two yellow areas would make a pink area.” They subsequently ran several trials to collect data from their spinner experiment, used the pie graph
Fig. 4. First spinner and weights used in PE.
as a primary representation to analyze data and test the “goodness” of their model, and used decimals and percents in the data table as secondary representations. They most often ran multiple sets of 100 trials and occasionally a larger number of trials. The following two episodes illustrate their meaning-making about the connection between theoretical and empirical probability using several PE tools.
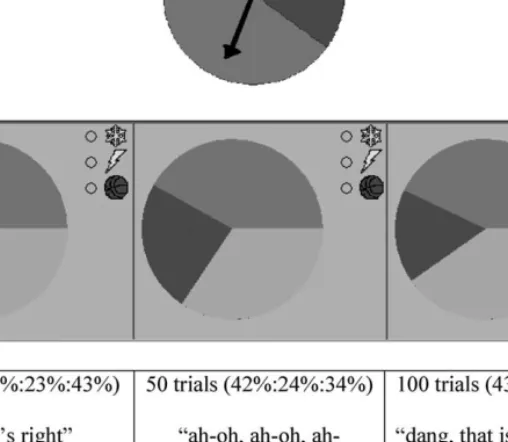
After Brandon and Manuel were convinced that their 4:2:4 model was accurate, a teacher–researcher challenged them to design a model of the spinner shown inFig. 4using a total weight of 50. Manuel typed in 20:10:20 in the Weight Tool. Brandon claimed, “that’s not right” and Manuel said, “I bet you a billion dollars it is.” The teacher–researcher asked Manuel to convince Brandon that 20:10:20 could be used to model the spinner. Manuel struggled to explain how the weight model was in proportion to the original weights of 4:2:4 or the spinner regions. Brandon decided to run simulations in PE to “see if it still comes close, as long as we have the same percentages.” He first ran 100 trials with the pie graph and data table open and after 60 trials said, “That looks pretty right.” When the 100 trials were complete [showing a 34:23:43 distribution] he said, “Okay, that’s right” (seeFig. 5). Manuel interjected, “Yeah, I just don’t know how to explain it.” As Manuel watched intently, Brandon continued to run sets of 50 and 100 trials and compare the pie graph image and percents to the physical spinner. After several sets of trials (Fig. 5) Brandon claimed, “Well, you’re right.”
Brandon compared percentages of the theoretical probability in the Weight Tool with the empirical data shown in the pie graph and data table. He used empirical data to support or confute the notion that weights of 20:10:20 appropriately modeled the spinner. His use of 50 and 100 trials were not particularly large, but he may have been using these numbers since 50 is compatible with the total weight and 100 is convenient in reasoning about part–whole relationships in the pie graph. It is important to note that Brandon needed to run several sets of 50 and 100 trials before he was convinced that the empirical data supported the use of weights of 20:10:20 to model the spinner.
In a subsequent episode several minutes later, Manuel used empirical data to question the accuracy of a theoretical model. A second spinner and the initial weights for their model are shown inFig. 6. (Note: correct weights would have been 2:6:4, thus although their model was not precise initially, it was reasonably close). They ran 770 trials and Brandon noted, “Dang that [pie graph] is close” with Manuel chiming in “Yep” (the pie graph showed about 20%:52%:28%).
The software application froze and Brandon restarted the application and redesigned the weights, but mistakenly inserted a 5 (rather than 3) for the “rock” representing the green sector. Brandon ran 100 trials and Manuel commented, “Dang, man, that is so impossible. . .that [pie graph] is so way off.” Brandon responded, “No sir!” Manuel opened the Weight Tool and argued, “Dude, you messed it up, you made. . . the rock is supposed to be three. That is why the graph doesn’t look right.”
Fig. 5. Sample pie graphs and percents used by Brandon.
Although Brandon used empirical data to test the weights used for the first spinner, Manuel made the connection between the empirical data and the weights and was able to apply his understanding when the pie graph did not appear as he expected in the simulation with the second spinner. In this task, both students made sense of how empirical data could be used to test a theoretical model. This type of meaning-making
is an important component to being able to use empirical data from a large number of trials to make inferences about unknown theoretical probabilities. The subsequent task in the instructional sequence (Schoolopoly) required students to make inferences regarding the fairness of a die and support their claim with data.
7.3. Schoolopoly task
On the 10th and 11th days of instruction, Brandon and Manuel sought to investigate claims that a company manufactured faulty (biased) dice. Unbeknownst to them, weights of 2-3-2-3-2-3 were preloaded into the Weight Tool for the outcomes, 1–6, respectively. Their assignment was to collect evidence to support or reject claims that the die is biased and to estimate the theoretical probability of each outcome. On Day 10, they began by running a total of 51 trials and noticed that 5 occurred only three times. This result focused their attention on the number of 5s in a subsequent set of 500 trials. While the simulation ran, they repeatedly commented on the low number of 5s and 1s in relation to the other frequencies and hypothesized that these outcomes were relatively difficult to obtain. Manuel decided to run 50 (new) trials and used the data table and stack column to analyze data. This set of data yielded many 5s, leading Brandon to state that he thought the die was indeed fair. Manuel ran a second set of 50 trials with a 9-6-4-11-9-11 distribution which led Brandon to announce “Dang! This is fair.” His notion of fairness was grounded in the observations of indiscernible patterns in the sample distributions from relatively small sets of data. Brandon and Manuel concluded Day 10 by writing that they believed their die was fair. At the start of Day 11, Brandon had control of the mouse and set the number of trials to 300 because it represented a large multiple of 6. As the simulation ran, they monitored the relative frequencies displayed in the data table, pie graph and bar graph. At 60 trials, with few 5s occurring (represented in red on the pie graph and bar graphs), Brandon cheered, “Come on! Get even red!” then remarked, “I think it’s actually fair” and dismissed the non-uniform sample distribution by arguing, “Five just got off to a bad start.” As the simulation of 300 trials neared completion, Brandon concluded, “It’s pretty fair. . .It’s only five and three and one are a bit behind” (pointing to sectors in pie graph). After the data had been cleared, Brandon paused for a few seconds — apparently reflecting on the data — and altered his belief about the die’s fairness, stimulating the following discourse:
Brandon: I really don’t think it’s fair. Manuel: [In disbelief] Why?
Brandon: Just because, I. . ..
Manuel: Every single thing doesn’t have to be even, man, it’s the luck. They are pretty much close. Brandon: Yeah, you’re right. Let’s just do another five hundred (trials).
Manuel: Let’s do one million.
Brandon: No, let’s do six thousand. [Manuel sets the number of trials to 500] Now run it once. [Manuel hits Run] Now click five hundred one more time.
Manuel: I want to do the pie graph. [Opens pie graph, then bar graph, and data table at about 400 trials].
Brandon: I still think that one. . . five is continuously behind. Manuel: If you don’t think this is fair. . .It’s fair, man.
Brandon: But look at the five. [There are 580 trials with distribution of 88, 115, 80, 108, 79, and 111] Manuel: It doesn’t all have to be perfect, man! No one is going to get theirs this way that much.
Brandon: [At 650 trials] Look at the percents: thirteen (percent for 5), thirteen (percent for 3). . .I bet you that’s (the weights of) three, three, three, two, two, and one [pointing to the events 2, 4, 6, 3, 5, and 1, respectively].
Manuel: I bet you’re wrong. I bet we’re fair. Brandon: I bet we aren’t fair.
Manuel: Well, I don’t care. We are fair. Just because it’s not all even doesn’t mean we’re not fair. Dude, we’re already up to one thousand (trials).
Brandon: But still, I really don’t think. . .it’s only beating it by about a hundred.
Manuel: It’s not that unfair. [At 1300 trials] See, three and five and one are practically the same. Brandon: So they [referring to 1, 3, and 5] must have the same probability but that [referring to 2, 4,
and 6] might have been more because look they’re always a bit higher. Oh wait, you can do two thousand trials.
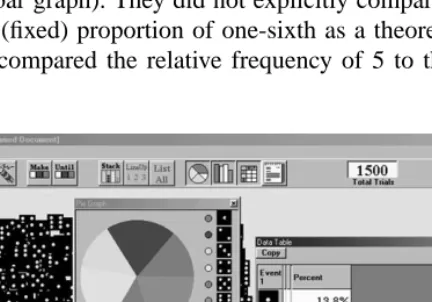
Manuel: [At approximately 1500 trials — seeFig. 7] Wait a second. Wait a second. We are unfair. These two. . .all of these [pointing to 1, 3 and 5] are (weighted) one and all of these [referring to 2, 4 and 6] are (weighted) two. So two, four, six. We’re unfair.
Brandon: Thank you. I told you!
They continued to run sets of large trials (1500 or more), compared empirical probabilities, and determined that “six, four, and two had higher probability than five, three, and one” and estimated the probability for 1–6 occurring, as 14, 20, 13, 20, 13, and 20%, respectively.
Their judgment regarding bias was based on analyses of empirical probabilities shown in several tools in PE (data table, pie graph, bar graph). They did not explicitly compare each of the observed relative frequencies to an “expected” (fixed) proportion of one-sixth as a theoretical probability for a fair die. Rather, in one instance they compared the relative frequency of 5 to the relative frequency of 6 and
concluded they were substantially different. Their intuitive inference regarding bias based on 1500 trials was, in fact, valid. More specifically, the 6% difference in the relative frequencies of 1 (13.8%) and 2 (20.07%) is 4.91 standard deviations below the expected difference in the two proportions if the die were fair. Similarly, the 7% difference in the relative frequencies of 5 (13.13%) and 6 (20.33%) is 5.76 standard deviations below the expected difference. Repeated sets of 1500 or more trials yielded similar trends and further supported their hypothesis that the die was indeed biased.
For their poster presentation, Brandon and Manuel included data from their initial small samples as an example of how a small number of trials can lead to inaccurate inferences. They also included many examples of data and graphs from large sample sizes to estimate theoretical probabilities and support their conclusion that the die were unfair. The fact that they used their initial hypothesis as a counterexample, demonstrated they understood the interplay between empirical and theoretical probability and that sample size was the connecting link between these concepts (as inFig. 2). During their classmates’ presentations, Brandon and Manuel demonstrated their ability to make arguments and inferences based on sufficient data when they both questioned whether their classmates had collected enough data to make a convincing argument. Manuel in particular used his experiences as an example and admitted he had initially made a faulty conclusion based on a small sample size.
Brandon and Manuel’s use of several PE tools (e.g., pie graph, bar graph, data table) provided visual representations of the data that facilitated their analysis, and helped challenge their initial beliefs re-garding the die’s fairness. They learned to value sample distributions generated from larger sets of data. Specifically, Brandon monitored the sample distribution as the number of trials grew large; in doing so, he was able to reconsider the notion that “Five just got off to a bad start” and instead inferred that the die was biased. Similarly, Manuel was eventually able to use data to reject his initial belief that variation among a sample is attributed exclusively to “the luck.” He detected the bias using trends in data that Bran-don had highlighted as the number of trials grew large. Together, they inferred the die was biased based on data collection, lengthy discussions, and analyzing trends in data from increasingly larger samples of data. Both students also demonstrated they understood the power of collecting sufficient amounts of data in order to justify claims and make appropriate inferences, and expected their classmates to provide sufficient evidence as well.
8. Discussion and implications
Our research indicates that students’ work with the instructional tasks and PE tools successfully fostered their ability to make appropriate inferences based on data. In particular, Brandon and Manuel’s use of
PE tools, coupled with social interaction, enabled them to make connections between simulation data
(empirical probabilities) and weights in the Weight Tool or marbles in a bag (theoretical probabilities). Although there were certainly instances when their use of PE tools constrained their thinking, the tools more often enabled them to explore the various probabilistic situations in an open-ended manner. They were able to choose how many trials to run and which representations they wanted to use to analyze the data. The visual displays of data often gave them a focal point for discussions and were used to support their inferences.
The availability and use of tools like those in PE are not a panacea for probability instruction. A critical aspect of developing effective probability instruction is the use of a reflective model of teaching (Simon, 1995) that is based on teacher’s current understanding of students’ reasoning. The tasks in our study were
purposely designed to build toward a more powerful form of inference. Brandon and Manuel’s use of data to make inferences in each task was slightly different and it informed teacher–student interactions and the design of subsequent tasks. The Schoolopoly task intentionally required students to make inferences about a population, which is more sophisticated than drawing inferences regarding the part–part distribution present within the Mystery Bag of Marbles task. The intermediate tasks, Mystery Fish in a Lake and Design a Model, represented a purposeful attempt to promote use of large sample sizes to understand the relationship between empirical and theoretical probability, and encourage use of a pie graph representation (in the spinner simulation).
Recent reform documents (NCTM, 2000) recommend that all middle school students make connections between data and chance and, in particular, develop notions about statistical inference. Our research indicates that these two average-ability sixth-grade students developed understandings of fundamental concepts that serve as foundations for the study of inferential statistics. Specifically, they learned that trends in data from sufficiently large samples can be used for making inferences, and small samples often lead to erroneous conclusions. More importantly, Brandon and Manuel made numerous accurate inferences without a predominant use of proportional reasoning, and instead used their own strategies to make valid inferences from data. Accordingly, the results of this study suggest that inference is indeed an appropriate topic for the middle school mathematics curriculum and need not be deferred until students have first developed robust proportional reasoning.
Analysis of case study students’ learning during instruction identified several critical events that led to growth in their understanding of inference. Central to these critical events were the social aspects of learn-ing, and interactions with microworld tools that proved to be essential in challenging misconceptions and extending students’ reasoning. The social activity was focused on gathering data and judging the validity of data-based arguments. This type of activity placed students in situations where their perturbations about data-based observations prompted reflection and reconciliation through further data collection, analysis, and argumentation and laid a foundation for understanding the power of larger samples. They used PE tools to assist in their analysis, and carefully listened to and reflected on each other’s claims. Brandon and Manuel attempted to coordinate their individual interpretations of the data. This coordination process helped them to either accept or reject a claim and push each other towards providing data-based arguments that ultimately allowed them to negotiate appropriate inferences. Without such social interactions, each student’s limited understanding might have gone unchallenged and ultimately stagnated growth in their understanding of the bi-directional relationship between theoretical and empirical probability.
Previous research (Fischbein & Schnarch, 1997; Stavy & Tirosh, 2000) indicates that students may not conceive the power of sample size because they invoke proportional reasoning and assume that every sample should be in proportion to (or reflect) the parent population. Such research, however, was based on written tasks that denied student access to simulation tools. Consistent withPratt (2000)andDrier
(2000a, 2000b), our results suggest that young adolescents can develop powerful notions about inference
when using simulation tools. They can recognize the importance of using larger samples in drawing valid inferences, and use data displays to understand the bi-directional connection between theoretical and empirical probabilities.
Students’ genuine understanding of inference is likely to be the product of sustained interactions with carefully sequenced problem tasks and simulation tools, occurring within a mathematical community that values argumentation and data-based justifications. Although our research documents the development of two students’ notions of inference using dynamic multi-representational software, there is a need to investigate the effects of sustained interaction (over several years) on students’ conceptions and beliefs
about sample size and their ability to make data-based inferences. More specifically, future research needs to document changes in this type of probabilistic reasoning in relation to the development of proportional reasoning, and how students’ beliefs about sample size might develop concurrently with proportional reasoning.
Given the first author’s role as developer of the PE software, teacher–researcher and co-creator of the instructional program, there is a need to investigate how typical middle school mathematics teachers can foster students’ probabilistic reasoning in a technologically rich learning environment. In particular, such research needs to determine the extent to which middle school teachers might design their own series of problem solving tasks, and how they then might coordinate classroom discourse and use students’ thinking and software tools to foster understanding.
References
Aspinwall, L., & Tarr, J. E. (2001). Middle school students’ understanding of the role sample size plays in experimental probability. Journal of Mathematical Behavior, 20, 1–17.
Battista, M. T. (1998). Computer environments that engender students’ construction of mathematical ideas and reasoning: a
constructivist perspective. Paper presented at the ENC Technology and NCTM Standards 2000 Conference. Arlington, VA,
June 5–6, 1998.
Biddlecomb, B. D. (1994). Theory-based development of computer microworlds. Journal of Research in Childhood Education,
8(2), 87–98.
Drier, H. S. (2000a). Children’s probabilistic reasoning with a computer microworld. Unpublished doctoral dissertation. Uni-versity of Virginia.
Drier, H. S. (2000b). Children’s meaning-making activity with dynamic multiple representations in a probability microworld. In: M. Fernandez (Ed.), Proceedings of the twenty-second annual meeting of the North American chapter of the international group
for the psychology of mathematics education (pp. 691–696). Columbus, OH: ERIC Clearinghouse of Science, Mathematics,
and Environmental Education.
Fischbein, E., & Schnarch, D. (1997). The evolution with age of probabilistic, intuitively based misconceptions. Journal of
Research in Mathematics Education, 28(1), 96–105.
Graue, M. E., & Walsh, D. J. (1998). Studying children in context: theories, methods, and ethics. Thousand Oaks, CA: Sage. Land, S. M., & Hannafin, M. J. (1996). A conceptual framework for the development of theories-in-action with open-ended
learning environments. Educational Technology Research and Development, 44(3), 37–53. Lincoln, Y. S., & Guba, E. G. (1985). Naturalistic inquiry. Beverly Hills, CA: Sage.
Metz, K. E. (1999). Why sampling works or why it can’t: ideas of young children engaged in research of their own design. In: F. Hitt, & M. Santos (Eds.), Proceedings of the twenty-first annual meeting of the North American chapter of the international
group for the psychology of education (pp. 492–498). Columbus, OH: ERIC Clearinghouse of Science, Mathematics, and
Environmental Education.
National Council of Teachers of Mathematics. (2000). Principles and standards for school mathematics. Reston, VA: Author. Pirie, S. I. B., Borgen, K., Manu, S. S., Jenner, D., Thom, J., & Martin, L. C. (2001). Theory, video and mathematical
understand-ing: an examination of what different theoretical perspectives can offer. In: R. Speiser, C. A. Maher, & C. N. Walter (Eds.),
Proceedings of the twenty-third annual meeting of the North American chapter of the international group for the psychology of education (pp. 343–380). Columbus, OH: ERIC Clearinghouse of Science, Mathematics, and Environmental Education.
Powell, A. (2001). Inquiry into videotape analysis for studying the growth of mathematical understanding. In: R. Speiser, C. A. Maher, & C. N. Walter (Eds.), Proceedings of the twenty-third annual meeting of the North American chapter of the
inter-national group for the psychology of education (pp. 84–86). Columbus, OH: ERIC Clearinghouse of Science, Mathematics,
and Environmental Education.
Pratt, D. (2000). Making sense of the total of two dice. Journal of Research in Mathematics Education, 31, 602–625.
Simon, M. A. (1995). Reconstructing mathematics pedagogy from a constructivist perspective. Journal for Research in
Stavy, R., & Tirosh, D. (2000) How students (mis-) understand science and mathematics: intuitive rules. New York: Teachers College Press.
Stake, R. (1995). The art of case study research. Thousand Oaks: Sage.
Stohl, H. (1999–2002). Probability Explorer. Software application distributed by author athttp://www.probexplorer.com. Tzur, R., & Simon, M. A. (1999). Postulating relationships between stages of knowing and types of tasks in mathematics
teaching: a constructivist perspective. In: F. Hitt, & M. Santos (Eds.), Proceedings of the twenty-first annual meeting of the
North American chapter of the international group for the psychology of education (pp. 805–810). Columbus, OH: ERIC
Clearinghouse of Science, Mathematics, and Environmental Education.
Voigt, J. (1996). Negotiation of mathematical meaning in classroom processes: social interaction and learning mathematics. In: L. P. Steffe, P. Nesher, P. Cobb, G. A. Goldin, & B. Greer (Eds.), Theories of mathematical learning (pp. 21–50). Mahwah, NJ: Lawrence Erlbaum.
von Glasersfeld, E. (1995). Sensory experience, abstraction, and teaching. In: L. P. Steffe, & J. Gale (Eds.), Constructivism in