Network-aware Data Movement Advisor
Patrick Brown and Mengxia Zhu
Department of Computer ScienceSouthern Illinois University Carbondale, IL 62901, USA Email:{patiek, mzhu}@cs.siu.edu
Qishi Wu and Xukang Lu
Department of Computer ScienceUniversity of Memphis Memphis, TN 38152, USA Email:{qishiwu, xlv}@memphis.edu
Abstract—Next-generation eScience applications often generate large amounts of simulation or experimental data that must be shared and managed by collaborative organizations. Advanced networking technologies and services have been rapidly developed and deployed to facilitate the massive data transport necessary for such data sharing and collaboration. However, these technolo-gies and services have not been fully utilized by application users mainly because their use typically requires significant domain knowledge and in many cases even their existence is not made aware to the public. We design and develop a Network-aware Data Movement Advisor (NADMA) utility to enable automated discovery of network and system resources and advise the user of efficient strategies for fast and successful data transfer. NADMA is primarily a client-end program that interacts with existing data/space management and discovery services such as Storage Resource Management, transport methods such as GridFTP, and network resource provisioning systems such as TeraPaths and OSCARS. NADMA acts as a route planner in a typical vehicle navigation system to provide the user a set of feasible route options along with performance estimations as well as specific steps and commands to authorize and execute data transfer. We demonstrate the efficacy of NADMA in several use cases based on its implementation and deployment in wide-area networks.
I. INTRODUCTION
High-performance computing and networking technologies have enabled large-scale scientific collaborations in various domains such as earth science and high energy physics among multiple national laboratories within U.S. Department of Energy and other research institutes across the nation. These collaborative scientific applications typically generate colossal amounts of simulation or experimental data, on the order of terabytes at present and exabytes in the near future, which must be stored, managed, and transferred to different geographical locations for distributed data processing and analysis. Typical examples include: large simulation datasets produced by an eScience application on a supercomputer that need to be moved to a remote storage site; computing workflows involving remote visualization of large datasets, real-time interactions in distributed transactions, or monitoring and steering of remote computations.
The success of these applications critically depends on net-work connections with high throughput and stable dynamics. Of particular importance are the large-scale scientific appli-cations involving expensive and powerful resources such as high-performance computing and experimental facilities [1]– [3]. These resources are created with a mission to support the scientific community and may span across several countries, as
exemplified by Large Hadron Collider [4], Earth Simulator [5], and Spallation Neutron Source [6]. In these network-intensive applications, the network itself has become an integral part of the scientific infrastructure, much like the facilities themselves, as evidenced in the NSF Teragrid project [7].
Efforts to support these large-scale applications on shared IP networks have not been very successful since very little guarantees can be provided on the throughput or dynamics and the available bandwidth varies depending on concur-rent network traffic. In view of the limitations of existing methods, dedicated connections offer a promising solution to effectively support these network-intensive applications. In fact, the importance of dedicated connections has been well recognized, and several network research projects are currently underway to develop such capabilities. They include User Controlled Light Paths (UCLP) [8], UltraScience Net (USN) [9], Circuit-switched High-speed End-to-End Trans-port ArcHitecture (CHEETAH) [10], [11], Enlightened [12], Dynamic Resource Allocation via GMPLS Optical Networks (DRAGON) [13], Japanese Gigabit Network II [14], Band-width on Demand (BoD) on Geant2 network [15], On-demand Secure Circuits and Advance Reservation System (OSCARS) [16] of ESnet, End System Control Plane Ser-vices (ESCPS) [17], Hybrid Optical and Packet Infrastructure (HOPI) [18], Bandwidth Brokers [19], Advance Network Initiative [20], and many others. Such dedicated channels are a part of the capabilities envisioned for the Global Environment for Network Innovations (GENI) project [21]. Furthermore, such deployments are expected to increase significantly and proliferate into both public and dedicated network infrastruc-tures across the globe in the coming years. Evidence of this trend in production networks is reflected by Internet2 [22] creating Multiple Protocol Label Switching (MPLS) overlays using ION [23], and ESnet [24] offering both MPLS tunnels and dedicated Virtual Local Area Networks (VLAN) using OSCARS [16].
However, these existing tools, systems, or services have a very limited user scope thus far mainly because their deploy-ment requires a certain level of network/host reconfigurations and most science users are even not aware of their existence even inside their own networks. As new computing and networking technologies rapidly emerge, enabling functional-ities are progressing at an ever-increasing pace, unfortunately, so are the dynamics, scale, heterogeneity, and complexity
of the networked computing environments. In many cases, application users, who are primarily domain experts, need to manually configure and execute their routine data-centric tasks over networks using software tools they are familiar with based on their own empirical studies, oftentimes resulting in unsatisfactory performance in such diverse and dynamic network environments.
Apparently, the discovery of available networking and stor-age technologies is a critical step towards their wide adoption. In other words, science users must be made aware of these existing technologies with consideration of the data movement they intend to execute in their target network environments. However, users are often unwilling to explore alternative data transfer options due to the burdensome discovery and initiation process of advanced network protocols and the difficulty of constructing and testing various network paths. While a better data movement strategy may exist, users always tend to use slower but more familiar alternatives.
In this paper, we design and develop a Network-aware Data Movement Advisor (NADMA) utility to enable automated discovery of network and system resources and advise the user of efficient strategies for fast and successful data transfer. NADMA is primarily a client-end program that interacts with existing data/space management and discovery services such as Storage Resource Management [25], transport methods such as GridFTP [26], and network resource provisioning systems such as TeraPaths [27] and OSCARS [16]. NADMA acts as a route planer in a typical vehicle navigation system to explore and compose a set of feasible route options and provide them to the user along with performance estimations as well as specific steps and commands to authorize and execute data transfer. The efficacy of NADMA is demonstrated in several use cases based on its implementation and deployment in wide-area networks.
The rest of the paper is organized as follows. Section II presents the NADMA architecture and details its functional components. Section III describes the operation procedure. Section IV presents the experimental results in several use cases. Section V concludes our work.
II. NADMA ARCHITECTURE ANDFUNCTIONAL
COMPONENTS
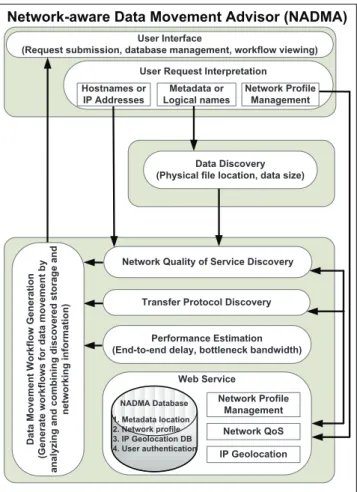
As shown in Fig. 1, the NADMA framework consists of a User Interface with a User Request Interpretation component that interacts with other components for Data Discovery, Network Quality of Service Discovery, Transfer Protocol Dis-covery, and Performance Estimation to identify and develop data movement strategies through a Data Movement Workflow Generation component.
The client end of NADMA is a downloadable software program with a user interface that communicates with a lightweight web service. The NADMA client interacts with existing data management, discovery, and movement tools and services such as SRM and GridFTP, as well as existing network resource provisioning systems such as TeraPaths, OSCARS, and ESCPS to generate workflow-based solutions
User Interface
(Request submission, database management, workflow viewing) User Request Interpretation Hostnames or IP Addresses Web Service 1. Metadata location 2. Network profile 3. IP Geolocation DB 4. User authentication Network Profile Management Network Profile Management Network QoS IP Geolocation Transfer Protocol Discovery Network Quality of Service Discovery
Performance Estimation (End-to-end delay, bottleneck bandwidth)
D a ta M o v e m e n t W o rk fl o w G e n e ra ti o n (G e n e ra te w o rk fl o w s f o r d a ta m o v e m e n t b y a n a ly z in g a n d c o m b in in g d is c o v e re d s to ra g e a n d n e tw o rk in g i n fo rm a ti o n ) Metadata or Logical names NADMA Database Data Discovery (Physical file location, data size)
Fig. 1: NADMA framework: functional components and con-trol flow.
to data movement. The server end of NADMA is based on a web service and provides a client administration interface to manage a database of discovered storage and network resource provision systems.
A. User Interface
The NADMA User Interface provides a general means for users to submit data movement requests based on various transport methods such as SRM, GSIFTP, HTTP, HTTPS, BBFTP, SCP, and SFTP. The interface also displays the dis-covered host and network information as well as the resultant data movement suggestions.
As shown in Fig. 2, the user specifies the source and desti-nation hosts in the main interface. This minimal information is required for NADMA to perform its initial network and storage resource discovery process. No authentication or protocol-specific information beyond the source and destination hosts is required. As an option, the user may provide additional infor-mation about the characteristics of the data to be transferred. Some details about the desired data transfer are described as follows.
• Transfer Data Size: The size of the data that will be transferred.
Fig. 2: Graphical User Interface.
• Maximum Duration: The maximum desired duration of the transfer.
• Earliest Start Time: The earliest time when the transfer may start.
• Latest Finish Time:The latest time when the transfer must complete.
When searching for possible data movement strategies, NADMA takes these parameters into consideration and pro-vides the user with prioritized well-structured data movement options. NADMA can be configured to probe the availability of some popular protocols at predefined ports. The user may choose to avoid such probing if it is not of interest.
For each proposed data transfer solution, the corresponding network path is visually displayed on a dynamically generated map. The route information determined by NADMA is used to produce the path layout by first matching the intermediate nodes of each route against a Geolocation IP database using the NADMA web service and then placing them onto the map using Google Static Maps API.
B. Data Discovery
In addition to specifying a particular dataset, the user is also provided the capability of discovering the dataset of interest using the built-in data discovery component. The dataset properties including source location and dataset size are automatically determined when the user selects a target dataset from the dataset discovery component.
Fig. 3: Data discovery interface for Earth System Grid.
NADMA allows the user to specify the source data by using metadata or logical names. The data discovery component interacts with the remote metadata services and replica lo-cation services (RLS) [28] to identify the physical lolo-cations of these data items and stores the information in a cache for quick access. NADMA is designed to support generic data discovery mechanisms based on web services, and we use the Earth System Grid (ESG) data discovery web service as an example for testing purposes. The user can search for data by only providing a dataset ID, which is submitted by NADMA in a query to multiple data repositories using the available data services. The search results from those geographically located ESG gateways are assembled and presented to the user. As shown in Fig. 3, the location and size of each data file
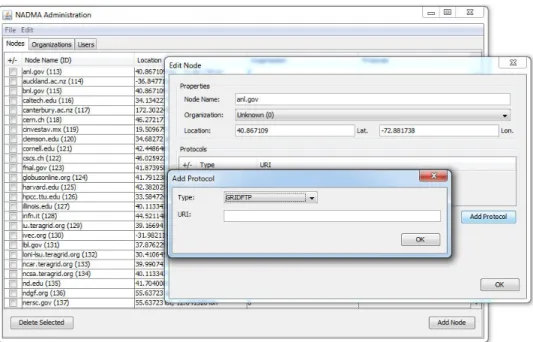
Fig. 4: A screenshot of the administrative view of the web-service driven database.
with the matched ID are displayed in the user interface. Other information such as physical access points is cached and may be used to determine and compose the fastest transfer option.
C. Network Profile Management Using Web Services
To provide accurate advising for data movement in dynamic network environments, it is critical to collect and store status and resource information including network topology, provi-sioning services, data management and movement protocols, which must be updated in a timely manner. For this purpose, we create and maintain a database, which is accessible by regular users for information lookup and by the system admin-istrator for information updates through web service calls. The user interface interacts with the remote centralized database to retrieve network profile information. Both client requests and server responses are encoded using Hessian binary web service protocol.
Since the network profile changes as new services are added or existing services are updated or removed, NADMA provides a set of system administration functions to add, remove, and edit these catalog entries through an administration interface. Fig. 4 shows an example of displaying all entries from a node table and editing a node’s fields such as organization and protocols supported via a web service System Administration window. User can also choose to delete selected nodes or add additional nodes in that same interface.
D. Network Quality of Service Discovery
Different from best-effort IP networks, high-performance networks are capable of provisioning dedicated bandwidths. The Network Quality of Service Discovery component is designed to automatically discover network resource provi-sioning systems as well as host capabilities with SRM and
GridFTP services. This component interacts with the NADMA web service to determine if an end host has access to the high-performance network infrastructure and necessary provi-sioning services. The NADMA web service queries a prede-fined centralized network profile database of known subnets and domains to determine the resource availability without the need to query the services directly. If the source and destination hosts do not support some advanced networking services such as SRM and GridFTP, NADMA tries to compose a data transfer path using known intermediate hosts in the same domain or subnet in order to achieve the best possible performance over the WAN.
In addition to a possible high-performance network path with reserved bandwidth, NADMA also explores a default Internet path between the source and destination nodes. If the source or destination node is a local host, NADMA identifies the path between the local host and the remote host using the existing traceroute or tracepath utility. If the system natively supports the tracepath command using UDP, it is preferred to the standard ICMP-based traceroute to minimize the use of superuser privileges.
E. Transfer Protocol Discovery
The Transfer Protocol Discovery component discovers transfer protocols that may be used to support the desired data transfer. NADMA scans for open ports of popular transfer protocols such as GSIFTP, HTTP, HTTPS, BBFTP, SCP, SFTP, and FTP. Special consideration is taken when initiating a third-party transfer from a remote source host to a remote destination host with respect to these protocols.
An open protocol port detected by the port scanner is considered available only if it is supported in the transfer scenario. There are three types of transfer options.
• Local Host to Remote Host: The protocol is considered available if the destination host port for the protocol is open.
• Remote Host to Local Host: The protocol is considered available if the source host port for the protocol is open and the protocol supports pull requests.
• Remote Host to Remote Host:The protocol is considered available if both the source host and the destination host have open ports for the protocol and the protocol allows third-party transfers.
Available transfer protocols are ordered by priority numbers according to the known performance and general security of the protocol with preference given to security-conscience massive data transfer protocols.
F. Bandwidth Estimation and Measurement
NADMA estimates the network performance of a transfer strategy using both an automated ICMP-based network per-formance measurement as well as a manual protocol-based performance measurement.
1) Bandwidth Estimation Using ICMP: Bing [29] is a standalone network performance measurement program that computes point-to-point throughput using two ICMP
ECHO REQU EST packets of different sizes between a pair of nodes. We convert Bing to a library that works on both Windows and Linux systems. The Performance Estimation component invokes the Bing library to estimate the end-to-end delay and the bottleneck bandwidth of the network path. The bandwidth is estimated for both reserved and Internet network paths. However, there are two distinct processes used to estimate the bottleneck bandwidth depending on the type of network.
• Reserved Network Bandwidth Estimation: When a band-width reservation service such as OSCARS is available between two endpoints, a default shortest path is com-puted based on the ESnet topology. The minimum link capacity along the path is reported to the user together with the bandwidth estimation acquired from the Bing-based estimation from the local host to its respective OS-CARS ingress endpoint, namely the intranet performance of the LAN. These two measurements are intended for the user to make an informative bandwidth reservation request to OSCARS in the future.
• Internet Network Bandwidth Estimation: The bottleneck bandwidth of the default Internet path between the local host and the remote host is directly measured using the Bing library. This bottleneck bandwidth provides a snapshot of the current Internet traffic condition and can also be considered as a projection on the expected performance in the near future.
Both bandwidth estimations require either the source or the destination host to be a local host due to the limitation of ICMP packets. NADMA does not perform ICMP-based bandwidth estimation for third-party transfer.
0 1 2 3 4 5 6 7 0 50 100 150 200 250 300 350 400 450 500 550 600 650 700 ro u n d tr ip ! ti m e ! (s ec )
file!size!(KBytes)
bandwidth Linear(bandwidth)
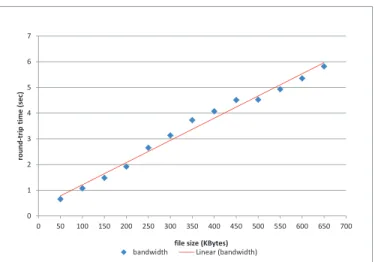
Fig. 5: A linear regression line to estimate the path bandwidth and latency between a local SIUC node and a remote node in Connecticut: the x-axis represents the file sizes in KB, and the y-axis represents the round-trip time in seconds.
2) Bandwidth Estimation using Transfer Protocol: When ICMP-based bandwidth estimation is not available, NADMA offers a protocol-specific bandwidth estimation method, which can be used to select the most suitable transfer protocol. The users can initiate bandwidth measurement within NADMA to estimate bandwidth between two hosts, including two remote hosts. The bandwidth measurement based on a specific transfer protocol such as SCP or FTP involves sending a sequence of data packets of different sizes using that protocol, measuring the corresponding data transfer times, and performing a linear regression whose slope approximates the path bandwidth and intercept approximates the minimum path delay. Fig. 5 illus-trates a linear regression line that computes the bandwidth and delay of an Internet path between a local host at Southern Illinois University, Carbondale (SIUC) and a remote host in Connecticut.
For instance, the FTP bandwidth measurement tool in NADMA measures the bandwidth between two FTP servers. This tool uses File eXchange Protocol (FXP) that is built into the FTP standard. It allows file copy from one FTP-server to another using an FXP-client without going through the local machine. To use the FXP operation, both servers must support and enable FXP. However, many servers do not have it enabled by default due to its potential security risks and the overhead of allowing passive mode transfers, which typically require a block of ports to be open in the system firewall.
G. Data Movement Workflow Generation
The Data Movement Workflow Generation component gen-erates workflows for data movement by analyzing and com-bining discovered storage, host, and network resource in-formation to build feasible data movement strategies. The estimated performance of each transfer strategy including network bandwidth and transfer duration is used to prioritize transfer workflows and make specific recommendations to
the user. Each workflow-based data transfer strategy contains performance estimation, network route as well as security and transfer protocol information, and presents several specific instructional steps using third-party tools to realize the rec-ommended transfer solution.
III. SYSTEMIMPLEMENTATION ANDOPERATION
PROCEDURE
NADMA is implemented in Java, consisting of a client front-end and a web service back-end. The web service initiates a Hessian binary web service on top of Apache Tomcat to provide a simple and secure SSL-enabled web service. The back-end uses MySQL to store and query against a database of known advanced network resource storage and provisioning systems as well as find the geolocation of IP addresses. The client generates data movement strategies in a three-step process involving Endpoint Specification, Network Discovery, and Workflow Generation and Display.
A. Endpoint Specification
NADMA requires the entry of the source endpoint and destination endpoint, one of which may be a local host, for the desired data transfer. The two endpoints are sufficient for NADMA to provide a detailed analysis, but the user may optionally specify dataset characteristics and transfer constraints such as dataset size, transfer times, and preferred transfer protocols. Additional information provided by the user assists in determining routes more suitable to the request of the user.
If an endpoint is unknown, the dataset discovery tool may be used to locate the desired dataset. The dataset discovery tool interacts with metadata services to locate and retrieve information about the desired data. The user may query the target metadata service for a dataset of interest by keywords. The user selects from a list of matched datasets and NADMA populates the appropriate endpoint and dataset information automatically.
B. Network Discovery
The source and destination endpoints provided by the user are scanned to determine supported transfer protocols. The client application attempts to connect to the common ports of various transfer protocols to determine if the protocol is available. If the source or destination host is a local host, an Internet trace route is executed to determine an Internet path and an ICMP bandwidth test is performed.
The client queries the NADMA web service with the IP addresses and hostnames of the endpoints to determine if the endpoints have access to advanced network provisioning systems, including bandwidth reservation networks such as OSCARS as well as known SRM systems. The web service locates systems that are associated with either the endpoint hostname or a subnet of the endpoint IP address. Specific information about these systems is retrieved from the database and sent to the client application.
Geographic locations of all endpoints and intermediate nodes are determined by querying the IP address geoloca-tion database using the web service. The client applicageoloca-tion determines the geographic location of the IP address of each endpoint and intermediate node. The city, state or province, country, postal code, and longitude and latitude are sent to the client. The client uses this information to construct a map of the topology of potential routes using the Google Static Maps API.
C. Workflow Generation and Display
After the network, path, and location information have been discovered, the client application generates multiple data movement workflows. The workflows are limited by the dataset characteristics and transfer preferences specified in the first step and organized by priority of transfer protocols and adherence to dataset characteristics and transfer preferences.
The client application presents a topological overview and basic network summary, including discovered route informa-tion for a high-performance network path with bandwidth reservation as well as an Internet path with basic bandwidth information. A summary of the available transfer protocols are presented with links to launch protocol-specific bandwidth tests. The tests allow for additional authentication input from the user and perform an automated bandwidth test using the given protocol.
A detailed analysis containing multiple data movement strategies is also available. The user may cycle through differ-ent workflows to view estimated performance, network path and topology, and specific steps to realize each workflow for data transfer. Each step contains general information about its function as well as specific commands that can be executed using third-party tools.
IV. CASESTUDIES
A. Case Study I: from Carbondale, IL to Trumbull, CT 1) Experimental Setup: This use case handles an Internet-based data transfer request. The source host (lab1.cs.siu.edu) is located in the campus network at SIUC and the destination host (alpha.ep-dev.com) is located in Trumbull, Connecticut. The source host is a Windows 7 PC workstation equipped with an Intel Core i5 CPU, one 1 GigE NIC, 4 GBy of RAM, and 80 GB of SATA SSD hard drive. The destination host is a Linux server equipped with an Intel Celeron 2.66 GHz, one 100 Mbit NIC, 1 GB of RAM, and a 80 GB of 7200 RPM IDE hard drive. We have an account and password on the destination host.
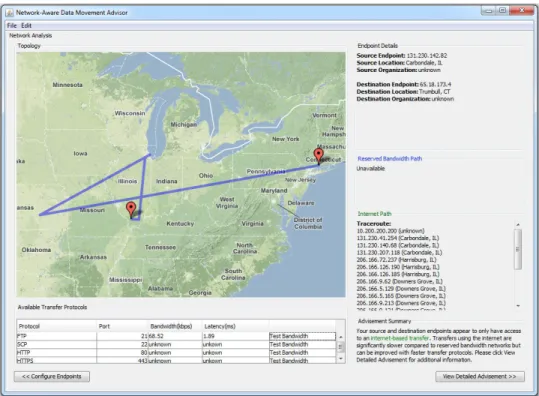
2) Data Movement Advising Output: As shown in Fig. 6, the source and destination panels display the host profiles such as the host IP address, location, and organization. It is also indicated that the OSCARS dedicated channel service is not available between these two end hosts. The Internet path with all intermediate router information is displayed in the Google map. The detected transport protocols include FTP, SCP, HTTP and HTTPS. By using the FTP protocol, the bottleneck bandwidth of this default Internet path is estimated
Fig. 6: Google map display for the measured bandwidth, latency as well as the intermediate routers along the Internet path in Case Study I.
to be 68.52Kbps with a path delay of 1.89 ms, as shown in Fig. 6.
B. Case Study II: from Lawrence Berkeley National Labora-tory (LBL) to Fermi National LaboraLabora-tory (FNL)
1) Experimental Setup: This use case handles an OSCARS-based high-performance data transfer request. The source host (src.lbl.gov) is a node located at LBL, Berkeley, California. The destination host (dea.fnal.gov) is located at FNL, Batavia, Illinois near Chicago.
2) Data Movement Advising Output: After receiving the user inputs, the NADMA system looks up the networking service profiles stored in multiple databases and generates a list of preferred source and destination URIs, which have advanced networking services installed such as SRM and GridFTP, and are close to the given endpoints. This list is sorted in a certain priority order based on the capability of performing high-performance data transfer. The given endpoints are always placed on the top of the list if they have those advanced networking services installed. Fig. 7 shows an example of the suggested intermediate sources and destinations close to the endpoints.
Among these suggestions, the user may choose one source and one destination based on his or her prefer-ence and accessibility. Suppose that the user has cho-sen (srm://sim.lbl.gov:8443) as the source and (gsiftp://cms-xen13.fnal.gov:2811) as the destination from the suggested list. The automatic port scanner also reports that both hosts have GridFTP service running at port 2811 and SRM running
at port 8443. Note that the port scanning results can be used to update the database. For any pair of selected source and destination hosts, the user can further examine the transfer route information and predict the transfer performance by interacting with OSCARS API. Based on the query results from OSCARS, the user is able to explore the best bandwidth reservation solution on this dedicated channel, either for the shortest duration or for the earliest finishing time. For illus-tration purposes, the map in Fig. 8 displays a dedicated high-performance path with intermediate routers at Kansas City and Denver, reserved bandwidth, number of hops, start time, and end time.
V. CONCLUSION
We designed and developed a toolkit, NADMA, to facilitate large-scale data movement. NADMA provides the user a set of feasible route options for data transfer in distributed network environments with automatic resource discovery and perfor-mance estimation. To achieve this goal, NADMA interacts with existing data management, discovery, and movement tools or services such as SRM and GridFTP, and existing network resource provisioning systems such as OSCARS. In a sense, NADMA acts as a route planer in a typical GPS navigation system to help users select the best possible route to reach the destination.
NADMA is a unique toolkit that has great potential to impact the science community by augmenting the traditional way of data transfer. We plan to support other provisioning systems such as TeraPaths and ESCPS by integrating their
!
Fig. 7: A screenshot of the list of suggested nearby hosts with advanced networking services in Case Study II.
Fig. 8: A screenshot of the map generated using Google Static Maps API to display the suggested routes and estimated performance in Case Study II.
APIs to communicate with these services. It is also of our interest to perform actual data transfer for the user by running underlying transport methods such as GridFTP or invoking existing data transfer services such as Globus Online.
ACKNOWLEDGMENTS
This research is sponsored by U.S. Department of En-ergy’s Office of Science under Grant No. DE-SC0002400 with University of Memphis and Grant No. DE-SC0002078 with Southern Illinois University at Carbondale.
REFERENCES
[1] “Network provisioning and portocols for DOE large-science applica-tions,” Aug. 10-11 2003, report of DOE Workshop on Ultra High-Speed Transport Protocol and Dynamic Provisioning for Large-Scale Applications, http://www.csm.ornl.gov/ghpn/wk2003.html.
[2] “High-performance networks for high-impact science,” Aug. 13-15 2002, report of the High-Performance Network Planning Workshop, http://DOECollaboratory.pnl.gov/meetings/hpnpw.
[3] NSF Grand Challenges in eScience Workshop, 2001.
http://www2.evl.uic.edu/NSF/index.html.
[4] Large Hadron Collider (LHC). http://lhc.web.cern.ch/lhc. [5] Http://www.jamstec.go.jp/esc/.
[6] Http://neutrons.ornl.gov, http://www.sns.gov/. [7] NSF Teragrid. http://www.teragrid.org.
[8] UCLP: User Controlled LightPath Provisioning. http://www.uclp.ca. [9] N. Rao, W. Wing, , S. Carter, and Q. Wu, “Ultrascience net: Network
testbed for large-scale science applications,” IEEE Communications
Magazine, vol. 43, no. 11, pp. s12–s17, 2005, an expanded version
available at www.csm.ornl.gov/ultranet.
[10] X. Zheng, M. Veeraraghavan, N. Rao, Q. Wu, and M. Zhu, “Cheetah: Circuit-switched high-speed end-to-end transport architecture testbed,”
IEEE Communications Magazine, vol. 43, no. 11, pp. s11–s17, 2005.
[11] CHEETAH: Circuit-switched High-speed End-to-End Transport ArcHi-tecture, http://www.ece.virginia.edu/cheetah.
[12] “Enlightened computing: An architecture for co-allocating network, compute, and other grid resources for high-end applications,” inProc.
of IEEE Honet, Dubai, UAE, Nov. 2007.
[13] DRAGON: Dynamic Resource Allocation via GMPLS Optical Net-works. http://dragon.maxgigapop.net.
[14] JGN II: Advanced Network Testbed for Research and Development. http://www.jgn.nict.go.jp.
[15] Geant2. http://www.geant2.net.
[16] Http://www.es.net/services/virtual-circuits-oscars/. [17] Https://plone3.fnal.gov/P0/ESCPS/.
[18] HOPI: Hybrid Optical and Packet Infrastructure.
http://networks.internet2.edu/hopi.
[19] Z. Zhang, Z. Duan, and Y. Hou, “Decoupling QoS control from core routers: A novel bandwidth broker architecture for scalable support of guaranteed services,” inProc. of ACM SIGCOMM, 2000.
[20] Advance Network Initiative. http://www.es.net/RandD/advanced-networking-initiative/.
[21] GENI: Global Environment for Network Innivations.
http://www.geni.net.
[22] Internet2. http://www.internet2.edu.
[23] Internet2 Interoperable On-Demand Network (ION) Service. http://www.internet2.edu/ion.
[24] Energy Sciences Network. http://www.es.net.
[25] Storage Resource Management (SRM). https://sdm.lbl.gov/srm-wg/. [26] GridFTP. http://www.globus.org/grid software/data/gridftp.php. [27] Https://www.racf.bnl.gov/terapaths/.
[28] Http://www.globus.org/rls/.