Edited by
Teresa S. Hawley
Robert G. Hawley
Flow Cytometry
Protocols
S
ECOND
E
DITION
Volume 263
METHODS IN MOLECULAR BIOLOGY
TMMETHODS IN MOLECULAR BIOLOGY
TMEdited by
Teresa S. Hawley
Robert G. Hawley
Flow Cytometry
Protocols
S
ECOND
E
DITION
161
Detection and Enrichment of Hematopoietic Stem Cells
by Side Population Phenotype
Shannon S. Eaker, Teresa S. Hawley, Ali Ramezani, and Robert G. Hawley
Summary
A flow cytometric procedure has recently been described to isolate hematopoietic stem cells from mouse bone marrow based on the efflux properties of the vital dye Hoechst 33342. The assay defines a subset of cells—termed the “side population” (SP)—by simultaneously measur-ing fluorescence of the dye at two wavelengths (~450 nm and >670 nm). In this chapter, SP protocols are provided to detect candidate hematopoietic stem cells in mouse bone marrow and human cord blood. In the standard method, SP profiles are readily observed on a stream-in-air cell sorter using 30 mW of 351–356 nm ultraviolet excitation from a krypton-ion laser. Alterna-tively, SP profiles can be resolved on an analytical flow cytometer with cuvette flow cell using 8 mW of 325-nm ultraviolet excitation from a helium–cadmium laser. The ability to perform the SP assay on an analytical instrument facilitates optimization of staining conditions to iden-tify hematopoietic and other stem cells in a variety of tissues. It is also demonstrated that SP pro-files of slightly lower resolution can be obtained on a stream-in-air cell sorter using 100 mW of 407-nm violet excitation from a krypton-ion laser, raising the possibility that with appropriate validation the SP assay could be performed on flow cytometers that are not equipped with ultra-violet lasers.
Key Words
Bone marrow, cord blood, hematopoietic stem cells, Hoechst 33342, side population, ultra-violet excitation, ultra-violet laser.
1. Introduction
Somatic stem cells are being increasingly characterized in a variety of tissues by a number of techniques (1). Within the hematopoietic system, stem cells can be identified by flow cytometric procedures on the basis of their cell-surface phe-notype, but the question of which cell-surface antigens are optimal for
identifi-From:Methods in Molecular Biology: Flow Cytometry Protocols, 2nd ed.
cation is still a matter of some debate (2). Other strategies that have been employed to detect and purify hematopoietic stem cells (HSCs) using flow cytometry are based on the staining patterns of fluorescent dyes (3–8). Decreased staining with the vital fluorescent dyes Hoechst 33342 (a bis-benzimidazole that binds to adenine–thymine-rich regions of the minor groove of DNA) and rho-damine 123 (which preferentially accumulates in active mitochondria) has long been used in flow cytometry experiments to enrich for HSCs (3–6). Until recently, it had been generally assumed that the weak HSC staining obtained with both of these dyes was a reflection of a kinetically and metabolically qui-escent cell that had condensed chromatin and very few or inactive mitochodria
(9–11) (see also Chapter 10 by Bertoncello and Williams, this volume). How-ever, it is now appreciated that dim staining of HSCs with Hoechst 33342 and rhodamine 123 is in large part the result of efflux mediated by at least two mem-bers of the ATP-binding cassette (ABC) family of transporters, ABCG2 (also referred to as BCRP, MXR, or ABCP) and P-glycoprotein (also referred to as MDR1 or ABCB1) (12–16).
In 1996, Goodell et al. reported a novel method to identify HSCs in mouse bone marrow that depends on dual-wavelength flow cytometric analysis of cells stained with Hoechst 33342 alone (17). By simultaneously monitoring cence emission of Hoechst 33342 at approx 450 nm (“Hoechst Blue” fluores-cence) and at >675 nm (“Hoechst Red” fluoresfluores-cence) following ultraviolet (UV) excitation, a rare subset of mouse bone marrow cells (<0.1%) was observed that displayed low blue and red fluorescence. The investigators showed that these so-called “side population” (SP) cells, which expressed the Sca-1 HSC antigen but were not stained by a cocktail of antibodies directed against a number of lin-eage markers found on mature hematopoietic cells, contained the vast majority of long-term hematopoietic repopulating activity in mouse bone marrow. Because the SP profile was selectively eliminated when Hoechst 33342 staining was performed in the presence of verapamil, a potent inhibitor of P-glycoprotein, the low level of staining was concluded to be caused by P-glycoprotein-like-mediated efflux of the dye from the cells. In accord with these findings, ectopic expression of the human MDR1gene (which encodes P-glycoprotein) in mouse bone marrow cells was shown to result in an increase in SP cell numbers (18). Examination of mice with targeted disruptions of the Mdr1aandMdr1bgenes (the mouse orthologs of human MDR1) indicated, however, that Mdr1-type gene products are not necessary for the bone marrow SP phenotype (19). The ABC transporter expressed in mouse bone marrow cells, which is the major determi-nant of the SP profile, has been identified as Bcrp1 (the mouse ortholog of human ABCG2) (16,19,20).
SP cells have also been detected in human hematopoietic tissues (21–25). Interestingly, unlike mouse bone marrow SP cells, human hematopoietic SP
cells constitute a phenotypically and functionally heterogeneous population
(22,23,25). This finding needs to be borne in mind if quantitative analyses of cell function and fate are contemplated with human hematopoietic SP cells
(26,27). HSCs are operationally defined as having the capacity to self renew and the ability to regenerate all of the different types of blood cells following transplantation into an appropriate host (28,29). With the exception of human gene transfer trials, there are no experimental systems available to character-ize human HSCs (30). Multilineage engraftment in nonobese diabetic/severe combined immunodeficient (NOD/SCID) mice is therefore widely used as a surrogate assay to evaluate human hematopoietic precursors for in vivo repop-ulating potential, and the cells exhibiting this property have been termed SCID-repopulating cells (SRCs) (31,32). Using the NOD/SCID xenograft model, Uchida et al. demonstrated that SRC activity in second-trimester human fetal liver was contained within the CD34+CD38– subset of SP cells
(23). At time of writing, SRC activity of SP cells isolated from other human hematopoietic tissue sources, such as cord blood, had not been documented.
This chapter provides protocols for the flow cytometric detection and char-acterization of SP cells in mouse bone marrow and human cord blood. Pro-cedures for sample processing and Hoechst 33342 staining are described in detail, and different flow cytometer configurations that can be used to resolve SP profiles are presented. Also included are approaches to determine whether the SP cells exhibit phenotypic or functional characteristics of HSCs.
2. Materials
2.1. Supplies and Equipment
1. Sterile surgical instruments for isolating mouse bone marrow cells: fine scissors, bone-cutting scissors, syringes, needles, forceps, and 80-µm filters/mesh. 2. Sterile tissue culture supplies: pipets, polypropylene tubes, tissue culture dishes,
and Petri dishes.
3. Hemacytometer (or other devices for counting cells). 4. Water bath set at 37°C.
5. Refrigerated centrifuge. 6. Flow cytometer equipped with:
a. Excitation wavelength: UV (325 nm or 351–364 nm) (seeNote 1).
b. Detection filters: 450/20-nm bandpass (BP) filter, 675-nm longpass (LP) filter, and 610-nm shortpass dichroic mirror.
2.2. Reagents and Solutions
1. 70% Ethanol.
2. Buffer: Phosphate-buffered saline (PBS) or Hank’s balanced salt solution (HBSS), and 2% (v/v) fetal bovine serum (FBS).
3. Medium: Dulbecco’s modified Eagle medium (DMEM) with high glucose, 2% (v/v) FBS, and 10 mM N-(2-hydroxyethyl)piperazine-N′-(2-ethanesulfonic acid) (HEPES).
4. Solutions for isolating mononuclear cells from human cord blood: anticoagulant (such as anticoagulant citrate dextrose solution A [ACD-A], sodium citrate, citrate–dextrose, citrate–phosphate–dextrose, or ethylenediaminetetraacetic acid [EDTA]) and Ficoll-Paque (Amersham Pharmacia Biotech, Piscataway, NJ). 5. Erythrocyte lysing solution: 154 mM ammonium chloride, 10 mM sodium or
potassium bicarbonate, and 0.082 mM tetrasodium EDTA. Commercial lysing solutions are also available.
6. (Optional) VarioMACS CD34 progenitor cell isolation kit (Miltenyi Biotec, Auburn, CA).
7. Hoechst 33342 (Sigma, St. Louis, MO): Prepare a stock solution of 1 mg/mL in distilled water. Store in 0.1-mL aliquots at –20°C. Refrain from refreezing and discard unused portion.
8. Verapamil (Sigma): Prepare a stock solution of 5 mM in distilled water. Store at 4°C.
9. Fumitremorgin C (FTC) (kindly provided by R. Robey and S. Bates, Medicine Branch, National Cancer Institute, National Institutes of Health, Bethesda, MD): Prepare a stock solution of 10 mMin dimethyl sulfoxide (DMSO). Store at –20°C. 10. Propidium iodide (PI): Prepare a stock solution of 1 mg/mL in distilled water.
Store in the dark at 4°C.
11. Calibration-grade beads for aligning the laser providing UV excitation.
2.3. Cells
1. Cord blood cells: Obtain human cord blood after informed consent in conformity with a human subjects protocol approved by an Institutional Review Board, or purchase from a commercial source.
2. A549 cells: A human lung carcinoma cell line (American Type Culture Collection, Manassas, VA, cat. no. CCL-185).
2.4. Mice
1. C57BL/6J mice (The Jackson Laboratory, Bar Harbor, ME, stock no. 000664). 2. NOD/SCID mice: NOD.CB17-Prkdcscid/J mice homozygous for the severe
com-bined immune deficiency spontaneous mutation (Prkdcscid, commonly referred to
as scid) on the NOD/LtSz background (nonobese diabetic mice deficient in macrophage function and having inherently low natural killer cell activity) (The Jackson Laboratory, stock no. 001303). The mice are housed in sterile microiso-lator cages on laminar flow racks to minimize adventitious infections.
All procedures involving mice must follow the guidelines set forth in the National Institutes of Health Guide for the Care and Use of Laboratory Animals and be approved by an Institutional Animal Care and Use Committee.
3. Methods
3.1. Isolation and Preparation of Mouse Bone Marrow and Human Cord Blood Cells
Because Hoechst 33342 staining conditions for C57BL/6 mouse bone marrow cells have been well established, we recommend using these cells to set up and validate the SP assay.
3.1.1. Isolation of Mouse Bone Marrow Cells
1. Euthanize a mouse according to an institutionally approved protocol. 2. Disinfect the mouse with 70% ethanol and place it on a cutting board.
3. Using sterile surgical instruments, make a transverse cut in the middle of the abdominal area. Remove the skin from the hindquarters and the hind limbs. 4. Remove the hind limbs from the body at the hip joint. Cut off the feet and place
the hind limbs in a Petri dish containing buffer.
5. Trim all muscle tissue from the femurs and tibias, and transfer them to a fresh Petri dish containing buffer.
6. Separate the femurs and tibias, and cut off the ends of the bones.
7. Transfer the femurs and tibias to a fresh Petri dish containing buffer. Gently flush out the bone marrow with 4 mL of buffer. Flush from both ends (seeNote 2). 8. Pipet cell suspension into a 10-mL tube, rinsing the Petri dish to ensure that all
cells are recovered. The cell suspension can be filtered using an 80-µm filter to remove any cell clumps (seeNotes 3and4).
3.1.2. Isolation of Human Cord Blood Mononuclear Cells
This section provides a protocol for the isolation of human cord blood mononuclear cells using a Ficoll-Paque gradient separation technique. Other published protocols and commercial isolation kits can also be used.
1. Dilute anticoagulated cord blood 1:3 with sterile room-temperature PBS contain-ing 0.6% ACD-A or 2 mMEDTA.
2. Slowly layer 35 mL of diluted cord blood over 12 mL of Ficoll-Paque in a 50-mL polypropylene tube.
3. Centrifuge at 20°C at 375gfor 30 min in a swinging bucket rotor.
4. Aspirate off the top clear layer down to the mononuclear layer (termed the buffy coat, a thin white layer at the interface).
5. Using a 10-mL pipet, remove the buffy coat and place in a separate 50-mL tube (filling each tube to 20 mL).
6. Bring each tube up to 50 mL with room-temperature PBS containing 0.6% ACD-A or 2 mMEDTA, and centrifuge at 20°C at 375gfor 15 min.
7. Resuspend cells in 10 mL of erythrocyte lysing solution (mixing well), then bring the volume up to 50 mL with erythrocyte lysing solution.
8. Let sit for 10 min at room temperature, then centrifuge at 20°C at 375gfor 15 min. 9. Wash cells in 20 mL of room-temperature PBS, centrifuge at 375gfor 15 min,
then resuspend in prewarmed medium (seeNotes 3and4).
10. (Optional) Enrich for CD34+mononuclear cells by super paramagnetic microbead
selection using the VarioMACS CD34 progenitor cell isolation kit, according to the manufacturer’s instructions (seeNote 5).
3.2. Staining of Cells With Hoechst 33342
The Hoechst 33342 SP fluorescence pattern is highly dependent on the following variables: cell concentration, dye concentration, staining tempera-ture, and staining time. The procedures described below have been success-fully used to stain mouse bone marrow and human cord blood cells resuspended at 1 × 10⁶ cells/mL (see Note 6). It is important to keep the sample protected from light throughout the staining procedure and during analysis (see Note 7).
1. Designate a water bath set at 37°C (seeNote 8). Prewarm medium at 37°C. 2. Count nucleated cells, and resuspend at 1 × 10⁶ cells/mL in medium (see
Notes 9–11).
3. To the cell suspension, add the Hoechst 33342 stock solution to obtain a final concentration of 5 µg/mL.
4. Transfer the cell/dye suspension to a tube suitable for submersion in the water bath. For a volume of 1–3 mL, use a 5-mL tube. For a volume of 4–10 mL, use a 15-mL tube. For larger volumes, use 50-mL tubes. Make certain that the top level of the cell suspension is totally submerged under water in the bath. This will ensure that the 37°C temperature will be maintained throughout the sample (seeNote 8).
5. Allow the sample to remain in the water bath for 90 min. Gently invert the tube every 20 min to discourage cell settling and clumping.
6. After the 90-min incubation, centrifuge the cells at 375gfor 6 min at 4°C (in a pre-cooled rotor), and resuspend in an appropriate volume of cold buffer. Important:
To inhibit further dye efflux, the cells must remain at 4°C for the remainder of the experiment.
7. (Optional) If the SP assay is combined with staining for cell surface antigens, the cells can now be processed for antibody staining (seeNote 12). The cell suspen-sion should be maintained at 4°C at all times.
8. If desired, add PI to a final concentration of 2 µg/mL for dead cell discrimination immediately prior to flow cytometry.
3.3. Flow Cytometric Detection of SP Cells
The excitation maximum of Hoechst 33342 is 346 nm. Therefore, the flow cytometer should be equipped with a laser that provides excitation in the UV range for optimal sensitivity of the SP assay. When the assay is combined with antibody staining, other excitation wavelengths are also required (seeNote 13).
1. Install the 450/20 BP filter for Hoechst Blue detection, the 675 LP filter for Hoechst Red detection, and the 610 shortpass dichroic mirror for separation of Blue and Red signals (seeNotes 14and15).
2. PI fluorescence generated from UV excitation will be captured by the 675 LP filter as well. However, the high fluorescence intensity signals produced by PI-positive dead cells can be easily discriminated from Hoechst Red-positive signals produced by live cells.
3. Create the following two-parameter plots (x-axis vs y-axis) with all of the para-meters in linear scale:
a. Forward scatter (FSC) vs side scatter (SSC). b. Hoechst Red vs Hoechst Blue.
4. Keep the sample cold and protected from light during analysis (seeNote 7). 5. Run sample while viewing the FSC vs SSC plot. Adjust voltages of both
para-meters until all of the cells are captured on the dot-plot.
6. Adjust voltages of Hoechst Red and Hoechst Blue parameters until the cells stained brightly for Hoechst 33342 are visible on the dot-plot. Continue to increase voltages until the cells stained weakly for Hoechst 33342 are visible on the lower left side of the plot.
7. Acquire 100,000–500,000 events (seeNote 16).
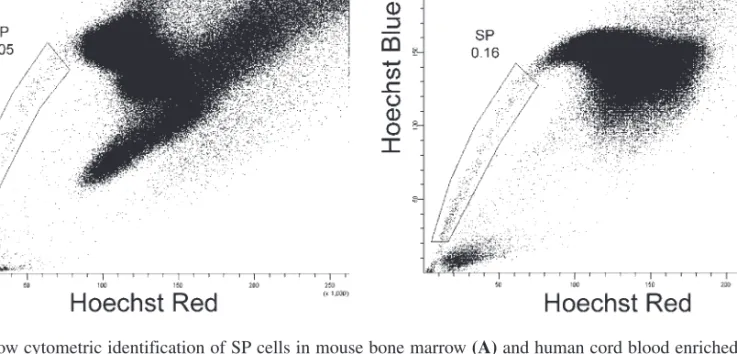
8. Use a nonrectilinear marker to delineate the SP population on the Hoechst Red vs. Hoechst Blue plot. SP cells constitute a discrete population on the left side of the plot, indicating low fluorescence intensity at both emission wavelengths (Fig. 1).
3.4. Immunophenotypic and Functional Characterization of SP Cells
3.4.1. Expression of HSC Surface Antigens on SP Cells Derived From Mouse Bone Marrow Cells
In vivo studies have shown that the fraction of mouse bone marrow cells that reconstitute the hematopoietic system of lethally irradiated recipients express c-Kit and Sca-1, but lack expression of lineage-specific cell surface antigens(26,27). Demonstrating that c-Kit+Lin–Sca-1+(KLS) cells were highly enriched in the SP region confirmed the utility of the SP assay in enriching for HSCs in mouse bone marrow (16,17,21)(Fig. 2).
Recently, violet laser diodes providing 15–30 mW of 405/407/408 nm exci-tation (exact wavelength depends on the manufacturer of the laser) have become commercially available (seeChapter 23 on small lasers by Telford,this volume). They can be purchased as options on some models of new flow cytometers, or retrofitted onto existing flow cytometers. For some applications, they promise to be attractive alternatives to cumbersome lasers providing UV excitation (41). To determine the feasibility of performing the SP assay with violet excitation, we compared UV (8 mW of 325 nm provided by a helium–cadmium (He–Cd) laser on an analyzer with cuvette flow cell) and violet (100 mW of 407 nm
pro-168
Fig. 1. Flow cytometric identification of SP cells in mouse bone marrow (A)and human cord blood enriched for CD34+
cells(B). Cells were stained with 5 µg/mL of Hoechst 33342 at 37°C for 90 min. Samples were analyzed on a FACSVan-tage SE/FACSDiVa (BD Biosciences) equipped with an Innova 302C krypton–ion laser (Coherent Inc., Santa Clara, CA) pro-viding 30 mW of UV (351–356 nm) excitation. Five hundred thousand events were collected. Observation of Hoechst 33342 fluorescence at its blue emission wavelength (with a 450/20 BP filter) and red emission wavelength (with a 675 LP filter) simultaneously on a Hoechst Blue (y-axis) vs Hoechst Red (x-axis) dot-plot revealed a discrete population of cells on the lower left side of the plot. SP cells were identified by low fluorescence at both wavelengths.
vided by a krypton-ion laser on a stream-in-air cell sorter) excitation of C57BL/6 bone marrow cells stained with Hoechst 33342 (seeFig. 3E,G, respectively). To confirm the identity of cells falling into the SP region as candidate HSCs, fluorochrome-conjugated antibodies to c-Kit and Sca-1 were combined with the assay. As shown in Fig. 4, the majority of the SP cells identified by violet excitation coexpressed c-Kit and Sca-1. Even though it is feasible to perform the SP assay with violet excitation, relatively high laser power is required to produce discernible SP profiles of slightly lower resolution than those gener-ated by the standard method (compare Fig. 3GtoFig. 1A). Violet laser diodes providing 15–30 mW power output in a stream-in-air system will not be able to achieve resolution of the SP profile. However, a cuvet flow cell coupled with sensitive detection optics may bode well for the violet laser diode on that platform.
3.4.2. Engraftment of Human Cord Blood SP Cells in NOD/SCID Mice
We isolated human cord blood-derived CD34+ SP cells by fluorescence-activated cell sorting and injected them intravenously into sublethally irradi-ated NOD/SCID mice at 103–104 or 104–105 cells per mouse. Twelve weeks after transplantation, the mice were euthanized and the bone marrow cells
col-Fig. 2. Correlation of the SP phenotype with expression of HSC surface antigens in mouse bone marrow cells using UV excitation. Cells were stained with Hoechst 33342 alone(left), or in combination with antibodies against c-Kit, a cocktail of lineage-specific markers and Sca-1 (right). Samples were analyzed on a FACSVantage SE equipped with an Enterprise IIC laser (Coherent Inc.) providing 30 mW of 351–364 nm excitation. Five hundred thousand events were collected. KLS (c-Kit+Lin–Sca-1+) cells
were highly enriched in the SP region. (Reproduced by permission of AlphaMed Press fromref.16.)
lected for flow cytometric analysis. Human cells could be consistently detected in the mouse bone marrow for cell doses above 104(Fig. 5), demonstrating the presence of SRC in the CD34+SP population.
3.4.3. Hoechst 33342 Efflux by SP Cells
Suppression of the SP phenotype can be achieved by disruption of ABC transporter function. It can be accomplished by depletion of ATP with 2-deoxyglucose and sodium azide, or addition of specific transporter inhibitors. Verapamil, an inhibitor of P-glycoprotein/Mdr1, appears to be effective in diminishing the SP phenotype in mouse bone marrow cells (Fig. 6B and see
Note 17). FTC, an inhibitor of ABCG2/Bcrp1 (but not P-glycoprotein), is also effective in mouse bone marrow cells (Fig. 6C), and demonstrates suppression of the SP phenotype in A549 human lung carcinoma cells which express a high level of ABCG2 (24) (Fig. 3B). Reserpine, which is a functional inhibitor of several ABC transporters, including P-glycoprotein and ABCG2, can also be used. Examples of effective inhibitor concentrations are listed in Note 18, but may need to be altered depending on cell type. The inhibitors can be used 15 min prior to Hoechst 33342 addition to the sample (preinhibition) or con-comitant with Hoechst 33342 (coinhibition). Published protocols vary with respect to this step; however, we have obtained good results with coinhibition.
4. Notes
1. The original publication on SP cells employed 50–100 mW of UV at 350 nm for the excitation of Hoechst 33342. It was performed on a stream-in-air cell sorter using a water-cooled argon-ion laser. We have determined that if the detection system is sensitive, SP profiles can be resolved even at low laser power and suboptimal exci-tation wavelength. Detection in a cuvet flow cell using 8 mW of UV exciexci-tation at 325 nm from an air-cooled Kimmon IK Series He–Cd laser on a BD LSR analyzer Fig. 3. (see facing page)Direct correlation of ABCG2 activity and the SP pheno-type. A549 human lung carcinoma cells, expressing high levels of ABCG2, were stained with 5 µg/mL of Hoechst 33342 at 37°C for 90 min, in the absence (A,C)or presence(B,D)of 1 µMFTC. Samples were analyzed on a BD LSR with 8 mW of UV excitation(A,B), and on a FACSVantage SE/FACSDiVa with 50 mW of violet excita-tion (C,D). One hundred thousand events were collected. As previously reported by Scharenberg et al. (24), FTC reduced the number of cells within the SP region by inhibiting ABCG2 efflux activity. C57BL/6 mouse bone marrow cells were stained with Hoechst 33342 in the absence (E,G) or presence (F,H)of 1 µMFTC. Samples were analyzed on a BD LSR with 8 mW of UV excitation (E,F), and on a FACSVan-tage SE/FACSDiVa with 100 mW of violet excitation (G,H). Four hundred thousand live (PI-negative) cells were analyzed. FTC reduced the number of the cells within the SP region.
172
(BD Biosciences, San Jose, CA) successfully generates SP profiles, even though excitation of Hoechst 33342 at this wavelength is approx 56% of that intensity expected from equivalent power at 350 nm. In addition to the He–Cd laser, the BD LSR is equipped with a Spectra-Physics 163 argon-ion laser providing 488-nm excitation at 20 mW. Excitation with 488 nm produces FSC signal, SSC signal, and four fluorescence signals. The detectors for the four fluorescence signals are desig-nated as FL1, FL2, FL3, and FL6. Fluorescence signals generated by UV excitation are normally collected in FL4 and FL5. For SP analysis, the BD LSR optical bench is reconfigured to collect Hoechst Red fluorescence emission in FL3 with a modi-fied pinhole assembly that permits detection of the signal generated by UV excita-tion. The standard 670-nm LP filter is left in front of the FL3 detector. Hoechst Blue fluorescence emission is collected in FL5 with the 424/44-nm BP filter. The standard steering optics mounted on the BD LSR are left in place. Linear signals from both blue and red fluorescence channels are used to produce typical histograms for identification of SP cells. We also have evidence indicating that at 407 nm exci-tation (using 100 mW of laser power on a stream-in-air cell sorter), Hoechst Blue and Red fluorescence can still be detected (see Subheading 3.4.1.). High laser power is necessary, however, to compensate for the diminished excitation of Hoechst 33342 at 405–408 nm (2–3% of maximum).
2. When flushing the femur, use a 21-gage needle and a 5-mL syringe. A smaller needle (e.g., 27-gage) may sometimes be required when flushing the tibia. Repeat if desired, but use fresh buffer each time. Avoid passing the cell suspension repeat-edly through the needle (this may cause cell shearing). Processing both the tibias and femurs from a single mouse will yield 2–8 ×10⁷cells. This number will vary
from strain to strain.
3. Same-day staining is recommended. However, if cells are to be stained the next day, they can be stored in medium at 4°C. Following overnight incubation, PI should be included in the assay to evaluate cell viability.
4. Although an advantage of the SP assay is that it is independent of cell surface characteristics, in some instances it may be desirable to include a preenrichment Fig. 4. (see facing page) Correlation of the SP phenotype with expression of HSC surface antigens in mouse bone marrow cells using violet excitation. Cells were stained with Hoechst 33342 alone (A–C), or in combination with c-Kit-PE-Cy5 and Sca-1-PE
(D–F). Samples were analyzed on a FACSVantage SE/FACSDiVa equipped with an Innova 302C krypton-ion laser providing 100 mW of 407 nm excitation. Optical filter configuration was the same as described in Fig. 1(seealsoNotes 1,12, and13). Five hundred thousand events were collected. For the Hoechst 33342/c-Kit/Sca-1 sample, the Hoechst 33342 staining profile is shown in (D), and the cell surface antigen staining profile is displayed as c-Kit (y-axis) vs Sca-1 (x-axis), with the region KS defining coexpression of both antigens (E). When cells within the SP region were displayed on a c-Kit vs Sca-1 plot, the majority showed coexpression of both c-Kit and Sca-1 (F). The sample stained with Hoechst 33342 alone served as a control (A–C).
step that removes cells expressing certain lineage-specific antigens (e.g., those found on natural killer cells and erythroblasts, which express relatively high levels of ABCG2/Bcrp1 [19,24]). In these cases, commercial kits based on negative depletion may be used prior to Hoechst 33342 staining. Alternatively, positive selection for cells expressing hematopoietic stem/progenitor cell markers (such as CD34 or CD133 for human cord blood cells) may be used (23).
5. In the experiments presented in Fig. 5, the cord blood mononuclear cells were enriched for cells expressing the CD34 surface antigen prior to Hoechst 33342 staining and SP cell sorting (seeSubheading 3.4.2.).
6. Staining conditions that have been used to detect hematopoietic SP cells in: a. Mouse bone marrow: 5 µg/mL of Hoechst 33342 at 37°C for 90 min at 1 ×10⁶
cells/mL(17).
b. Human fetal liver: 5 µg/mL of Hoechst 33342 at 37°C for 90 min at 1 ×10⁶
cells/mL(23).
c. Human cord blood: 2.5 µg/mL of Hoechst 33342 at 37°C for 90 min at 1 ×10⁶
cells/mL (22); in our laboratory, however, 5 µg/mL gave slightly better resolution.
d. Human bone marrow: 5 µg/mL of Hoechst 33342 at 37°C for 120 min at 1 ×10⁶
cells/mL(21).
e. Human peripheral blood (Lin– CD34–cell population): 5 µg/mL of Hoechst
33342 at 37°C for 120 min (25).
f. A549 human lung carcinoma cell line (positive control): 5 µg/mL of Hoechst 33342 at 37°C for 45 min at 0.5–1 ×10⁶cells/mL; cells were washed and then
174 Eaker et al.
Fig. 5. Engraftment of NOD/SCID mice with CD34+human cord blood SP cells. SP
cells were isolated from CD34+human cord blood cells by fluorescence-activated cell
sorting and transplanted into sublethally irradiated (250 cGy) 8-wk-old NOD/SCID mice via tail vein injections. Bone marrow cells were analyzed at 12 wk post-injection after staining with an antihuman CD45-APC antibody. Two cell doses, ranging from 103–104 and from 104–105 cells, were injected. Human engraftment percentages are
Fig. 6. Reduction of SP cells by inhibitors of ABC transporter activity. Mouse bone marrow cells were stained with Hoechst 33342 alone (A)and in the presence of 50 µMverapamil(B)or 1 µMFTC(C). Dead cells were identified by the uptake of PI and excluded from analyses. Samples were analyzed on a BD LSR equipped with a He–Cd laser providing 8 mW of UV (325 nm) excitation. Hoechst 33342 fluorescence was monitored simultaneously with a 424/44 BP filter and a 670 LP filter. One hundred thousand live cells were analyzed. The number of SP cells was reduced in the presence of verapamil (an inhibitor of P-glyco-protein/Mdr1 activity) or FTC (an inhibitor of ABCG2/Bcrp1 activity).
incubated an additional 45 min in the absence of Hoechst 33342 (poststaining efflux period) (24).
7. Although Hoechst 33342 is a vital dye, it is not without cytotoxic effects, espe-cially in proliferating cells. It induces DNA single-strand breaks, which increase significantly following exposure to UV light (33–35). Caution is therefore war-ranted when performing functional studies with sorted non-SP cells that still retain the dye. As a preventative measure, the water bath should be covered (e.g., with a cardboard box) to minimize exposure of the cells to light while the staining is in progress, and the stained samples kept in the dark prior to analysis.
8. It is important that the temperature of the water bath is maintained at 37°C. There-fore, to prevent temperature fluctuations, use a dedicated water bath and avoid the addition of other items during the staining procedure.
9. Lysing erythrocytes will aid in the accurate determination of nucleated cell number. If erythrocyte lysis has not been performed during sample preparation, take a small aliquot of the sample, resuspend in erythrocyte-lysing solution and allow to stand at room temperature for 10 min. Count nucleated cells.
10. Volumes less than 1 mL (1 ×10⁶cells) are difficult to process. If a smaller volume
is required, process positive controls in parallel.
11. If freshly thawed cells are used, incubate the thawed cells in medium for 30 min before adding the dye. This will allow the cells to equilibrate with the media prior to staining.
12. (Optional) In the case of mouse bone marrow cells, the SP phenotype correlates with the KLS (c-Kit+Lin–Sca-1+) phenotype. An example of antibody combinations
for KLS cell detection is: lineage cocktail-FITC, Sca-1-PE, and c-Kit-PE-Cy5. 13. (Optional) If the fluorochrome-conjugated antibodies suggested in Note 12are
used in combination with the SP assay, the flow cytometer should also be equipped with: excitation wavelength at 488 nm; detection filters including 488/10 BP filters for FSC and SSC detection, 530/30 BP filter for FITC detection, 575/26 BP filter for PE detection, and 675/20 BP filter for PE–Cy5 detection.
14. The peak emission wavelength of Hoechst 33342 is 460 nm. Red-shifted fluores-cence of Hoechst 33342 and related bis-benzimidazole dyes is thought to be due to different types of dye-binding interactions with DNA (36–40). Some standard filters that are supplied with commercial flow cytometers have been successfully used for the SP assay: 424/44 BP filter for Hoechst Blue detection and 670 LP filter for Hoechst Red detection. Dichroic mirrors that have been successfully used include 570 LP, 640 LP, and 670 LP.
15. If the UV laser is not the primary laser, triggering may be achieved with the laser providing the primary excitation wavelength (such as 488 nm). In this case, band-pass filters of the excitation wavelength (such as 488/10 BP) will need to be installed in front of the FSC and SSC detectors.
16. When the percentage of SP cells is low, recording only events of interest with a live gate will aid in their detection. If PI is not included as a live/dead cell dis-criminator, a live gate can be drawn on the FSC vs SSC plot by excluding debris and most of the erythrocytes (if present). If PI is included, a live gate can be
drawn on the Hoechst Red vs Hoechst Blue plot by excluding erythrocytes (events at the lower left corner) and dead cells (events accumulated as a vertical line on the far right).
17. Many inhibitors are substrates for more than one ABC transporter as well as for other enzyme systems. Thus, a high concentration of an inhibitor, even in the absence of overt toxicity, may have unpredictable effects on cellular metabo-lism (42). This may explain why 50 µM verapamil, a P-glycoprotein/Mdr1 inhibitor, is effective in diminishing the SP profile in mouse bone marrow cells even though ABCG2/Bcrp1 has been reported to be the major determinant of the SP phenotype (19).
18. Recommended concentrations of inhibitors of ABC transporters: a. Verapamil, 50 µM(5 mMstock solution in distilled water) (17). b. FTC, 1–10 µM(10 mMstock solution in DMSO) (24).
c. Reserpine, 5 µM(5 mMstock solution in DMSO) (19). d. 2-Deoxyglucose, 50 mM; sodium azide, 15 mM(19).
Acknowledgments
This work was supported in part by National Institutes of Health Grants R01 HL65519 and R01 HL66305 (to R. G. H.). We thank Rick Fishel (BD Biosciences) for assistance in reconfiguring the BD LSR, and Rob Robey and Susan Bates for fumitremorgin C.
References
1. Ramos, C. A., Venezia, T. A., Camargo, F. A., and Goodell, M. A. (2003) Tech-niques for the study of adult stem cells. Biotechniques34,572–591.
2. Guo, Y., Lubbert, M., and Engelhardt, M. (2003) CD34(–) hematopoietic stem cells: current concepts and controversies. Stem Cells21,15–20.
3. Visser, J. W., Bol, S. J., and van den Engh, G. (1981) Characterization and enrich-ment of murine hemopoietic stem cells by fluorescence activated cell sorting. Exp. Hematol.9,644–655.
4. Bertoncello, I., Hodgson, G. S., and Bradley, T. R. (1985) Multiparameter analysis of transplantable hemopoietic stem cells: I. The separation and enrichment of stem cells homing to marrow and spleen on the basis of rhodamine-123 fluorescence. Exp. Hematol.13,999–1006.
5. Wolf, N. S., Kone, A., Priestley, G. V., and Bartelmez, S. H. (1993) In vivo and in vitro characterization of long-term repopulating primitive hematopoietic cells iso-lated by sequential Hoechst 33342-rhodamine 123 FACS selection. Exp. Hematol.
21,614–622.
6. Leemhuis, T., Yoder, M. C., Grigsby, S., Aguero, B., Eder, P., and Srour, E. F. (1996) Isolation of primitive human bone marrow hematopoietic progenitor cells using Hoechst 33342 and Rhodamine 123. Exp. Hematol.24,1215–1224. 7. Jones, R. J., Barber, J. P., Vala, M. S., et al. (1995) Assessment of aldehyde
8. Storms, R. W., Trujillo, A. P., Springer, J. B., et al. (1999) Isolation of primitive human hematopoietic progenitors on the basis of aldehyde dehydrogenase activity.
Proc. Natl. Acad. Sci. USA96,9118–9123.
9. Arndt-Jovin, D. J. and Jovin, T. M. (1977) Analysis and sorting of living cells according to deoxyribonucleic acid content. J. Histochem. Cytochem. 25,
585–589.
10. Johnson, L. V., Walsh, M. L., and Chen, L. B. (1980) Localization of mitochondria in living cells with rhodamine 123. Proc. Natl. Acad. Sci. USA77,990–994. 11. Darzynkiewicz, Z., Staiano-Coico, L., and Melamed, M. R. (1981) Increased
mito-chondrial uptake of rhodamine 123 during lymphocyte stimulation. Proc. Natl. Acad. Sci. USA78,2383–2387.
12. Juliano, R. L. and Ling, V. (1976) A surface glycoprotein modulating drug per-meability in Chinese hamster ovary cell mutants. Biochim. Biophys. Acta455,
152–162.
13. Lalande, M. E., Ling, V., and Miller, R. G. (1981) Hoechst 33342 dye uptake as a probe of membrane permeability changes in mammalian cells. Proc. Natl. Acad. Sci. USA78,363–367.
14. Neyfakh, A. A. (1988) Use of fluorescent dyes as molecular probes for the study of multidrug resistance. Exp. Cell Res.174,168–176.
15. Chaudhary, P. M. and Roninson, I. B. (1991) Expression and activity of P-glycoprotein, a multidrug efflux pump, in human hematopoietic stem cells.
Cell66,85–94.
16. Bunting, K. D. (2002) ABC transporters as phenotypic markers and functional reg-ulators of stem cells. Stem Cells20,11–20.
17. Goodell, M. A., Brose, K., Paradis, G., Conner, A. S., and Mulligan, R. C. (1996) Isolation and functional properties of murine hematopoietic stem cells that are replicating in vivo. J. Exp. Med.183,1797–1806.
18. Bunting, K. D., Zhou, S., Lu, T., and Sorrentino, B. P. (2000) Enforced P-glycoprotein pump function in murine bone marrow cells results in expansion of side population stem cells in vitro and repopulating cells in vivo. Blood 96,
902–909.
19. Zhou, S., Schuetz, J. D., Bunting, K. D., et al. (2001) The ABC transporter Bcrp1/ABCG2 is expressed in a wide variety of stem cells and is the molecular determinant of the side-population phenotype. Nat. Med.7,1028–1034.
20. Zhou, S., Morris, J. J., Barnes, Y., Lan, L., Schuetz, J. D., and Sorrentino, B. P. (2002) Bcrp1 gene expression is required for normal numbers of side population stem cells in mice, and confers relative protection to mitoxantrone in hematopoi-etic cells in vivo. Proc. Natl. Acad. Sci. USA99,12,339–12,344.
21. Goodell, M. A., Rosenzweig, M., Kim, H., et al. (1997) Dye efflux studies suggest that hematopoietic stem cells expressing low or undetectable levels of CD34 anti-gen exist in multiple species. Nat. Med.3,1337–1345.
22. Storms, R. W., Goodell, M. A., Fisher, A., Mulligan, R. C., and Smith, C. (2000) Hoechst dye efflux reveals a novel CD7+CD34– lymphoid progenitor in human umbilical cord blood. Blood96,2125–2133.
23. Uchida, N., Fujisaki, T., Eaves, A. C., and Eaves, C. J. (2001) Transplantable hematopoietic stem cells in human fetal liver have a CD34+ side population (SP) phenotype.J. Clin. Invest.108,1071–1077.
24. Scharenberg, C. W., Harkey, M. A., and Torok-Storb, B. (2002) The ABCG2 trans-porter is an effecient Hoechst 33342 efflux pump and is preferentially expressed by immature human hematopoietic progenitors. Blood99,507–512.
25. Preffer, F. I., Dombkowski, D., Sykes, M., Scadden, D., and Yang, Y.-G. (2002) Lineage-negative side-population (SP) cells with restricted hematopoietic capacity circulate in normal human adult blood: immunophenotype and functional charac-terization.Stem Cells20,417–427.
26. Riz, I., Eaker, S., and Hawley, R. G. (2002) Genomic biology of hematopoietic stem cells: perspectives and promise for advanced therapeutics. Appl. Genom. Proteom.1,
95–108.
27. Bunting, K. D. and Hawley, R. G. (2002) The Tao of hematopoietic stem cells: toward a unified theory of tissue regeneration? Sci. World J.2,983–995.
28. Abramson, S., Miller, R.G., and Phillips, R.A. (1977) The identification in adult bone marrow of pluripotent and restricted stem cells of the myeloid and lymphoid systems.J. Exp. Med.145,1567–1579.
29. Capel, B., Hawley, R. G., and Mintz, B. (1990) Long- and short-lived murine hematopoietic stem cell clones individually identified with retroviral integration markers. Blood75,2267–2270.
30. Stewart, A. K., Dubé, I. D., and Hawley, R. G. (1999) Gene marking and the biology of hematopoietic cell transfer in human clinical trials, in Hematopoiesis and Gene Therapy, Blood Cell Biochemistry, Vol. 8 (Fairbairn, L. J. and Testa, N., eds.), Kluwer Academic/Plenum Publishers, New York, pp. 243–268.
31. Bhatia, M., Wang, J. C. Y., Kapp, U., Bonnet, D., and Dick, J. E. (1997) Purification of primitive human hematopoietic cells capable of repopulating immune-deficient mice.Proc. Natl. Acad. Sci. USA94,5320–5325.
32. Guenechea, G., Gan, O. I., Dorrell, C., and Dick, J. E. (2001) Distinct classes of human stem cells that differ in proliferative and self-renewal potential. Nat. Immunol.2,75–82.
33. Van Zant, G. and Fry, C. G. (1983) Hoechst 33342 staining of mouse bone marrow: effects on colony-forming cells. Cytometry4,40–46.
34. Siemann, D. W. and Keng, P. C. (1986) Cell cycle specific toxicity of the Hoechst 33342 stain in untreated or irradiated murine tumor cells. Cancer Res.46,3556–3559. 35. Erba, E., Ubezio, P., Broggini, M., Ponti, M., and D’Incalci, M. (1988) DNA damage, cytotoxic effect and cell-cycle perturbation of Hoechst 33342 on L1210 cells in vitro. Cytometry9,1–6.
36. Latt, S. A. and Stetten, G. (1976) Spectral studies on 33258 Hoechst and related bisbenzimidazole dyes useful for fluorescent detection of deoxyribonucleic acid synthesis.J. Histochem. Cytochem.24,24–33.
37. Watson, J. V., Nakeff, A., Chambers, S. H., and Smith, P. J. (1985) Flow cytomet-ric fluorescence emission spectrum analysis of Hoechst-33342-stained DNA in chicken thymocytes. Cytometry6,310–315.
38. Ellwart, J. W. and Dormer, P. (1990) Vitality measurement using spectrum shift in Hoechst 33342 stained cells. Cytometry11,239–243.
39. Belloc, F., Dumain, P., Boisseau, M. R., et al. (1994) A flow cytometric method using Hoechst 33342 and propidium iodide for simultaneous cell cycle analysis and apoptosis determination in unfixed cells. Cytometry17,59–65.
40. Chiu, L., Cherwinski, H., Ransom, J., and Dunne, J. F. (1996) Flow cytometric ratio analysis of the Hoechst 33342 emission spectrum: multiparametric charac-terization of apoptotic lymphocytes. J. Immunol. Methods189,157–171.
41. Telford, W. G., Hawley, T. S., and Hawley, R. G. (2003) Analysis of violet-excited fluorochromes by flow cytometry using a violet laser diode. Cytometry 54A,
48–55.
42. Thomas, H. and Coley, H.M. (2003) Overcoming multidrug resistance in cancer: an update on the clinical strategy of inhibiting P-glycoprotein. Cancer Control10,
159–165.