University of Nebraska - Lincoln
DigitalCommons@University of Nebraska - Lincoln
Roman L. Hruska U.S. Meat Animal Research
Center
U.S. Department of Agriculture: Agricultural
Research Service, Lincoln, Nebraska
2011
Birth and weaning traits in crossbred cattle from
Hereford, Angus, Brahman, Boran, Tuli, and
Belgian Blue sires
E. Casas
USDA, ARS, US Meat Animal Research Center, eduardo.casas@ars.usda.gov
R. M. Thallman
USDA-ARS Meat Animal Research Center, Mark.Thallman@ars.usda.gov
L. V. Cundiff
US Meat Animal Research Center, Larry.Cundiff@ars.usda.gov
Follow this and additional works at:
http://digitalcommons.unl.edu/hruskareports
This Article is brought to you for free and open access by the U.S. Department of Agriculture: Agricultural Research Service, Lincoln, Nebraska at DigitalCommons@University of Nebraska - Lincoln. It has been accepted for inclusion in Roman L. Hruska U.S. Meat Animal Research Center by an authorized administrator of DigitalCommons@University of Nebraska - Lincoln.
Casas, E.; Thallman, R. M.; and Cundiff, L. V., "Birth and weaning traits in crossbred cattle from Hereford, Angus, Brahman, Boran, Tuli, and Belgian Blue sires" (2011).Roman L. Hruska U.S. Meat Animal Research Center. 376.
ABSTRACT: The objective of this study was to char-acterize breeds representing diverse biological types for birth and weaning traits in crossbred cattle. Gestation length, calving difficulty, percentage of unassisted calv-ing, percentage of perinatal survival, percentage of sur-vival from birth to weaning, birth weight, BW at 200 d, and ADG were measured in 2,500 calves born and 2,395 calves weaned. Calves were obtained by mating Hereford, Angus, and MARC III (one-fourth Hereford, one-fourth Angus, one-fourth Pinzgauer, and one-fourth Red Poll) mature cows to Hereford or Angus (British breed), Brahman, Tuli, Boran, and Belgian Blue sires. Calves were born during the spring seasons of 1992, 1993, and 1994. Sire breed was significant for all traits
(P < 0.002). Offspring from British breeds and the
Bel-gian Blue breed had the shortest gestation length (285 d) when compared with progeny from other sire breeds (average of 291 d). Calving difficulty was greater in off-spring from Brahman sires (1.24), whereas the offoff-spring of Tuli sires had the least amount of calving difficulty (1.00). Offspring from all sire breeds had similar
perina-tal survival and survival from birth to weaning (average of 97.2 and 96.2%, respectively), with the exception of offspring from Brahman sires, which had less (92.8 and 90.4%, respectively). Progeny of Brahman sires were heaviest at birth (45.7 kg), followed by offspring from British breed, Boran, and Belgian Blue sires (average of 42.4 kg). The lightest offspring at birth were from Tuli sires (38.6 kg). Progeny derived from Brahman sires were the heaviest at 200 d (246 kg), and they grew faster (1.00 kg/d) than offspring from any other group. The progeny of British breeds and the Belgian Blue breed had an intermediate BW at 200 d (238 kg) and an intermediate ADG (average of 0.98 kg/d). The progeny of Boran and Tuli sires were the lightest at 200 d (227 kg) and had the least ADG (0.93 kg/d). Male calves had a longer gestation length, had a great-er incidence of calving difficulty, had greatgreat-er mortality to weaning, were heavier, and grew faster than female calves. Sire breed effects can be optimized by selection and use of appropriate crossbreeding systems.
Key words: beef cattle, breed, germplasm, gestation length, growth, survival
©2011 American Society of Animal Science. All rights reserved. J. Anim. Sci. 2011. 89:979–987 doi:10.2527/jas.2010-3142
INTRODUCTION
The Germplasm Evaluation (GPE) program at the
US Meat Animal Research Center (USMARC) has
characterized breeds representing several biological types of cattle. Breed differences in performance char-acteristics are important genetic resources for
improv-ing the efficiency of beef production. Diverse breeds can be crossed to exploit heterosis or to match genetic potential with markets, feed resources, and climates. Reproduction rate, weaning weight per cow exposed,
and cow efficiency are outstanding in Bos indicus ×
Bos taurus F1 crosses, especially in subtropical
envi-ronments (Olson et al., 1991; Thrift and Thrift, 2003), but their advantages are tempered by older age at pu-berty and reduced meat tenderness as the proportion of B. indicus increases (Crouse et al., 1989). Concerns about reproduction rate at young ages and meat qual-ity prompted the introduction and evaluation of other tropically adapted germplasm into the GPE program and in research efforts at research stations in subtropi-cal regions of the United States, as in Texas (Herring et al., 1996; Holloway et al., 2002) and Florida (Chase et al., 2000, 2004).
In the GPE program, birth and weaning traits have been evaluated for Cycles I (Smith et al., 1976), II
Birth and weaning traits in crossbred cattle from Hereford, Angus,
Brahman, Boran, Tuli, and Belgian Blue sires
1,2E. Casas,
3R. M. Thallman, and L. V. Cundiff
US Meat Animal Research Center, USDA, ARS, Clay Center, NE 68933
1 Mention of trade name, proprietary product, or specified equip-ment does not constitute a guarantee or warranty by the USDA and does not imply approval to the exclusion of other products that may be suitable. The USDA is an equal opportunity provider and employer.
2 The authors thank D. Light [US Meat Animal Research Center (USMARC)] for technical assistance, the USMARC staff for out-standing husbandry and animal care, and J. Watts (USMARC) for secretarial support.
3 Corresponding author: Eduardo.Casas@ars.usda.gov Received May 7, 2010.
Accepted December 2, 2010.
979
This document is a U.S. government work and is not subject to copyright in the United States.
(Gregory et al., 1978), III (Gregory et al., 1979), and IV (Cundiff et al., 1998). The fifth cycle of this
pro-gram (Cycle V) included 2 B. indicus breeds (Brahman
and Boran), 1 African Sanga breed (Tuli), 2 British breeds (Hereford and Angus), and Belgian Blue, which has a high frequency of the condition known as double muscling. The objective of this study was to character-ize breeds representing diverse biological types for birth and weaning traits in crossbred cattle.
MATERIALS AND METHODS
Experimental procedures were approved and per-formed in accordance with USMARC Animal Care Guidelines and the Guide for the Care and Use of Ag-ricultural Animals in AgAg-ricultural Research and Teach-ing (FASS, 1999).
Animals
Data were obtained from 2,500 calves born and 2,395 calves weaned at the USMARC. Hereford, Angus, and MARC III (one-fourth Hereford, one-fourth Angus, one-fourth Pinzgauer, and one-fourth Red Poll) mature dams (5 to 11 yr of age) were mated by AI to 31 Her-eford, 43 Angus, 47 Brahman, 8 Boran, 9 Tuli, and 25 Belgian Blue sires. No purebred Hereford or Angus matings were made to avoid confounding sire breed ef-fects with heterosis efef-fects. Hereford and Angus were treated as 1 sire breed (British).
Dams were maintained on improved pasture from April to November. In April to June and later in Sep-tember to November, they were maintained on
predom-inantly cool-season smooth bromegrass (Bromus
iner-mis). In June to September, they were maintained on
warm-season mixtures of predominantly big bluestem (Andropogon gerardii), switchgrass (Panicum virgatum),
and Indiangrass (Sorghastrum nutans), with some little
bluestem (Schizachyrium scoparium), sideoats grama
(Bouteloua curtipendula), and sand lovegrass ( Eragros-tis trichodes). From December to April, the dams were fed grass and alfalfa hay (or corn silage and alfalfa hay) on pasture. Cows were observed closely for calving
diffi-culty. Briefly, during calving season (February to May), cows were monitored once every hour for 24 h/d. As-sistance was given if cows were in labor for 2 h.
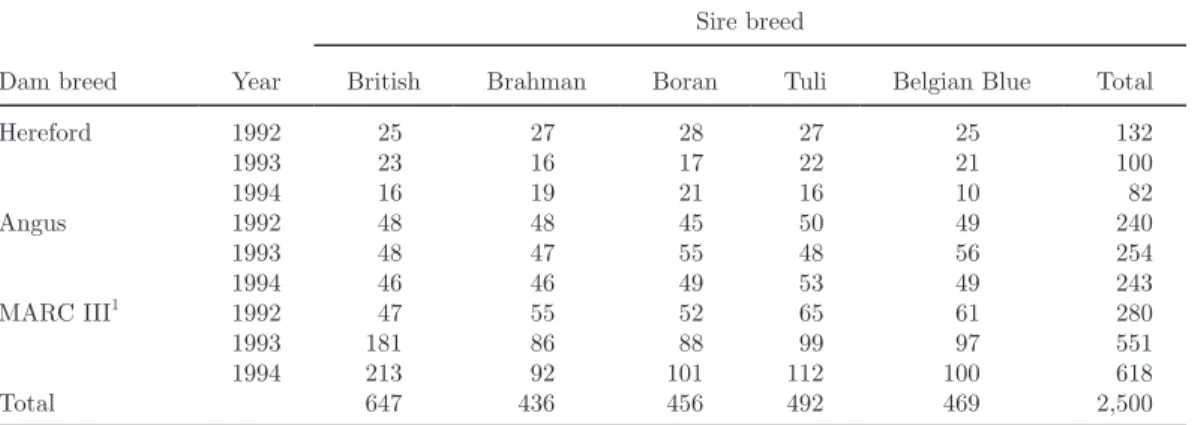
Offspring were born during spring of 1992 (n = 652), 1993 (n = 905), and 1994 (n = 943), beginning in late March and ending in mid May. Table 1 shows the num-ber of animals born by breed group and year. Calves were weighed, tattooed, and tagged for identification. Male calves were castrated within 24 h of birth. Calves were creep-fed whole oats from mid July until weaning in early October. Calves averaged 184 ± 13 d of age at weaning. Table 2 shows the number of animals weaned by breed group and year.
Traits
Traits analyzed included gestation length, calving dif-ficulty, percentage of unassisted calving, percentage of perinatal survival, percentage of survival from birth to weaning, birth and weaning weights, BW at 200 d, and ADG. Gestation length was calculated as the difference between AI date and birth date. Calving difficulty was scored as 1 = no difficulty, 2 = little difficulty (assis-tance given by hand), 3 = little difficulty with a calf jack, 4 = slight difficulty (assistance given with a jack or calf puller), 5 = moderate difficulty (calf jack used), 6 = major difficulty (calf jack used and major diffi-culty encountered), and 7 = cesarean birth. Calves with abnormal presentation or posture were excluded from the analysis of calving difficulty. Unassisted calving was considered when a cow had a calving difficulty score of 1. If the calving difficulty score was 2 or greater, it was considered an assisted calving. Abnormal presenta-tions were excluded from the calculation of percentage of unassisted calving. Percentage of perinatal survival included calves alive after 3 d of age. Percentage of survival from birth to weaning included calves alive at weaning. Consistent with previous reports (Cundiff et al., 1998), BW at weaning were adjusted to 200 d by multiplying ADG from birth to weaning by 200 and adding birth weight. Table 3 shows the number of ob-servations, the mean and SD, and minimum and maxi-mum values for each trait.
Table 1. Number of offspring born by sire breed and dam breed in each year
Dam breed Year
Sire breed
British Brahman Boran Tuli Belgian Blue Total
Hereford 1992 25 27 28 27 25 132 1993 23 16 17 22 21 100 1994 16 19 21 16 10 82 Angus 1992 48 48 45 50 49 240 1993 48 47 55 48 56 254 1994 46 46 49 53 49 243 MARC III1 1992 47 55 52 65 61 280 1993 181 86 88 99 97 551 1994 213 92 101 112 100 618 Total 647 436 456 492 469 2,500
1MARC III = one-fourth Hereford, one-fourth Angus, one-fourth Red Poll, and one-fourth Pinzgauer.
Casas et al.
Statistical Analysis
Data were analyzed with the MIXED procedure (SAS Inst. Inc., Cary, NC). The model included the fixed ef-fects of sire breed (British, Brahman, Boran, Tuli, and Belgian Blue), dam breed (Hereford, Angus, or MARC III), sex (male or female), and birth year (1992, 1993, or 1994). The model also included all possible 2-way interactions. The linear and quadratic effects of age of the cow at calving and the linear effect of Julian birth date were included in the model as covariates. The ran-dom effect of sire within sire breed was included in the model. The Kenward-Rogers option of the MIXED pro-cedure of SAS was used to ascertain degrees of freedom. Hereford and Angus were treated as 1 sire breed (Brit-ish), leaving the difference between reciprocal crossbred Hereford × Angus vs. Angus × Hereford to be account-ed for as part of the sire breaccount-ed–dam breaccount-ed interaction. Least squares means and probability values for differ-ences were estimated for significant effects. Probability values were corrected for multiple testing. A Bonferroni adjustment was applied to the probability values using a factor of 8, which is the number of traits analyzed.
RESULTS AND DISCUSSION
Levels of significance, least squares means, and SE of the means are shown in Tables 4 and 5 for the
ef-fects of sire breed, dam breed, and sex on gestation length, calving difficulty score, percentage of unassisted calving, percentage of perinatal survival, percentage of survival from birth to weaning, BW at different ages, and ADG. Interactions of sire breed × sex for gesta-tion length, calving difficulty, percentage of perinatal survival and birth weight are shown in Table 6. The interaction of dam breed × sex for calving difficulty is shown in Table 7. Interactions of sire breed × dam breed for percentage of perinatal survival and survival from birth to weaning are shown in Table 8. Year of
birth was significant (P < 0.001) for gestation length
and birth weight. Estimates of year of birth were not reported because year effects cannot be predicted to re-cur in the future, and it is appropriate for producers to make decisions about sire breed and dam breed based on information averaged over several years.
Gestation Length
The overall mean for gestation length was 288 d. The effects of sire breed, dam breed, and sex were
signifi-cant (P < 0.001) for gestation length (Table 4).
Ani-mals derived from Brahman, Boran, and Tuli sires had longer gestation lengths when compared with animals derived from British and Belgian Blue sires. Browning et al. (1995) compared the gestation length of animals derived from Angus, Brahman, and Tuli sires. They
Table 2. Number of offspring weaned by sire breed and dam breed in each year
Dam breed Year
Sire breed
British Brahman Boran Tuli Belgian Blue Total
Hereford 1992 25 22 26 27 23 123 1993 22 13 17 21 21 94 1994 16 16 21 15 9 77 Angus 1992 45 48 42 48 49 232 1993 45 43 53 45 54 240 1994 43 43 47 51 47 231 MARC III1 1992 47 53 51 64 59 274 1993 176 79 84 97 91 527 1994 208 88 98 105 98 597 Total 627 405 439 473 451 2,395
1MARC III = one-fourth Hereford, one-fourth Angus, one-fourth Red Poll, and one-fourth Pinzgauer.
Table 3. Number of observations, mean, SD, minimum, and maximum for the traits studied
Trait n Mean SD Minimum Maximum
Gestation length, d 2,500 288 7 254 308
Calving difficulty1 2,446 1.06 0.47 1 7
Unassisted calving, % 2,500 96.0 0.2 0 100
Perinatal survival, % 2,500 97.2 0.2 0 100
Survival from birth to weaning, % 2,500 95.8 0.2 0 100
Birth weight, kg 2,500 42.7 6.5 22.7 70.8
BW at 200 d, kg 2,395 240 28 103 330
ADG, kg/d 2,395 0.99 0.13 0.40 1.42
indicated that animals with Angus inheritance had the shortest gestation length (284 d) when compared with Brahman (294 d) and Tuli (288 d). Plasse et al. (1968) indicated that under subtropical conditions, the gesta-tion length for Brahman cattle is 293 d. Results from the present study are similar to those found by Brown-ing et al. (1995) and Plasse et al. (1968). A comparison of the results from the present study with previous stud-ies showed that gestation length has not been modified by selection schemes in Brahman cattle in more than 30 yr. In the present study, progeny from Brahman sires had a 2 d longer gestation length when compared with the gestation length of progeny from Tuli sires. Chase et al. (2000) found similar differences between both breeds. Bennett et al. (2008), in a program de-signed to reduce calving difficulty in 2-yr-old heifers by using 7 breeds, found that selected lines within a breed for decreased calving difficulty had a shorter gestation length (2 d) when compared with control lines. This indicates that selection schemes affect gestation length regardless of breed.
Consistent with previous reports (Smith et al., 1976; Gregory et al., 1978, 1979; Cundiff et al., 1998), gesta-tion length for progeny of Hereford dams was longer
(P < 0.001) than gestation length for progeny of
An-gus dams. Progeny of MARC III dams had a gestation length intermediate between progeny of Hereford and progeny of Angus cows. Gestation length has not been reported previously for offspring of MARC III cows.
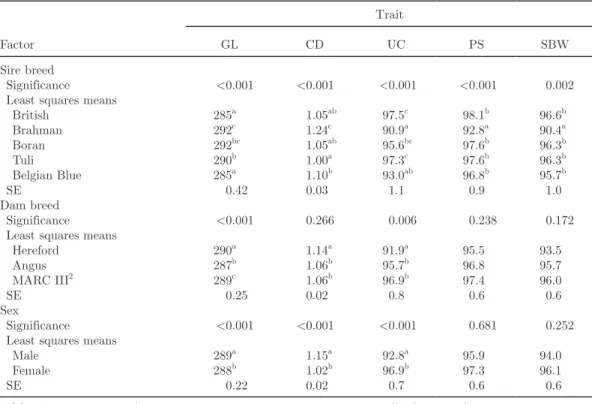
Table 4. Levels of significance, least squares means, and SE for factors affecting
ges-tation length (GL, d), calving difficulty1 (CD), unassisted calving (UC, %), perinatal
survival (PS, %), and survival from birth to weaning (SBW, %)
Factor
Trait
GL CD UC PS SBW
Sire breed
Significance <0.001 <0.001 <0.001 <0.001 0.002 Least squares means
British 285a 1.05ab 97.5c 98.1b 96.6b Brahman 292c 1.24c 90.9a 92.8a 90.4a Boran 292bc 1.05ab 95.6bc 97.6b 96.3b Tuli 290b 1.00a 97.3c 97.6b 96.3b Belgian Blue 285a 1.10b 93.0ab 96.8b 95.7b SE 0.42 0.03 1.1 0.9 1.0 Dam breed Significance <0.001 0.266 0.006 0.238 0.172
Least squares means
Hereford 290a 1.14a 91.9a 95.5 93.5 Angus 287b 1.06b 95.7b 96.8 95.7 MARC III2 289c 1.06b 96.9b 97.4 96.0 SE 0.25 0.02 0.8 0.6 0.6 Sex Significance <0.001 <0.001 <0.001 0.681 0.252 Least squares means
Male 289a 1.15a 92.8a 95.9 94.0
Female 288b 1.02b 96.9b 97.3 96.1
SE 0.22 0.02 0.7 0.6 0.6
a–cWithin column and factor, means without a common superscript differ (P < 0.05). 1Calving difficulty scores: 1 = no difficulty to 7 = cesarean birth.
2MARC III = one-fourth Hereford, one-fourth Angus, one-fourth Red Poll, and one-fourth Pinzgauer.
Table 5. Levels of significance, least squares means, and SE for factors affecting birth weight (BWT, kg), BW at 200 d (W200D, kg), and ADG (kg/d) Factor Trait BWT W200D ADG Sire breed Significance <0.001 <0.001 <0.001 Least squares means
British 42.1b 240b 0.99ab Brahman 45.7a 246a 1.00a Boran 42.9b 230c 0.93c Tuli 38.6c 225c 0.93c Belgian Blue 42.3b 237b 0.97b SE 0.5 2 0.01 Dam breed Significance <0.001 <0.001 <0.001 Least squares means
Hereford 41.6a 221a 0.90a Angus 42.0a 248c 1.03c MARC III1 43.4b 237b 0.97b SE 0.3 1 0.01 Sex Significance <0.001 <0.001 <0.001 Least squares means
Male 44.5a 244a 1.00a
Female 40.2b 227b 0.93b
SE 0.2 1 0.01
a–cWithin column and factor, means without a common superscript differ (P < 0.05).
1MARC III = one-fourth Hereford, one-fourth Angus, one-fourth Red Poll, and one-fourth Pinzgauer.
Casas et al.
Gregory et al. (1991) reported that the average gesta-tion length in 3 generagesta-tions of MARC III cows was 287 d. Gestation lengths in MARC III cows in the present study are similar to those reported by Gregory et al. (1991).
Male calves averaged gestation lengths 1 d longer than those of female calves. This result is similar to studies from Smith et al. (1976), who reported differ-ences of 1.7 d, Gregory et al. (1978), who reported dif-ferences of 1.3 d, Gregory et al. (1979), who reported differences of 2 d, and Cundiff et al. (1998), who re-ported differences of 1.8 d. Male calves have a longer gestation length than female calves.
Table 6 shows the interaction of sire breed × sex for gestation length. Male calves from Brahman sires had a 3 d longer gestation length compared with female calves. However, offspring from Tuli sires showed no difference in gestation length between males and female calves. These differences caused a significant interac-tion effect.
Calving Difficulty
Sire breed has been established as a factor affecting calving difficulty in beef cattle (Zaborski et al., 2009). In the present study, offspring derived from Brahman sires had the greatest calving difficulty (P < 0.001) when compared with the calving difficulty of other sire breeds (Table 4). Paschal et al. (1991) compared
calv-ing difficulty among several B. indicus breeds and
An-gus. Paschal et al. (1991) observed that offspring from Brahman sires had greater calving difficulty compared with progeny from Angus sires. Previously, Gregory et al. (1979) found a similar effect of sire breed when com-paring offspring derived from Brahman, Hereford, and Angus sires. This is consistent with results found in the present study. Dams with offspring by Tuli sires had the smallest numerical calving difficulty, but this was
not significantly different (P > 0.05) from the calving
difficulty observed for dams with offspring from Boran and British breed sires. Size and BW of the calf are important factors in calving difficulty (Bennett et al., 2008). In the present study, Brahman calves were the heaviest at birth (Table 5). It is likely that the size of
Brahman calves plays an important role in calving dif-ficulty.
Belgian Blue is a double-muscled breed homozygous for an inactive form of the myostatin gene (Kambadur et al., 1997). Calves from Belgian Blue sires in this population were expected to have inherited the inactive form of the myostatin gene from their sires. Progeny from Belgian Blue sires had a numerical, but not signif-icant (P > 0.05), increase in calving difficulty (increase of 0.05) when compared with progeny of British breeds. The same difference was also observed by Casas et al. (1999) between animals inheriting 1 and 0 copies of the inactive form of the myostatin gene in a crossbred population with Piedmontese. Further studies would be needed to establish whether this difference is statisti-cally significant.
The larger size and greater BW of male calves is di-rectly associated with increased calving difficulty (Ben-nett et al., 2008; Zaborski et al., 2009). Offspring from Brahman sires were the heaviest (Table 5) and also had the most difficulty at calving (Table 4). Results from this study are consistent with those of other studies (Smith et al., 1976; Gregory et al., 1978, 1979) estab-lishing that dams with male calves have more calving difficulty than those with females.
The interaction of sire breed × sex for calving diffi-culty is shown in Table 6. Male progeny from Brahman
sires had a greater (P < 0.05) calving difficulty score
than females derived from this sire breed (difference of
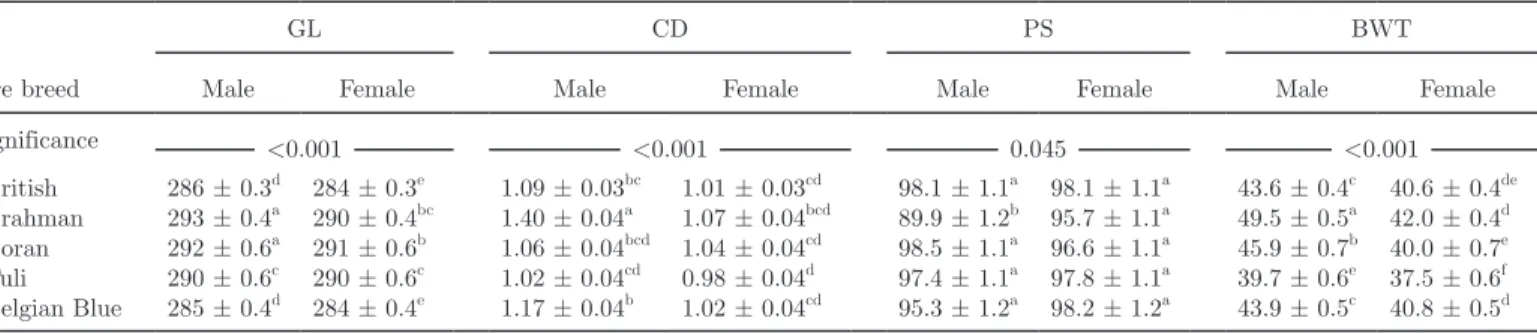
Table 6. Levels of significance, least squares means, and SE for the interaction of sire breed × sex for gestation
length (GL, d), calving difficulty1 (CD), perinatal survival (PS, %), and birth weight (BWT, kg)
Sire breed
GL CD PS BWT
Male Female Male Female Male Female Male Female
Significance <0.001 <0.001 0.045 <0.001 British 286 ± 0.3d 284 ± 0.3e 1.09 ± 0.03bc 1.01 ± 0.03cd 98.1 ± 1.1a 98.1 ± 1.1a 43.6 ± 0.4c 40.6 ± 0.4de Brahman 293 ± 0.4a 290 ± 0.4bc 1.40 ± 0.04a 1.07 ± 0.04bcd 89.9 ± 1.2b 95.7 ± 1.1a 49.5 ± 0.5a 42.0 ± 0.4d Boran 292 ± 0.6a 291 ± 0.6b 1.06 ± 0.04bcd 1.04 ± 0.04cd 98.5 ± 1.1a 96.6 ± 1.1a 45.9 ± 0.7b 40.0 ± 0.7e Tuli 290 ± 0.6c 290 ± 0.6c 1.02 ± 0.04cd 0.98 ± 0.04d 97.4 ± 1.1a 97.8 ± 1.1a 39.7 ± 0.6e 37.5 ± 0.6f Belgian Blue 285 ± 0.4d 284 ± 0.4e 1.17 ± 0.04b 1.02 ± 0.04cd 95.3 ± 1.2a 98.2 ± 1.2a 43.9 ± 0.5c 40.8 ± 0.5d
a–fWithin a trait, means without a common superscript differ (P < 0.05). 1Calving difficulty scores: 1 = no difficulty to 7 = cesarean birth.
Table 7. Levels of significance, least squares means, and SE for the interaction of dam breed × sex for calv-ing difficulty1
Dam breed Males Females
Significance 0.034
Hereford 1.26 ± 0.04a 1.01 ± 0.04c Angus 1.09 ± 0.03b 1.02 ± 0.03c MARC III2 1.09 ± 0.02b 1.04 ± 0.02bc
a–cMeans without a common superscript differ (P < 0.05). 1Calving difficulty scores: 1 = no difficulty to 7 = cesarean birth. 2MARC III = one-fourth Hereford, one-fourth Angus, one-fourth Red Poll, and one-fourth Pinzgauer.
0.33). Male offspring from Belgian Blue sires also had
an increased (P < 0.05) calving difficulty score when
compared with female calves (difference of 0.15). Differ-ences between male and female calves for the remaining breeds were nonsignificant (P > 0.05). These differ-ences contribute to the significance of the interaction.
Table 7 shows the means for the interaction of dam breed × sex for calving difficulty. Male calves from
Hereford cows had an increased (P < 0.05) incidence
of calving difficulty when compared with female calves from this sire breed (difference of 0.25). The differenc-es in calving difficulty incidence for male and female
calves from Angus and MARC III cows were similar (P
> 0.05; average difference of 0.06).
Unassisted Calving
Calving ease, as reflected by the percentage of unas-sisted calvings, differed significantly (P < 0.001) among sire breeds (Table 4). Progeny of British, Boran, and Tuli sires had the greatest incidence of unassisted calv-ing. Percentage of unassisted calving for progeny from British breed sires was similar to that of progeny from Tuli and Boran sires, which had the most unassisted calving. However, percentage of unassisted calving for offspring from Boran sires was similar to that of proge-ny from Belgian Blue sires. Offspring from Belgian Blue and Brahman sires had the least unassisted calving. Chase et al. (2000) compared with progeny of Brahman and Tuli sires under subtropical conditions, and they also found that progeny from Brahman sires needed more assistance at calving than did progeny from Tuli sires.
Calves produced by Hereford cows had less unassist-ed calving than calves born from Angus or MARC III cows. Smith et al. (1976) and Gregory et al. (1978) also found that Hereford cows had more calving difficulty than Angus cows. The calving difficulty of the MARC III cows evaluated in the present study was similar to that of Angus cows.
Female calves had a greater percentage (P < 0.001)
of unassisted calving than male calves. Birth weight of
male calves is an important factor affecting the percent-age of unassisted calving, as a reflection of the greater calving difficulty in males (Cundiff et al., 1998).
Perinatal Survival and Survival from Birth to Weaning
A small proportion of stillbirths and calves that died within 72 h were observed (less than 3%). Percentage of perinatal survival was affected by sire breed (Table 4). Progeny of all sire breeds had similar percentages of perinatal survival except for progeny from Brahman
sires (P < 0.001). Offspring from Brahman sires had a
greater perinatal mortality. Riley et al. (2007) found that calves derived from Brahman and Angus had de-creased perinatal survival when compared with the per-inatal survival of other crosses derived from Brahman and B. taurus breeds. Prayaga (2004) found greater perinatal mortality among calves derived from the cross of Brahman sires with Adaptaur (Hereford-Shorthorn) cows. Prayaga (2004) and Riley et al. (2007) attributed the greater perinatal mortality of calves from Brahman sires to the greater birth weight of these calves and their subsequent calving difficulty. These observations are consistent with the results from the present study. However, in Nebraska, the occurrence of cold and wet weather during spring calving takes a greater toll on
Brahman and other B. indicus-sired calves than on B.
taurus-sired calves.
Survival of calves from birth to weaning was signifi-cantly less in the progeny of Brahman sires than in the
progeny of any other sire breed (P = 0.002). Most of
the mortality in Brahman-sired calves occurred within 72 h after birth. This effect on survival from birth to weaning was also observed by Prayaga (2004) and Riley et al. (2007). Survival of calves was similar among the other sire breeds.
The interaction of sire breed × sex for percentage of perinatal survival is shown in Table 6. Male
prog-eny from Brahman sires had a decreased (P = 0.045)
percentage of perinatal survival when compared with the perinatal survival of females derived from this sire
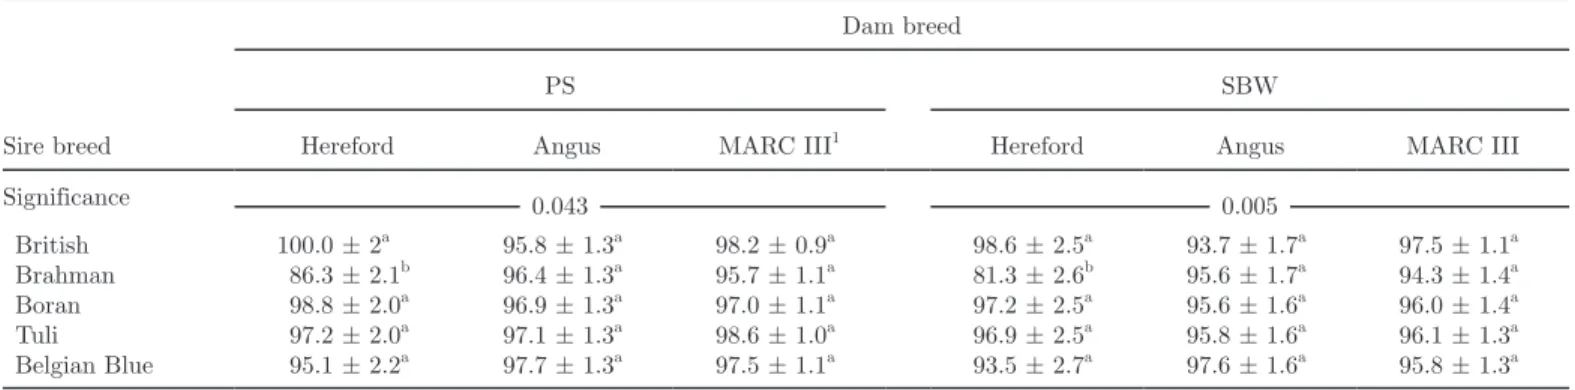
Table 8. Levels of significance, least squares means, and SEM for the interaction of sire breed × dam breed for perinatal survival (PS, %) and survival from birth to weaning (SBW, %)
Sire breed
Dam breed
PS SBW
Hereford Angus MARC III1 Hereford Angus MARC III
Significance 0.043 0.005 British 100.0 ± 2a 95.8 ± 1.3a 98.2 ± 0.9a 98.6 ± 2.5a 93.7 ± 1.7a 97.5 ± 1.1a Brahman 86.3 ± 2.1b 96.4 ± 1.3a 95.7 ± 1.1a 81.3 ± 2.6b 95.6 ± 1.7a 94.3 ± 1.4a Boran 98.8 ± 2.0a 96.9 ± 1.3a 97.0 ± 1.1a 97.2 ± 2.5a 95.6 ± 1.6a 96.0 ± 1.4a Tuli 97.2 ± 2.0a 97.1 ± 1.3a 98.6 ± 1.0a 96.9 ± 2.5a 95.8 ± 1.6a 96.1 ± 1.3a Belgian Blue 95.1 ± 2.2a 97.7 ± 1.3a 97.5 ± 1.1a 93.5 ± 2.7a 97.6 ± 1.6a 95.8 ± 1.3a
a,bWithin a trait, means without a common superscript differ (P < 0.05).
1MARC III = one-fourth Hereford, one-fourth Angus, one-fourth Red Poll, and one-fourth Pinzgauer.
Casas et al.
breed (difference of 5.8%). Differences between male and female calves for the remaining breeds were not significantly different (P > 0.05). The decreased per-centage of perinatal survival observed in calves from Brahman sires (Table 4) was due to perinatal mortality in male calves. This difference contributed to the sig-nificance of the interaction.
Means for the interaction of sire breed × dam breed for percentage of perinatal survival and survival from birth to weaning are shown in Table 8. The decreased percentage of perinatal survival and reduced survival from birth to weaning (86.3 and 81.3%, respectively) of calves from Brahman sires and Hereford cows was responsible for this interaction. Brahman sires and Her-eford dams had the greatest calving difficulty, which could have contributed to the decreased survival.
Birth Weight
The effects of sire breed were significant (P < 0.001) for birth weight (Table 5). Offspring derived from Brah-man sires were heaviest at birth. The lightest calves were produced by Tuli sires. Progeny from British, Boran, and Belgian Blue sires had intermediate birth weights. Paschal et al. (1991) showed that Brahman calves were heavier at birth when compared with An-gus calves. Riley et al. (2007) indicated that Brahman-sired calves had heavier birth weights than reciprocal crossbred calves (Angus- and Romosinuano-sired calves with Brahman cows). Brahman-sired male calves were heavier at birth than male calves sired by Romosinuano and Angus. Chase et al. (2000) compared birth weights of calves produced by Brahman and Tuli sires and found that Brahman calves were heavier at birth than Tuli calves. Holloway et al. (2002) indicated a similar pattern, in which offspring from Brahman sires were heavier at birth than progeny from Tuli sires. Brown-ing et al. (1995) found no difference in birth weight among offspring from Angus, Brahman, and Tuli sires. It is possible that a lack of statistical power hampered the ability of the study by Browning et al. (1995) to detect statistical differences for birth weight among offspring of these breeds because a limited number of observations were used. However, numerically, offspring from Brahman cattle were the heaviest at birth, fol-lowed by offspring from Angus sires. The lightest calves were produced by Tuli sires in the study by Browning et al. (1995). Birth weights of offspring from Belgian Blue sires were not statistically different from birth weights of offspring from Boran or British breeds. Lun-stra and Cundiff (2003) found no difference for birth weight among bulls obtained from Hereford, Angus, and Belgian Blue sires. Calves from Belgian Blue sires were heterozygous for the inactive form of the myosta-tin allele. Casas et al. (2004) reported that the birth weight of calves derived from Belgian Blue grandsires with 1 copy of the inactive myostatin allele was 42.2 kg. This is similar to the birth weight reported in the present study (42.3 kg). Bidner et al. (2009) indicated
that calves produced by Belgian Blue sires were heavier at birth than were the progeny of Angus sires. Results from the present study corroborate results from addi-tional studies indicating that the progeny from Brah-man sires are heaviest at birth (Chase et al., 2000).
Calves from MARC III cows were heavier (P <
0.001) at birth than progeny from Hereford or Angus cows. No difference in birth weight was observed be-tween calves from Hereford or Angus cows. Smith et al. (1976), Gregory et al. (1978, 1979), and Cundiff et al. (1998) indicated that calves from Hereford cows were heavier at birth than calves from Angus cows. The difference in birth weight for progeny from MARC III cows and Hereford and Angus cows could be explained by retained heterosis in the composite breed (Gregory et al., 1991).
Male calves were heavier (P < 0.001) at birth than
female calves. The difference between males and fe-males was 4.3 kg. Sex differences have been detected regardless of breed (Bellows et al., 1996; Cundiff et al., 1998; Chase et al., 2000; Holloway et al., 2002; Riley
et al., 2007), except for calves by B. taurus bulls from
Brahman cows. Thallman et al. (1992) reported that among calves sired by Simmental bulls from Brahman cows, female calves were 0.4 ± 0.5 kg heavier at birth than the corresponding male calves. In the study by Thallman et al. (1992), calves were embryos in Holstein recipient cows.
The interaction of sire breed × sex for birth weight is shown in Table 6. This interaction resulted from a sig-nificantly greater difference between males and females in the progeny derived from Brahman sires (males − females = 7.5 kg). The difference between sexes for the offspring of Boran sires was 5.9 kg, which also contrib-uted to the significance of this interaction. The differ-ence between males and females for the offspring of British breed, Tuli, and Belgian Blue sires was in the range of 2.2 to 3.1 kg. Chase et al. (2000) found a sig-nificant interaction of sire breed × sex in a population that included calves derived from Brahman, Senepol, and Tuli sires. Chase et al. (2000) indicated that heavi-er male calves from Brahman sires wheavi-ere responsible for this interaction. Cundiff et al. (1998) found this inter-action to be significant in Cycle IV of the GPE project. Cundiff et al. (1998) indicated that this interaction was due to the difference between males and females from
offspring of Nellore sires. Bos indicus sires tend to
pro-duce heavier male than female calves relative to the sex
difference between B. taurus × B. taurus.
BW at 200 d, and ADG
Table 5 shows the least squares means for BW at 200 d and for ADG. Sire breed, dam breed, and sex were significant (P < 0.001) sources of variation for all traits.
Progeny from Brahman sires were heaviest at 200 d and had the greatest ADG. Progeny from Boran and Tuli sires were the lightest at 200 d, with the smallest
ADG. Offspring from British breeds and Belgian Blue sires were intermediate for these traits. Chase et al. (2000), comparing offspring from Brahman and Tuli sires, found that offspring from Brahman sires were heavier than those from Tuli sires. This is similar to the reports from Herring et al. (1996) and Holloway et al. (2002). Similarly, Chase et al. (2004) found that animals with Brahman maternal grandsires were heavi-er at weaning than animals from Tuli matheavi-ernal grand-sires. Riley et al. (2007) indicated that calves produced by Brahman sires were heavier at weaning than calves sired by Angus and Romosinuano.
Progeny from Angus cows were heavier at weaning and at 200 d, and they had a faster growth rate. Off-spring from Hereford cows were the lightest at wean-ing and at 200 d, with the slowest growth rate. Calves from MARC III cows were intermediate. Herring et al. (1996) found that calves from Angus cows were heavier at weaning when compared with progeny from Hereford cows. Gregory et al. (1979) indicated that Angus cows produced heavier calves at 200 d when compared with Hereford cows. Results from these studies are similar to those found in the present study.
Male calves are heavier at weaning and at 200 d, with faster growth compared with females. This has been observed previously by Herring et al. (1996), Chase et al. (2000), and Riley et al. (2007).
Data used in the present study are from animals pro-duced at the USMARC between 1992 and 1994. Boran and Tuli are 2 tropically adapted breeds that have not been intensively selected. Therefore, results from this study should remain relevant.
Characterization of the reproduction performance for females produced in this GPE Cycle is needed. Traits associated with the stayability and overall productivity of females also need to be characterized in this popula-tion. However, this falls outside the scope of the pres-ent study. Further studies are required to fully evaluate these breeds.
Significant differences exist among crossbred prog-eny derived from British breeds, Brahman, Boran, Tuli, and Belgian Blue sires for birth and weaning traits. Under temperate conditions, offspring from Brahman sires grew faster and were heavier at birth and at wean-ing. However, Brahman sires produced offspring that required more calving assistance and had the least sur-vival rate. Breed differences can be exploited to op-timize performance levels in crosses or in composite populations relatively more quickly than performance can be optimized by intrapopulation selection. Results from the present study would allow producers to make informed decisions if the need arises to optimize perfor-mance levels quickly.
LITERATURE CITED
Bellows, R. A., P. C. Genho, S. A. Moore, and C. C. Chase Jr. 1996. Factors affecting dystocia in Brahman-cross heifers in subtropi-cal southeastern United States. J. Anim. Sci. 74:1451–1456.
Bennett, G. L., R. M. Thallman, W. M. Snelling, and L. A. Kuehn. 2008. Experimental selection for calving ease and postnatal growth in seven cattle populations. II. Phenotypic differences. J. Anim. Sci. 86:2103–2114.
Bidner, T. D., P. E. Humes, W. E. Wyatt, D. E. Franke, M. A. Per-sica III, G. T. Gentry, and D. C. Blouin. 2009. Influence of An-gus and Belgian Blue bulls mated to Hereford × Brahman cows on growth, carcass traits, and longissimus steak shear force. J. Anim. Sci. 87:1167–1173.
Browning, R., Jr., M. Leite-Browning, D. A. Neuendorff, and R. D. Randel. 1995. Preweaning growth of Angus- (Bos taurus), Brahman- (Bos indicus), and Tuli- (Sanga) sired calves and reproductive performance of their Brahman dams. J. Anim. Sci. 73:2558–2563.
Casas, E., G. L. Bennett, T. P. L. Smith, and L. V. Cundiff. 2004. Association of myostatin on early calf mortality, growth, and carcass composition traits in crossbred cattle. J. Anim. Sci. 82:2913–2918.
Casas, E., J. W. Keele, S. C. Fahrenkrug, T. P. L. Smith, L. V. Cundiff, and R. T. Stone. 1999. Quantitative analysis of birth, weaning, and yearling weights and calving difficulty in Pied-montese crossbreds segregating an inactive myostatin allele. J. Anim. Sci. 77:1686–1692.
Chase, C. C., Jr., A. C. Hammond, and T. A. Olson. 2000. Effect of tropically adapted sire breeds on preweaning growth of F1 An-gus calves and reproductive performance of their AnAn-gus dams. J. Anim. Sci. 78:1111–1116.
Chase, C. C., Jr., D. G. Riley, T. A. Olson, S. W. Coleman, and A. C. Hammond. 2004. Maternal and reproductive performance of Brahman × Angus, Senepol × Angus, and Tuli × Angus cows in the subtropics. J. Anim. Sci. 82:2764–2772.
Crouse, J. D., L. V. Cundiff, R. M. Koch, M. Koohmaraie, and S. C. Seideman. 1989. Comparsion of Bos indicus and Bos taurus in-heritance for carcass beef characteristics and meat palatability. J. Anim. Sci. 67:2661–2668.
Cundiff, L. V., K. E. Gregory, and R. M. Koch. 1998. Germplasm evaluation in beef cattle—Cycle IV: Birth and weaning traits. J. Anim. Sci. 76:2528–2535.
FASS. 1999. Guide for the Care and Use of Agricultural Animals in Agricultural Research and Teaching. 1st ed. Fed. Anim. Sci. Soc., Savoy, IL.
Gregory, K. E., L. V. Cundiff, and R. M. Koch. 1991. Breed effects and heterosis in advanced generations of composite populations for birth weight, birth date, dystocia, and survival as traits of dam in beef cattle. J. Anim. Sci. 69:3574–3589.
Gregory, K. E., L. V. Cundiff, G. M. Smith, D. B. Laster, and H. A. Fitzhugh Jr. 1978. Characterization of biological types of cattle—Cycle II: I. Birth and weaning traits. J. Anim. Sci. 47:1022–1030.
Gregory, K. E., G. M. Smith, L. V. Cundiff, R. M. Koch, and D. B. Laster. 1979. Characterization of biological types of cattle—Cy-cle III: I. Birth and weaning traits. J. Anim. Sci. 48:271–279. Herring, A. D., J. O. Sanders, R. E. Kunston, and D. K. Lunt. 1996.
Evaluation of F1 calves sired by Brahman, Boran, and Tuli bulls for birth, growth, size, and carcass characteristics. J. Anim. Sci. 74:955–964.
Holloway, J. W., B. G. Warrington, D. W. Forrest, and R. D. Ran-del. 2002. Preweaning growth of F1 tropically adapted beef cattle breeds × Angus and reproductive performance of their Angus dams in arid rangeland. J. Anim. Sci. 80:911–918. Kambadur, R., M. Sharma, T. P. L. Smith, and J. J. Baas. 1997.
Mutations in myostatin (GDF8) in double-muscled Belgian Blue and Piedmontese cattle. Genome Res. 7:910–916. Lunstra, D. D., and L. V. Cundiff. 2003. Growth and pubertal
devel-opment in Brahman-, Boran-, Tuli-, Belgian Blue-, Hereford-, and Angus-sired F1 bulls. J. Anim. Sci. 81:1414–1426. Olson, T. A., K. Euclides Filho, L. V. Cundiff, M. Koger, W. T.
Butts Jr., and K. E. Gregory. 1991. Effects of breed group by location interaction on crossbred cattle in Nebraska and Flori-da. J. Anim. Sci. 69:104–114.
Casas et al.
Paschal, J. C., J. O. Sanders, and J. L. Kerr. 1991. Calving and weaning characteristics of Angus-, Gray Brahman-, Gir-, Indu-Brazil-, Nellore-, and Red Brahman-sired F1 calves. J. Anim. Sci. 69:2395–2402.
Plasse, D., A. C. Warwick, R. E. Reese, and M. Koger. 1968. Re-productive behavior of Bos indicus females in a subtropical en-vironment. II. Gestation length in Brahman cattle. J. Anim. Sci. 27:101–104.
Prayaga, K. C. 2004. Evaluation of beef cattle genotypes and estima-tion of direct and maternal genetic effects in a tropical environ-ment. 3. Fertility and calf survival traits. Aust. J. Agric. Res. 55:811–824.
Riley, D. G., C. C. Chase Jr., S. W. Coleman, and T. A. Olson. 2007. Evaluation of birth and weaning traits of Romosinuano calves as purebreds and crosses with Brahman and Angus. J. Anim. Sci. 85:289–298.
Smith, G. M., D. B. Laster, and K. E. Gregory. 1976. Characteriza-tion of biological types of cattle. I. Dystocia and preweaning growth. J. Anim. Sci. 43:27–36.
Thallman, R. M., J. O. Sanders, and J. F. Taylor. 1992. Non-Mende-lian genetic effects in reciprocal cross Brahman × Simmental F1 calves produced by embryo transfer. Pages 8–14 in Beef Cattle Research in Texas. Texas Agric. Exp. Stn., College Station. Thrift, F. A., and T. A. Thrift. 2003. Review: Longevity attributes
of Bos indicus × Bos taurus crossbred cows. Prof. Anim. Sci. 19:329–341.
Zaborski, D., W. Grzesiak, I. Szatkowska, A. Dybus, M. Muszynska, and M. Jedrejczak. 2009. Factors affecting dystocia in cattle. Reprod. Domest. Anim. 44:540–551.