Increasing the Reliability of Crowdsourcing
Evaluations Using Online Quality Assessment
Alec Burmania,
Student Member, IEEE,
Srinivas Parthasarathy,
Student Member, IEEE,
and Carlos Busso,
Senior Member, IEEE
Abstract—Manual annotations and transcriptions have an ever-increasing importance in areas such as behavioral signal processing, image processing, computer vision, and speech signal processing. Conventionally, this metadata has been collected through manual annotations by experts. With the advent of crowdsourcing services, the scientific community has begun to crowdsource many tasks that researchers deem tedious, but can be easily completed by many human annotators. While crowdsourcing is a cheaper and more efficient approach, the quality of the annotations becomes a limitation in many cases. This paper investigates the use of reference sets with predetermined ground-truth to monitor annotators’ accuracy and fatigue, all in real-time. The reference set includes evaluations that are identical in form to the relevant questions that are collected, so annotators are blind to whether or not they are being graded on performance on a specific question. We explore these ideas on the emotional annotation of the MSP-IMPROV database. We present promising results which suggest that our system is suitable for collecting accurate annotations.
Index Terms—Mechanical Turk, Crowdsourcing, Emotional Annotation, Emotion, Multimodal Interactions
F
1 INTRODUCTION
A
Key challenge in the area of affective computing isthe annotation of emotional labels that describe the underlying expressive behaviors observed during human interactions [4]. For example, these emotional labels are crucial for defining the classes used to train emotion recog-nition systems (i.e., ground truth). Naturalistic expressive recordings include mixtures of ambiguous emotions [24], which are usually estimated with perceptual evaluations from as many external observers as possible. These eval-uations conventionally involve researchers, experts or na¨ıve observers watching videos for hours. The process of finding and hiring the annotators, bringing them into the laboratory environment, and conducting the perceptual evaluation is time consuming and expensive. This method also requires the researcher to be present during the evaluation. As a result, most of the emotional databases are evaluated with a limited number of annotators [4]. This problem affects not only the annotation of emotional behaviors, but also other behavioral, image, video, and speech signal processing tasks that require manual annotations (e.g., gesture recognition, speech translation, image retrieval).
1.1 Crowdsourcing
Recently, researchers have explored crowdsourcing services to address this problem. Online services such as Amazon’s
Mechanical Turk(MTurk) [27] allow employers or researchers
to hire Turkers (who we refer to as workers in this study) to do Human Intelligence Tasks (HITs) for small individual payments. MTurk gives access to a diverse pool of users who would be difficult to reach out to under conventional
A. Burmania, S. Parthasarathy, and C. Busso are with the Erik Jonsson School of Engineering & Computer Science, The University of Texas at Dallas, TX 75080 (e-mail:[email protected], [email protected], [email protected]).
Manuscript received November 19, 2014; revised xx
settings [20], [30]. Annotation with this method is cheaper than the alternative [34]. For tasks that are natural enough and easy to learn, Snow et al. [6] suggested that the quality of the workers is comparable to expert annotators; in many cases two workers are required to replace one expert annota-tor, at a fraction of the cost. In fact, they collected 840 labels for only one dollar. However, their study also suggested that there are many spammers and malicious workers who give low quality data (spammer in this context refers to participants who aim to receive payments without properly completing the tasks). Current approaches to avoid this problem include pre-screening and post-processing filters [11]. Pre-screening filters include approval rating checks, country restrictions, and qualification tests. For example, many requesters on MTurk limit the evaluation to work-ers living in the United States. These restrictions can be effective, yet lower the pool of workers. However, they do not prevent workers who meet these conditions from spamming. Post-processing methods include data filtering schemes that check for spam [16]. The requirement for many of these tasks with post-processing filters includes simple questions that demonstrate that the worker is not a bot [10]. These may be simple common knowledge questions or questions with known solutions. Additionally, some re-questers create qualification tests to pre-screen individual workers for quality before annotations begin [35]. These are effective yet create a large amount of overhead; in some cases a worker may complete a qualification test and not ever complete a HIT afterwards. Furthermore, qualification tests and other pre-processing methods do not prevent worker fatigue. If the researcher accepts the given data because the initial annotations were up to par, they see a net decrease in quality. Or, if the annotator is rejected by the spam filter, they do not receive payment for some quality work completed at the beginning of the HIT.
Collect'reference'set''
(gold'standard)'
'
Ph
as
e'1
'
Ph
as
e'3
'
Collect'gold'
standard'data'
Collect'full'
evalua7ons'
Interleave'gold'
standard'data'
Experimental'
Setup'
Phase'1'
Phase'2'
Test'different'
filters'
Phase'3'
End'…'
…'
End'Interleave'reference'set'with''data'
Data' Data' Data'
R' R' R' R' R' R' R' R' R' R'
R'
R'
R'
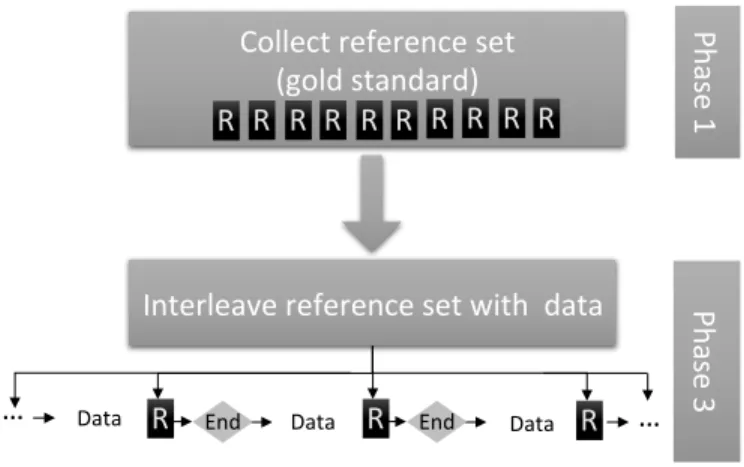
Fig. 1. Online quality assessment approach to evaluate the quality in crowdsourcing evaluations in real time. In Phase 1, we evaluate a reference set used as a gold standard. In Phase 2 (not displayed in the picture), we evaluate the performance of workers annotating multiple videos per HIT. In Phase 3, we assess the quality in real time, stopping the evaluation when the performance drops below a given threshold.
1.2 Our Approach
This paper explores a novel approach to increase the reli-ability of emotional annotations by monitoring the quality of the annotations provided by workers in real time. We investigate this problem by applying an iterative online assessment method that filters data during the survey pro-cess, stopping evaluations when the performance is below an acceptable level. Figure 1 provides an overview of the proposed approach, where we interleave videos from a reference set in the evaluation to continuously track the performance of the workers in real time.
We use a three phase method for our experiment. The top diagram in Figure 1 corresponds to phase one, where we evaluate the emotional content of 652 videos, which are separated from the rest of the videos to be evaluated (over 7,000 spontaneous recordings). We refer to them as reference videos (i.e., gold standard). We aim to have five annotations per video, annotated by many different workers. These annotations include scores for categorical emotion (e.g., happy, anger), and attribute annotations (e.g., activation, valence). Phase two, not shown in Figure 1, aims to analyze the performance of workers annotating multiple videos per HIT. We ask each worker to evaluate 105 videos per HIT. The order of the clips includes a series of five videos from the reference set (emotionally evaluated during phase one), followed by 20 videos to be annotated (e.g., 5, 20, 5, 20, 5, 20, 5, 20, 5). By evaluating reference videos, we can compare the performance of the workers across time by estimating the agreement of the provided scores. This phase also provides insight into the drop in performance relative to time, as the workers tire. We leverage the analysis of the labels collected in this phase to define acceptable metrics describing the inter-evaluator agreement. The bottom diagram in Figure 1 describes phase three. This phase combines the reference data taken from phase one with the performance data re-garding how workers performed on phase two to generate a filtering mechanism which can immediately stop a survey in progress once a worker falls below an acceptable threshold
– all in real time.
Our method provides a novel way to approach crowd-sourcing, as it does not solely rely on pre-screening workers or the use of spam filters after the survey. This system is useful not only to detect spam, but to track and oppose worker fatigue, which other ground-truth systems do not always accomplish. While we focus on annotations of emo-tional labels, the proposed approach is abstract enough to solve other crowdsourcing tasks.
The paper is organized as follows. Section 2 describes related works on MTurk. Section 3 presents the MSP-IMPROV database, which we use to demonstrate the pro-posed online quality assessment scheme for crowdsourcing. This section also describes the questionnaires used for the evaluations. Section 4 describes the metric used to estimate inter-evaluator agreement. Section 5 presents our approach to collect reliable emotional labels from MTurk. Section 6 analyzes the labels collected with this study, discussing generalization of the approach. Finally, Section 7 gives the conclusions and our future directions on this project.
2 R
ELATEDWORK
2.1 Crowdsourcing and Emotions
Most of the emotional labels assigned to current emotional databases are collected with perceptual evaluations. Crowd-sourcing offers an appealing venue to effectively derive these labels [23], [37], and recent studies have explored this option. Mariooryad et al. [19] used MTurk to evaluate the emotional content of naturalistic, spontaneous speech recordings retrieved by an emotion recognition system. Cao et al. [6] used crowdsourcing to assign emotional labels to the CRowd-sourced Emotional Multimodal Actors Dataset
(CREMA-D). They collected ten annotations per video, a large number compared to the number of raters used in other emotional databases [4]. Soleymani and Larson [35] relied on MTurk to evaluate the perception of boredom felt by annotators after watching video clips. Provost et al. [25], [26] used MTurk to perceptually evaluate audiovisual stimuli. The study focused on multimodal emotion integra-tion of acoustic and visual cues by designing videos with conflicting expressive content (e.g., happy face, angry voice). Gravano et al. [13] used MTurk to annotate a corpus with social behaviors. Other studies have also used crowdsourc-ing to derive levels for sentiment analysis [22], [34], [39]. These studies demonstrate the key role that crowdsourcing can play in annotating a corpus with relevant emotional descriptors – lower cost [34] and a diverse pool of annotators [20], [30].
2.2 Quality Control Methods for Crowdsourcing The use of Mechanical Turk for the purpose of annotating video and audio has increased due to the mass amount of data that can be evaluated in a short amount of time [34]. Crowdsourcing can be useful where obtaining labels is tedious, expensive, and when the labels do not require expert raters [37]. In many cases, 3-5 annotators are suffi-cient for generating these labels. Studies have analyzed the quality of the annotations provided by non-expert workers, revealing high agreement with annotations from experts
[34] (for tasks that are natural enough and easy to learn). In some cases, studies have shown that the performance of workers is similar to the performance achieved by subjects recruited in laboratory settings [17], [29]. The review by Manson and Suri [20] provides a comprehensive description about the use of MTurk on behavioral research. Ambati et al. [2] highlighted the importance of providing clear instructions to workers so they can effectively complete the tasks. However, a key challenge in using MTurk is the task of separating spam from quality data [1], [3], [16], [18], [34]. This section describes the common approaches used for this purpose.
MTurk offers many default qualifications that requesters can set in the HITs. One of these is country restrictions. A requester can also specify that workers completing the task must have a minimum acceptance rate, using the ap-proval/rejection rates of their previous assignments. For ex-ample, Gravano et al. [13] requested only workers living in the United States with acceptance rates above 95%. Eickhoff and de Vries [11] showed that using country restriction was more effective than filtering by prior acceptance rate. Morris and McDuff [23] highlighted that workers can easily boost their performance ratings, thus pre-filtering methods based on worker reputation may not necessarily increase quality. Other pre-filters exist such as the minimum amount of HITs previously completed by the workers. All of these restric-tions can be helpful to collect quality data in combination with suitable post-processing methods [1]. The design of the HITs can also effectively discourage cheaters by introducing more variability and changing the context of HITs [11]. Another common pre-processing method for requesters is qualification tests, which are completed before starting the actual task [28], [34]. This approach is useful to train a worker to complete the HIT, or to make sure that the worker is competent enough to complete the task. Soleymani and Larson [35] used qualification tests to pre-screen the work-ers. Only the ones that demonstrated adequate performance were later invited (by email) to complete the actual task. The downside of this method is the large overhead. Also, some requesters pay workers to take the qualification test, without knowing if they will ever complete an actual HIT, due to lack of qualification or interest. Additionally, post-processing is required to ensure the workers do not just spam a HIT and abuse the qualification that they have earned. Qualification tests also include questions to ensure that the workers can listen to the audio or watch the video of the task (e.g., transcribing short audio segments [6]).
An interesting approach is to assess the workers during the actual evaluation. Some studies used dummy questions, questions with clear answers (i.e., gold standard), or other strategies to test the workers [3], [11], [18], [28]. These questions may not end up benefiting the annotation of the corpus, which creates overhead and increases the cognitive load of the workers. Even if the verification questions are correctly answered, we cannot assume that the workers will correctly answer the actual HIT. For these reasons, there is a clear advantage in using verification questions that are similar to the actual task, so that workers cannot tell when they are being evaluated (i.e., blind verification). Xu et al. [41] proposed an online HodgeRank algorithm that detects inconsistencies in ranking labels during the evaluation. In
contrast to our proposed work, the approach does not track the performance of individual workers stopping the evalu-ations when the quality drops. Using simulevalu-ations, Vuurens et al. [38] presented different metrics to identify classes of workers (“proper workers”, “random spammers”, “sloppy workers”, and “uniform spammers”). Through cycles, they replaced bad workers with new evaluations. The iteration was manually implemented without a management tool.
Post-processing filters are vital to most data collections in MTurk. Some studies rely more on this step than others [28], [35]. Some requesters use the time duration taken to complete the HIT, discarding annotations if they are either too fast or too slow [6], [32], [35]. Other post-processing methods include majority rule, where requesters release a HIT usually with an odd amount of assignments. Workers are asked to answer a question, and the majority is consid-ered the correct answer (sometimes tiebreaks are necessary) [16]. The workers in the minority are generally declined payment for the HIT. While this method can produce high-quality data due to competition (especially with a large amount of HITs [40]), it may not be optimal for evaluating ambiguous task such as emotion perception. Hirth et al. [16] proposed to create a second HIT, aiming to verify the answers provided by the workers on the main task. Another common approach is to estimate the agreement between workers and discard the ones causing lower agreements [25]. For example, one of the criteria used by Eickhoff and de Vries [11] to detect cheaters was if 50% of their answers disagreed the majority. Buchholz and Latorre [3] and Kittur et al. [18] identified repeat cheaters as an important problem. Therefore, it is important to keep track of the workers, blocking malicious users [2], [8].
While pre-processing and post-processing verification checks are important, monitoring the quality in real time offers many benefits to obtain quality data. MTurk allows for the requester to reject a HIT if the requester deems it to be low quality. However, this process is not optimal for either workers or requesters. By using online quality assessment during a survey, we can monitor in real time drops in performance due to lack of interest or fatigue, saving valuable resources in terms of money and time. This framework offers a novel approach for emotional perceptual evaluations, and other related tasks. The key contributions of this study are:
• Control the quality of the workers in real time, stopping
the evaluation when the quality is below an acceptable level.
• Identify and prevent fatigue and lack of interest over
time for each worker, reducing the large variability in the annotations.
• Design a general framework for crowdsourcing that is
totally autonomous running in real time (i.e., does not require manual management).
• Provide an extensive evaluation with over 50,000
annota-tions, exploring learning effect, benefits of multiple surveys per HIT, drop in performance due to fatigue, and perfor-mance based on task duration.
(a) Sound Booth Setup (b) Setup (c) One of the actresses (d) One of the actors Fig. 2. The MSP-IMPROV database [5]. The figure describes the recording settings used for the data collection in the sound booth.
3 UTD-IMPROV DATABASE
3.1 Description of the CorpusThe approach to collect annotations with crowdsourcing using reference sets is evaluated in the context of emo-tional annotations. In particular, we annotate the expressive content of the MSP-IMPROV database [5]. We recorded the MSP-IMPROV database as part of ourNational Science
Foun-dation (NSF) project on multimodal emotional perception.
The project explores perceptual-based models for emotion behavior assessments [26]. It uses subjective evaluation of audiovisual videos of subjects conveying congruent or con-flicting emotional information in speech and facial expres-sion [25]. The approach requires sentences with the same lexical content spoken with different emotions. By fixing the lexical content, we can create videos with mismatched conditions (e.g., happy face with sad speech), without intro-ducing inconsistency between the actual speech and the face appearance. To create the stimuli, we recorded 15 sentences conveying the following four target emotions: happiness, sadness, anger and neutral state. Instead of asking actors to read the sentences in different emotions, we implemented a novel framework based on improvisation. The approach consists in designing spontaneous scenarios that are played by two actors during improvisations. These scenarios are carefully designed such that the actor can utter a target sentence with a specific emotion. This approach balances the tradeoff between natural expressive interactions and the required controlled conditions. Notice that the perceptual evaluation in this paper only includes the original videos (i.e., congruent emotions).
Figure 2 shows our experimental setup. We have recorded six sessions from 12 actors in dyadic interactions by pairing one actor and one actress per session (Figs. 2(c) and 2(d)). These subjects are students with acting training recruited at the University of Texas at Dallas. Many of the pairs were selected such that they knew one another, as to promote natural and comfortable interaction during the recordings. The actors face each other to place emphasis on generating natural expressive behaviors (Fig. 2(a)). The corpus was recorded in a sound booth with high definition cameras facing each actor and microphones clipped to each actor’s shirt. We use a monitor to display the target sen-tences and the underlying scenarios (Fig. 3). One actor is chosen as Person A, who has to speak the target sentence at some point during the scene, while Person B supports Person A in reaching the target sentence. We let the actors practice these scenes beforehand.
Angry
Finally, the mail carrier let me in.
Person A: You are at the post office and desperately have to deliver a package to your brother who lives in another state. However, even though the post office is open the door is locked. You become frustrated. Later in the day you are telling your friend about the incident and then you say angrily, Finally, the mail carrier let me in.
Person B: You are talking to your friend about a terrible experience that he had earlier that day.
Fig. 3. An example of the slides given to the actors. The example is for the sentence “Finally, the mail carrier let me in.” where the target emotion is angry. Person A utters this sentence during the improvisation.
The corpus was manually segmented into dialog turns. We defined a dialog turn as the segment starting when a subject began speaking a phrase or sentence, and fin-ishing when he/she stopped speaking. When possible, we extended the boundaries to include small silence segments at the beginning and ending of the turn. The protocol to collect the corpus defines three different datasets for the MSP-IMPROV database:
Target - improvised:This set includes the sentences conveying the target lexical content provided in the scenario (e.g., “Finally, the mail carrier let me in.” – see Fig. 3). These are the most relevant turns for the perceptual study (652 turns).
Other - improvised: The MSP-IMPROV corpus includes all
the turns during the improvisation recordings, not just the target sentences. This dataset consists of previous and following turns during the improvisation that led the actors to utter the target sentences (4381 turns).
Natural interaction: We noticed that spontaneous
conversa-tion during breaks conveyed a full range of emoconversa-tions as the actors react to mistakes or ideas they had for the scenes. Therefore, we did not stop the camera or microphones during breaks, recording the actors’ interactions between recordings (2785 turns).
In this study, Target - improvised videos form our refer-ence set (i.e., Ref. set) and our goal is to evaluate the rest of the corpus: Other - improvised and Natural interactions
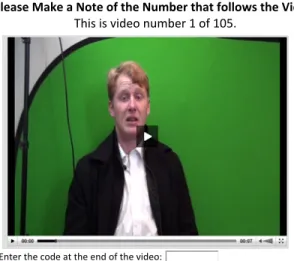
Please&Make&a&Note&of&the&Number&that&follows&the&Video. This%is%video%number%1%of%105. Enter&the&code&at&the&end&of&the&video:& Please&choose&the&emo4on&that&best&describes&the&clip&above:& This&Clip&is&Happy&&&&&&&&&&&&&&&&&&&&This&Clip&is&Angry&&&&&&&&& &&&&This&Clip&is&Sad& && This&Clip&is&Neutral&&&&&&&&&&&&&&&&&&None&of&the&Above & Please&choose&the&emo4ons&that&best&describe&this&clip.&(Select&all&that&apply):& This&Clip&is&Angry&&&&&&&&&&&&&&&This&Clip&is&Happy&&&&&&&&&&&&&&&&&&&&&&&This&Clip&is&Neutral& This&Clip&is&Sad&&&&&&&&&&&&&&&&&&&This&Clip&is&Frustrated&&&&&&&&&&&&&&&&This&Clip&is&Surprised& This&Clip&shows&Fear&&&&&&&&&This&Clip&&is&Depressed&&&&&&&&&&&&&&&This&Clip&is&Excited This&Clip&shows&Disgust&&&&&&&&&&&&&&&&&&&&&&&&&&Other &
Thursday, January 2, 14Fig. 4. First section of the questionnaire used in the perceptual eval-uation. The questions evaluate the emotional content of the corpus in terms of discrete primary and secondary emotional categories.
3.2 Emotional Questionnaire for Survey
The emotional questionnaire used for the survey is moti-vated by the scope of the perceptual study which focuses on the emotions happiness, anger, sadness, neutrality and others. We present each worker with a survey that corre-sponds to a specific video. The questionnaire has a number of sections presented in a single page (Figs. 4 and 5).
The first question in the survey is to annotate a number from zero to nine that is included at the end of the video. This question is included to verify that the video was correctly played, and that the worker watched the video. After this question, we ask the worker to pick one emotion that best describes the expressive content of the video. We restrict the emotional categories to four basic emotions (happy, sad, angry, neutral). Alternatively, they have the op-tion of choosingother(see Fig. 4). We expect to observe other emotional expressions elicited as a result of the spontaneous improvisation. Therefore, we also ask the workers to choose multiple emotional categories that describe the emotions in the videos. We extend the emotional categories to angry, happy, sad, frustrated, surprised, fear, depressed, excited, disgust and neutral state plus others. The workers were instructed to select all the categories that apply.
The second part of the questionnaire evaluates the ex-pressive content in terms of the emotional attributes valence (positive versus negative), activation (calm versus excited), and dominance (strong versus weak) – see Fig. 5. Using
Please rate the negative vs. positive aspect of the video Click on the image that best fits the video.
(Very Negative) <---> (Very Positive)
!
Please rate the excited vs. calm aspect of the video Click on the image that best fits the video.
(Very Excited) <---> (Very Calm)
!
Please rate the weak vs strong aspect of the video Click on the image that best fits the video.
(Very Weak) <---> (Very Strong)
!
How natural is this clip?
1 2 3 4 5
(Very Acted) <---> (Very Natural)
Fig. 5. Second section of the questionnaire used in the perceptual evaluation. The questions evaluate the emotional content of the corpus in terms of continuous dimensions (valence, activation and dominance). We also evaluate the naturalness of the recordings.
emotional primitives is an appealing approach that com-plements the information given by discrete emotional cat-egories [31], [33]. We evaluate these emotional dimensions using Likert-like scales. We includeSelf-Assessment Manikins
(SAMs) to increase the reliability of the annotations (see Fig. 5) [14]. For each question, the worker selects one out of five iconic images (“manikins”), simplifying the understating of the attribute’s meanings. Since the data is recorded from actors, we ask the worker to annotate the naturalness of the clip using a five point Likert-like scale (1-very acted, 5 very natural).
We also ask each worker to provide basic demographic information such as age and gender. Each question required an answer, and the worker was not allowed to progress without completing the entire survey. Each radio button question was initialized with no default value so that an answer had to be selected. The participants were able to view the video using a web video viewer and had access to all standard functions of the player (e.g., play, pause, scroll). They could also watch the video multiple times.
4 METRICS
TOESTIMATE
INTER-EVALUATOR
AGREEMENT
Even though the survey includes multiple questions, this study only focuses on the inter-evaluator agreement for the 5 emotional classes (anger, happiness, sadness, neutral and others). We will monitor the performance of the workers
using only this question for the sake of simplicity. Since the workers are not aware that their performance is evaluated only on this question, we expect to observe, as a side effect, higher inter-evaluator agreement in other questions. This section describes the metrics used to estimate the inter-evaluator agreement, which play an important role in the proposed online quality assessment approach.
As described in Section 3.2, the workers are asked to select one out of five options: anger, happiness, sadness, neutral and others. We require an inter-evaluator agreement metric that is robust even when it is estimated over a small reference set (e.g., five videos – see Sec. 5). The metric also has to capture the ambiguity in the emotional content, since certain videos have clear emotional content (i.e., easy tasks), while other convey mixtures of emotions (i.e., difficult tasks). We follow an approach similar to the one presented by Steidl et al. [36]. They used a metric based on entropy to assess the performance of an emotion classification system. The main idea was to compare the errors of the system by considering the underlying confusion between the labels. For example, if a video was assigned a label “sadness” even though some raters assigned the label “anger”, a system that recognizes “anger” is not completely wrong. Here, the selected metric should capture the distance between the label assigned by a worker and the set of labels pre-assigned to the reference set. An appealing approach that achieves these requirements is based on the angular similarity metric, which is described next.
The approach consists of modeling the annotations as a vector in a five dimensional space, in which each axis corresponds to an emotion (e.g., [anger, happiness, sadness, neutral, others]). For example, if a video is labeled with three votes for “anger” and two votes for “sadness”, the resulting vector is [3, 0, 2, 0, 0]. This vector representation was used by Steidl et al. [36]. We define~vs
(i)as the vector formed by
considering all the annotations from theN workers except theith worker. We also define the elementary vectorˆvs
i in
the direction of the emotion provided by theith worker (e.g., [0 0 0 1 0] for “neutral”). We estimate the angle between~vs
(i)
andˆvs
i. This angle will be0 if all the workers agree on one
emotion. The angle for the worse case scenario is90 , which happens when theN 1workers agree on one emotion but thei-th worker assigns a different emotion. We estimate this angle for each worker. The average angle for the videosis
used as the baseline value (✓s
ref – see Eq. 1). A low average value indicates that the workers consistently agree upon the emotional content in the video (e.g., easy task).
✓refs = 1 N N X i=1 arccos <~v s (i),vˆis> k~vs (i)k·kˆvsik ! (1) We estimate ✓s
ref for each target video using the an-notations collected during phase one (see Sec. 5.1, where each reference video is evaluated by five workers). After this step, we use ✓sref to estimate the agreement of new workers evaluating thesthvideo. We define~vsas the vector formed with all the annotations from phase one. We create the unitary vectorˆvs
twith the new label provided by thet-th
worker. We estimate the angle✓s
t using Equation 2. Finally,
we compute the difference between the angles ✓s
ref and✓ts
(Eq. 3). The metric ✓s
tindicates whether the new label from
thet-th worker increases the inter-evaluator agreement in the reference set. A positive value for ✓s
t (i.e., ✓sref >✓ts)
indicates that the new labels improve the agreement for videos. ✓ts= arccos ✓ <~vs,ˆvs t> k~vsk·kvˆs tk ◆ (2) ✓s t =✓sref ✓st (3)
In summary, the advantages of using this metric are: (1) we can assign a reference angle✓s
t to each individual video;
(2) by measuring the difference in angles ( ✓s
t), we can
evaluate the performance of the workers regardless of the ambiguity in the emotional content conveyed by the video; and (3) we can assign a weighted penalty to the workers for selecting minority labels.
In addition to the proposed angular similarity metric, we calculate standard inter-evaluator agreement metrics for the analysis of the annotations after the survey. We use the Fleiss’s Kappa statistic [12] for the five class emotional question. We use this metric to demonstrate that the online quality assessment method does indeed produce higher agreement. Notice that this metric is not appropriate for the online evaluation of the workers’ performance, since we have a limited number of videos in the reference set. Also, this metric penalizes choosing a larger minority class as previously discussed. The evaluations for activation, valence, dominance and naturalness are based on Likert-like scales, so the standard Fleiss’s Kappa statistic is not suitable. Instead, we use Cronbach’s alpha, where values close to 1 indicate high agreement. We report this metric for dimensional annotations, even though we do not consider the values provided by the workers in the online quality assessment.
5 O
NLINEQUALITY
ASSESSMENT
We propose an online quality assessment approach to im-prove the inter-evaluator agreement between workers an-notating the emotional content of videos. Figure 7 shows the proposed approach, which will be described in Section 5.3. We use a three phase method for our experiment. In phase one, we collect annotations on the target videos (i.e., Target - improvised dataset), which form our reference set (Sec. 5.1). In phase two, we ask workers to evaluate multiple videos per session without any quality assessment approach (Sec. 5.2). We implement this phase to define acceptable thresholds for the proposed approach. In phase three, we use the reference set to stop the survey when we detect either low quality or fatigued workers. All phases are collected from MTurk using the pre-filters as follows: At least 1 HIT completed, approval rate greater than or equal to 85%, and location within the United States. Table 1 presents the demographic information of the workers for the three phases. This section describes in detail the phases and their corresponding inter-evaluator agreements.
5.1 Phase one: Building Reference Set 5.1.1 Method
The purpose of phase one is to collect annotations for the reference set, which will be used to monitor the performance
TABLE 1
Detailed information about the perceptual evaluation conducted using crowdsourcing. The table includes the number of videos with five annotations, total number of annotations, average number of annotations per survey, cost per annotation, demographic information of workers, and the overhead associated with the online quality assessment method. (Ref.=Target - improvised, I&N=Other - improvisedplusNatural interaction).
Phase # Videos # Annotations Annotations per Surveyµ Unit Cost[USD] FGenderM µ Age Overheadµ
Phase 1 – Ref. 652 3,260 1 0 0.08 74 74 33.9 12.2 0 0
Phase 1 – I&N 100 500 1 0 0.05 40 38 32.3 12.1 0 0
Phase 2 – All 585 5,250 105 0 0.047 28 22 34.4 9.9 23.8 0
Phase 3 – All 5,562 50,248 50.0 24.4 0.047-0.05 475 279 34.0 12.3 28.0 5.0
TABLE 2
Annotations per participant for each of the phases. (Ref.=Target -improvised, I&N=Other - improvisedplusNatural interaction).
Mean Median Min Max
Phase 1 – Ref. 22.0 4.0 1 508
Phase 1 – I&N 6.4 3.0 1 50
Phase 2 – All 105.0 105 105 105
Phase 3 – All 67.9 51 30 2037
of the workers in real time. For our project, the most im-portant videos in the MSP-IMPROV corpus are the Target
- improvised videos (see discussion in Sec. 3.1). Since the
videos in the reference set will receive more annotations, we only use the 652 target videos to create the reference set. All of the videos were collected from the same 12 actors playing similar scenarios. Therefore, the workers are not aware that only the target videos are used to monitor the quality of the annotations. For the HITs of this phase, we use the Amazon’s standard questionnaire form template. We follow the conventional approach of using one HIT per survey, so each video stands as its own task. We collect five annotations per video. Since this approach corresponds to the conventional approach used in MTurk, we use these annotations as the baseline for the experiment.
During the early stages of this study, we made a few changes on the questionnaire, as we refined the survey. As a result, there are few differences in the questionnaire used in phase one compared with the one described in Section 3.2. First, the manikins for portraying activation, valence, and dominance were not added until phase two (see Fig. 5). Notice that we still used five Likert-like scales but without the pictorial representation. Second, dominance and naturalness scores were only added after halfway through phase one. Fortunately, the annotation for the five emotion class problem, which is used to monitor the quality of the workers, was exactly the same as the one used during phase two and phase three.
An interesting question is whether the inter-evaluator agreement observed in the assessment of the emotional content on target videos differs from the one observed on spontaneous videos (i.e.,Other - improvised andNatural
interaction datasets – see Sec. 3.1). Since we will compare
the results from different phases, we decide to evaluate 50 spontaneous videos from theOther - improviseddataset and 50 spontaneous videos from theNatural interaction dataset using the same survey used for phase one (see second row of Table 1 – I&N).
TABLE 3
Improvement in inter-evaluator agreement for phase two and three as measured by the proposed angular similarity metric (Eq. 3). It only considersTarget - improvisedvideos (i.e., reference set) during phases
one, two and three.
Angle Phase 1 Phase 2 Phase 3
[ ] [ ] [ ]
✓s
t 0 1.57 5.93
TABLE 4
Inter-evaluator agreement per phase in terms of kappa statistic. For phase two, only one of theTarget - improvisedvideos was evaluated by
five workers, so we do not report results for this case.
Type of Data Phase 1 Phase 2 Phase 3
# # # Target - improvised 652 0.397 1 – 648 0.497 Other - improvised 50 0.402 371 0.466 3,024 0.458 Natural interaction 50 0.404 213 0.432 1,890 0.483 All 752 0.402 585 0.466 5,562 0.487 5.1.2 Analysis
The first two rows in Table 1 describe the details about the evaluation for phase one. We received evaluations from 226 gender-balanced workers (114 females, 112 males). There is no overlap between annotators completing annotations on the target references and spontaneous sets. We do not have overhead (i.e., videos annotated to evaluate quality) for this phase since we do not use any gold metric to assess performance during the evaluation. Table 2 shows statistics of the number of videos evaluated per participant. The median number of videos per worker is 4 videos. The large difference between the median and mean for Phase 1-Ref is due to outlier workers who completed many annotations (e.g., one worker evaluated 508 videos).
Tables 3, 4 and 5 report the results. Table 3 gives the value for ✓s
t, which provides the improvement in
agree-ment over phase one, as measured by the proposed angular similarity metric (see Eq. 3). By definition, this value is zero for phase one, since the inter-evaluator agreements for this phase are considered as the reference values (✓s
ref). The first two columns of Table 4 report the inter-evaluator agreement in terms of the kappa statistic (primary emotions – five class problem). Each of the 652 videos were evaluated by five workers. The agreement between annotators is similar for target videos and spontaneous videos (Other - improvised
and Natural interaction datasets). In each case, the kappa
statistic is about =0.4. We conclude that we can use the target videos as our reference set for the rest of the evalua-tion.
TABLE 5
Cronbach’s alpha statistic for the emotional dimensions valence (Val.), activation (Act.), and dominance (Dom.). We also estimate the agreement for naturalness (Nat.). (Ref.=Target - improvised, I&N=
Other - improvisedplusNatural interaction).
Phase Val. Act. Dom. Nat.
Phase 1 – Ref. 0.84 0.79 – 0.23
Phase 1 – I&N 0.88 0.85 – 0.57
Phase 2 – All 0.86 0.70 0.57 0.46
Phase 3 – All 0.89 0.73 0.54 0.44
The first two rows of Table 5 show the inter-evaluator agreement for the emotional dimensions valence and acti-vation (we did not evaluate dominance in phase one). All the values are above or close to↵=0.8, which is considered as high agreement. We observe higher agreement for spon-taneous videos (i.e.,Other - improvisedandNatural interaction
datasets) than for reference videos. Table 5 also reports the Cronbach’s alpha statistic for the perception of naturalness. The agreement for this question is lower than the inter-evaluator agreement for emotional dimensions, highlighting the level of difficulty in assessing perception of naturalness. 5.2 Phase Two: Analysis of Workers’ Performance 5.2.1 Method
Phase two aims to understand the performance of work-ers evaluating multiple videos per HIT (105 videos). The analysis demonstrates a drop in performance due to fatigue over time as workers take a lengthy survey. The analysis also serves to identify thresholds to stop the survey when the performance of the worker drops below the acceptable levels.
The approach for this phase consists of interleaving videos from the reference set (i.e., Target - improvised) with the spontaneous videos. Since the emotional content for the reference set is known (phase one), we use these videos to estimate the inter-evaluator agreement as a function of time. We randomly group the reference videos into sets of five. We manually modify the groups to avoid cases in which the same target sentence was spoken with two different emotions, since these cases would look suspicious to the workers. After this step, we create different surveys consisting of 105 videos. We stagger a set of five reference videos every 20 spontaneous videos creating the following pattern [5, 20, 5, 20, 5, 20, 5, 20, 5]. We use the individual sets of five reference videos to estimate the inter-evaluator agreement at that particular stage in the survey.
In this approach, the number of consecutive videos in the reference set should be high enough to consistently estimate the worker’s performance. Also, the placement of the reference set should be frequent enough to identify early signs of fatigue. Unfortunately, these two requirements increase the overhead produced by including reference sets in the evaluation. The number of reference videos (five) and spontaneous videos (twenty) were selected to balance the tradeoff between precision and overhead.
We released a HIT on Amazon Turk with 50 assignments (50 assignments ⇥ 105 videos = 5,250 annotations – see Table 1). The HIT was placed using Amazon’s External HIT framework using our own server (we need multiple
0 30 60 90 120 −10 −5 0 5 10 15 Time [Minutes] ∆ θ s t
Set 1 Set 2 Set 3 Set 4 Set 5
Fig. 6. Average performance versus time for phase two. The error bars represent a 95% confidence interval (Tukey’s multiple comparisons procedure). We report the inter-evaluator agreement using ✓s
t (Eq. 3). The circles correspond to the five quality control points in the survey. The horizontal line represents the quality achieved during phase one.
annotations per HIT, which is not supported by Amazon’s standard questionnaire form template). We used a MS SQL database for data recording. We use the surveys described in Section 3.2. In this phase, we do not punish a worker for being fatigued; we let them finish the survey.
5.2.2 Analysis
For phase two, we collected 50 surveys in total, each con-sisting of 105 videos using the pattern described in Section 5.2.1 (see third row in Table 2). From this evaluation, we only have 585 videos with five annotations (see Table 1). Some of the videos were evaluated by less than five workers, so we do not consider them in this analysis. Since we are including reference videos in the evaluation, the overhead is approximately 24% (i.e., 25 out of 105 videos).
Table 3 shows that the difference in the angle for the evaluations in phase two is about 1.57 higher than phase one. Table 4 shows an increase in kappa statistic for this phase, which is now=0.466. The only difference in phase two is that the annotators are asked to complete multiple videos, as opposed to the one video per HIT framework used in phase one. These two results suggest that increasing the number of videos per HIT is useful to improve the inter-evaluator agreement. We hypothesize a learning curve where the worker gets familiar with the task, providing better annotations. This is the reason we are interested in refining a multiple HIT annotation method, where we monitor the performance of the worker in real-time.
The third row in Table 5 gives the inter-evaluator agree-ment for the emotional dimensions. The results from phase one and two cannot be directly compared, since the ques-tionnaires for these phases were different, as described in Section 5.1.1 (use of manikins, evaluation of dominance). The inter-evaluator agreement for dominance is ↵=0.57, which is lower than the agreement achieved for valence (↵=0.86) and activation (↵=0.70).
The results from this phase provide insight into the workers’ performance as function of time. As described in Section 5.2.1, we insert five sets of five reference videos in the evaluation – we use the [5, 20, 5, 20, 5, 20, 5, 20, 5] pat-tern. We estimate ✓s
Figure 6 shows the average results across the 50 evaluations in phase two. We compute the 95% confidence intervals using the Tukey’s multiple comparisons procedure with equal sample size. The horizontal axis provides the average time in which each set was completed (i.e., the third set was completed on average at the 60 minute mark). The solid horizontal line gives the performance achieved in phase one. Values above this line correspond to improvement in inter-evaluator agreement over the baseline from phase one. Figure 6 shows that, at some point, the workers tire or lose interest, and their performance drops. We compute the one-tailed large-sample hypothesis test about mean differences between the annotations in Set 2 and Set 5. The test reveals that the quality significantly drops between these sets (p -value=0.0037 – asserting significance at p <0.05). On av-erage, we observe this trend after 40 minutes. However, the standard deviation in the performance is large, implying big differences in performance across workers. Fixing the num-ber of videos per survey is better than one video per HIT, but it is not an optimal approach due to the differences in the exact time when workers start dropping their performance. The proposed approach, instead, can monitor the quality of the workers in real time, stopping the evaluation as soon as the quality drops below an acceptable level due to fatigue or lack of interest.
5.3 Phase Three: Online Quality Assessment 5.3.1 Method
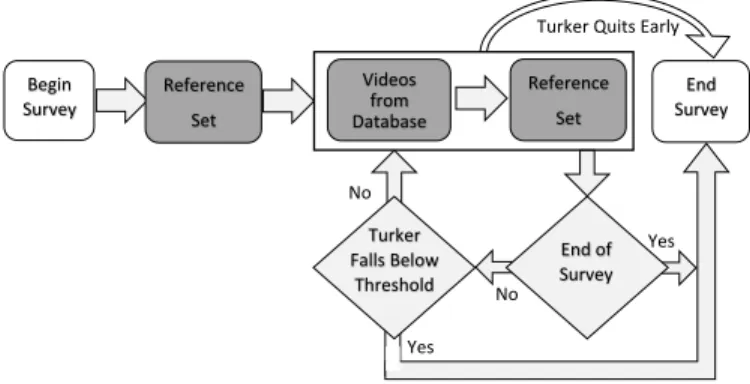
After the experience gained on phase one and two, we develop the proposed approach to assess the quality of the annotators in real-time. Figure 7 describes the block diagram of the system. In the current implementation, the workers complete a reference set. Following the approach used in phase two, each reference set consists in five videos with known labels from phase one. Then, we let the worker evaluate 20 videos followed by five more reference videos. Therefore, the minimum number of videos per HIT in this phase is 30. If the worker does not submit the annotations for these videos, the HIT is discarded and not included in the analysis. At this point, we have two reference sets evaluated by the workers. We estimate the average value for ✓s
t(see Eq. 3). If this value is greater than a predefined
threshold, the worker is allowed to continue with the survey. At this point, the worker can leave the evaluation at any time. Every 20 videos, we include five reference videos, evaluating the performance of the worker. We stop the per-formance if the quality is below the threshold. This process continues until (1) the worker completes 105 videos (end of survey), (2) we stop the evaluation (worker falls below threshold), or (3) the worker decides to stop the evaluation (worker quits early).
An important parameter in the proposed approach is the threshold for ✓s
t used to stop the evaluation. If this
threshold is set too high, we would stop most of the eval-uations after few iterations, increasing the time to collect the evaluation. If the threshold is set too low, the quality will be compromised. Based on the results in Figure 6, we decide to stop the evaluation when ✓s
t=0. At this
point, the inter-evaluator agreement of the workers would be similar to the agreement observed in phase one (see
! ! Begin! Survey! Reference! Set! End! Survey! No! Turker!Quits!Early! Reference! Set! ! ! End!of! Survey! Turker!! Falls!Below! Threshold! Yes! No! Videos!!!! from! Database! Yes!
Fig. 7. Diagram for the proposed online quality assessment evaluation (phase three). The evaluation stops when (1) the quality of the hits drops below a threshold, (2) the workers quit, or (3) the survey is completed.
discussion in Sec. 6.1.3). Furthermore, even when workers provide high quality data early in the survey, they may tire or lose interest. If ✓s
t <-0.2 (empirically set), we
discard the annotations collected after their last successful quality control. This approach also discards the data from workers that provide unreliable data from the beginning of the survey. This second threshold removes about 15% of the annotations.
For this phase, we use the MTurk bonus system to dynamically adjust the payment according to the number of videos evaluated by the worker. We continuously display the monetary reward in the webpage to encourage the worker to continue with the evaluation. We emphasize that the particular details in the implementation such as the order, the number of reference videos, and the thresholds can be easily changed depending on the task.
5.3.2 Analysis
The last row of Table 1 gives the information about this phase. Phase three consists of 50,248 annotations of videos, where 5,562 videos received at least five annotations. This set includes videos from Target - improvised,Other - impro-visedandNatural interactiondatasets. The median number of videos evaluated per worker is 51 (Table 2). In phase three, the evaluation can stop after 30 videos, if the quality pro-vided by the worker is below the threshold (i.e., minimum number of videos evaluated per worker is 30 – Table 2). In these cases, 10 videos out of the 30 correspond to reference videos. Therefore, the overhead for this phase is larger than the overhead in phase two (28%). Unlike other phases, the gender proportions are unbalanced, with a higher female population.
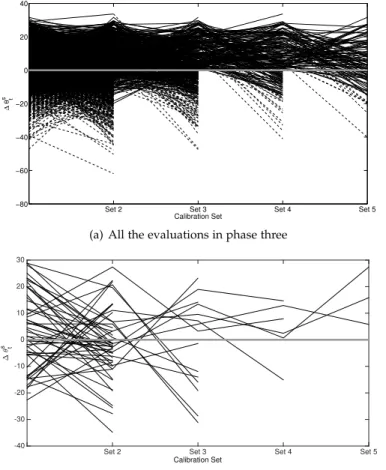
Figure 8(a) shows the evaluation progression across workers for all the evaluations. The horizontal axis pro-vides the evaluation points where we assess the quality of the workers. As explained in Section 5.3.1, we begin to stop evaluations after the second evaluation point. The workers completed 20 videos between evaluation points. We added a gray horizontal line to highlight the selected threshold. We use dashed lines to highlight the annotations that are discarded after applying the second threshold when
✓s
t < 0.2 (see Sec. 5.3.1). Figure 8(b) shows 50
evalu-ations randomly sampled to better visualize and track the trends per worker. The figures illustrate the benefits of the
Set 2 Set 3 Set 4 Set 5 −80 −60 −40 −20 0 20 40 ∆ θ s t Calibration Set
(a) All the evaluations in phase three
Calibration Set
Set 2 Set 3 Set 4 Set 5
∆ θ s t -40 -30 -20 -10 0 10 20 30
(b) 50 evaluations sampled at random in phase three Fig. 8. Progression of the evaluation during phase three. The gray solid line shows the baseline performance from phase one (a) global trends across all the evaluations, and (b) performance for 50 randomly selected evaluations to visualize trends per worker.
approach, where evaluations are stopped when ✓s t was
less than zero. By comparing the performance with the gray line at ✓s
t = 0, we can directly observe the improvement
in performance over the ones achieved in phase one (most of the evaluations are over the gray line).
Figure 9 shows the percentage of the evaluations that ended after each of the evaluation points (starting from the second check point). It also shows the percentage that quit the evaluation at any point. The figure shows that only 7.7% of the workers reached the fifth evaluation point, finishing the entire survey. In 33.8% of the evaluations, the worker decided to quit the survey, usually between set 2 and set 3. Notice that paid workers were allowed to quit only after set 2. Our method stopped 58.5% of the evaluations due to low inter-evaluator agreement provided by the workers.
As explained in Section 4, we evaluate the performance of the workers in terms of the proposed angular similarity metric. Table 3 shows that the angle is higher than the angles for phase one (single video per HIT) and two (multiple videos without online quality assessment). We achieve a 377% relative improvement on this metric between phase two and three (from 1.57 to 5.93 ). This result demonstrates the benefits of using the proposed approach in crowdsourc-ing tasks.
Table 4 shows the inter-evaluator agreement in terms of kappa statistics. For some videos, especially our reference
0 10 20 30 40 50 [%]
Set 2 Set 3 Set 4 Set 5 Quit [S2 −S3] Quit [S3 −S4] Quit [S4 −S5]
Fig. 9. Percentage of the evaluations that ended either after each of the evaluation points (starting from the second check point), or after the worker decided to quit the survey.
videos, we collect more than five annotations. In these cases, we randomly select five of them to estimate this statistic. We repeat this approach 10 times, and we report the average kappa statistic value. The kappa statistic for phase three is higher than the ones achieved in phase one and two. An interesting case is the performance achieved over the reference videos (i.e.,Target - improvised). When we compare the kappa statistic for phase one and three, we observe im-provement from=0.397 to=0.497 (relative improvement of 25.2%). For the entire corpus, the kappa statistic increases from=0.402 to=0.487 (relative improvement of 21.1%). To assess whether the differences are statistically significant, we use the two-tailed z-test proposed by Congalton and Green [7]. We assert significance when p <0.05. In both cases, we observe that the improvement between phases is significant (p-value <0.05). Furthermore, we are able to evaluate the corpus with five annotations per video, which is higher than what is feasible in laboratory conditions when the size of the corpus is large. Notice that the reference videos were evaluated on average by 20.0 workers.
The last row of Table 5 gives the Cronbach’s alpha statistic for valence, activation and dominance. The inter-evaluator agreement values are very similar to the ones reported for phase two. Notice that we do not include this metric in the assessment of the workers’s performance. Therefore, we do not observe the same improvements achieved on the five-class emotional problem. Our future work will consider a multidimensional metric that incorpo-rates the workers’ performance across all questions in the survey.
6 A
NALYSIS ANDDISCUSSION
This section analyzes the labels derived from the proposed online quality assessment method (Section 6.1). We compare the method with common pre-filter and post-filter methods (Section 6.2), and we briefly describe the emotional content of the corpus (Section 6.3). This section will also discuss how to generalize this approach to other problems (Section 6.4) and the limitations of implementing this approach (Section 6.5).
0 < t < 30s 30s < t <60s 60s < t < 100s 100s < t 0 5 10 ∆ θ s t
Fig. 10. Performance of the annotation in terms of the time taken by participants to assess each video. The quality decreases when the duration of the annotation increases.
6.1 Analysis of the workers’ Performance 6.1.1 Time Versus Quality
Many studies have proposed post-filters to eliminate HITs when the duration to complete the task is higher than a given threshold [6]. Given the size of this evaluation (59,341 annotations), we can study the relationship between time per annotation and quality of the ratings. For phase three, we group the annotations into four groups according to the time taken to complete the annotation (0 < t30s,30s < t 60s,60s < t100and100s t). Figure 10 gives the average values for ✓s
t for videos within each group. The
quality of the ratings is inversely related to the time required to complete the task. A longer duration may be correlated with fatigue, as the annotators fail to keep their focus in the task. Figure 6 shows that the average time between the last two reference sets in phase two is longer (approximately 30 minutes), supporting this hypothesis. This result suggests that removing annotations with longer durations is effective, which can be included in future extension of this work by stopping the evaluation when average duration is above a threshold.
6.1.2 Learning Effect
Figure 6 suggests a learning effect in phase two, where workers improve their performance after evaluating mul-tiple videos. When we compare the kappa statistic between phase one (=0.402) and phase two (=0.466) the differences
are significantly different (two-tailed z-test proposed by Congalton and Green [7], with p-value =1.49e-10). Since the only difference between these phases is the number of videos included in each HIT, we conclude that there is a benefit in evaluating multiple videos.
An interesting question is whether we observe learning effect on phase one, where we allow workers to complete multiple one-video HITs. To address this questions, we remove the first five annotations provided by each worker in phase one for the videos from the reference sets. Then, we measure the Fleiss’s Kappa from the remaining annotations (Phase 1- Ref.). If we consider only the videos with five annotations (337 videos), we observe that the agreement is =0.417. If we estimate the Fleiss’s Kappa statistic over videos with at least four annotations (563 videos), the agree-ment is=0.412. These results show a modest improvement from kappa statistics for phase one (=0.397 – Table 4).
6.1.3 Setting a Threshold Based on Performance
Notice that the labels from phase one are only used as reference (see Eq. 3). We only evaluate whether the new annotations in phase three increase or reduce the agreement observed in phase one (changes in ✓s
t). Therefore, we 0 10 14 20 30 40 50 4 6 8 10 12 14 16 Threshold θ ∆ θ s t
Fig. 11. Evaluation conducted to set the threshold to stop the evaluation. The analysis was simulated over the results from Phase 2. The peak of performance is achieved with ✓s
t< 14 .
hypothesize that increasing the agreement of the reference set won’t change the results reported here. Setting a suitable threshold for ✓s
t is more important than having slightly
higher agreement in the reference set.
Initially, we use the results from phase two to set the threshold by simulating the online quality assessment algo-rithm over the 50 evaluations. We only kept the evaluations until the performance dropped below a given threshold. We estimated the average angular similarity metric as a function of this threshold. Figure 11 shows the expected performance that we would have achieved in phase two if we had imple-mented the different values of the threshold. This analysis led us to stop the evaluation when ✓s
t < 14 . This
threshold is lower than ✓s
t= 0 used in the final evaluation,
resulting in more forgiving setting. After a small subset of the evaluations was collected, we determined that the amount of rejected workers was quite low, and the overall quality of the data was not improving as we expected. Our initial results showed an improvement in the angular similarity metric of only 3.65 , a lower performance than the one achieved by rejecting workers with ✓s
t <0(5.93 –
see Table 3). We realized that “good” workers in phase three can quit, which was not the case in phase two. Using a more strict threshold increased the quality in the evaluation. 6.2 Comparison to other Methods
This section compares the proposed approach with com-mon pre-filter and post-filter approaches. We conduct a small case study, where we release a set of evaluations to annotate 100 videos from the Target - improvised dataset. We request five annotations per video resulting in 500 HITs, using the same questionnaire of phase one (Figs. 4 and 5). Unlike the loose pre-filters chosen for our original phase one (85% approval rate living in the United States), we require workers living in the United States who have completed at least 100 HITs at an approval rate of 98%. By raising the requirements, we aim to replicate pre-processing methods that aim to improve the quality by restricting the evaluation to more qualified workers. In total, 31 workers participated in this evaluation. The Fleiss’ kappa achieved with this method is only=0.35. We can directly compare
the pre-filter method with the results obtained from phase three when we only consider the same set of 100 videos (four videos were discarded since they were not evaluated five time in phase three). When we consider the first five annotations per video, the Fleiss’ kappa is =0.599. The
difference is statistically significant (two-tailed z-test, 0.05 threshold, with p-value < 0.05). The pre-filter method is also statistically lower than the quality achieved by our method across all the turns (=0.487 – see Table 4). When we estimate the angular similarity metric, ✓s
t, the average
angular difference is ✓st =-4.58 for the pre-filter method.
The negative sign implies that the quality is even lower than the results achieved in phase one with less restrictive requirements. Studies have shown that increasing filter on workers prior acceptance rate does not necessary increases the inter-evaluator agreement. Eickhoff and de Vries [11] showed that adding a 99% acceptance rate pre-filter gives a minor decrease in cheating (from 18.5% to 17.7%), while restricting the evaluations to workers in the the United States reduces cheating from 18.5% to 5.4%. Morris and McDuff [23] highlighted that workers can easily boost their performance ratings. In contrast, our method increases the angular similarity metric to ✓s
t = 5.93 ( ✓st = 7.36
when we only consider the videos selected for this evalu-ation).
We also explore post-processing methods. The most com-mon method is to remove the workers with lower inter-evaluator agreement (e.g., the lower 10th percentile of the annotators [26]). Following this approach, we remove the worst three workers, who were identified by estimating the difference in Fleiss Kappa statistic achieved with and without each worker. When the worker is included, the evaluation considers five annotators, and when the worker is excluded, the kappa statistic is estimated from four anno-tators. The average angular similarity metric increases to
✓s
t =-2.61 . This value is still lower than our proposed
method ( ✓s
t = 5.93 – Table 3).
6.3 Emotional Content of the Corpus
This section briefly describes the emotional content of the corpus for all the datasets. Considering all the phases, the mean number of annotations per dataset is as follows: (standard deviations in parentheses):Target - improvised28.2 (4.6);Other - improvised5.3 (1.0); and,Natural interaction5.4 (1.1). Further details are provided in Busso et al. [5].
For the 5 emotional classes (anger, happiness, sadness, neutral and others), we derive consensus labels using ma-jority vote. Table 6 gives the confusion matrix between the consensus labels and the individual annotations. The table also provides labels assigned to videos without majority vote agreement (“WA” column). The main confusions in the table are between emotional classes and neutrality (fourth row). All other confusions between classes are less than 8%. We estimated the average scores assigned to videos for valence, activation and dominance. Figure 12 gives the distribution for these emotional attributes for all the videos in the MSP-IMPROV corpus. While many of the videos received neutral scores (⇡ 3), there are many turns with low and high values of valence, activation, and dominance. The corpus provides a useful resource to study emotional behaviors.
TABLE 6
Confusion matrix between individual annotations and consensus labels derived with majority vote (WA: without agreement).
Majority Vote
Angry Sad Happy Neutral Others WA
Annotations Ang 0.76 0.03 0.02 0.04 0.07 0.13 Sad 0.04 0.79 0.01 0.07 0.08 0.15 Hap 0.02 0.01 0.86 0.08 0.07 0.20 Neu 0.12 0.13 0.10 0.76 0.19 0.38 Oth 0.06 0.04 0.02 0.05 0.58 0.14
6.4 Generalization of the Framework for other Tasks We highlight that the results and methodology presented in this study also extend to other fields relying on repetitive tasks performed by na¨ıve annotators without advanced qualifications (video and audio transcriptions, object detec-tion, text transladetec-tion, event detecdetec-tion, video segmentation). This section describes the steps to implement or adapt the proposed online quality assessment system.
Figure 1 shows the conceptual framework behind the proposed approach. The first step is to pre-evaluate a reduced set of the tasks to define the reference set. We emphasize that this set should be similar to the rest of the tasks so the participants are not aware when they are being evaluated. The second step is to create surveys where videos from the reference set and the rest of the annotations are interleaved. An important aspect is defining how many and how often to add reference questions in the HIT. In the design used in our study, the time between evaluation points was probably too long (Fig. 6). In retrospect, increas-ing the time resolution may have resulted in a more precise detection of the stopping point in the evaluation (e.g., by including reduced number of reference sets, but more often). An interesting application of the proposed approach is online training of workers. By using the proposed online quality assessment, the workers can learn from early mis-takes, steepening the learning curve.
The standard questionnaire template from MTurk does not support a multi-page, multi-question survey with real-time quality metric tracking estimation. Our implementa-tion uses a HTML + Javascript front end that is compatible with most modern browsers paired with a PHP backend to load data into a MS SQL database. Our media, code, and database are hosted on a web-enabled server. This code is implemented in MTurk with the help of the External HIT framework. We plan to release our code as open source to the community, along with documentation so that the setup is easy to repeat. We hope that this will allow other researchers to build and improve our approach.
6.5 Limitations of the Approach
One challenge of the proposed approach is recruiting many workers in a short amount of time. It seems that workers would rather complete many short HITs than completing long surveys. We used the bonus system to reward the workers based on the number of evaluated videos. There-fore, the workers may not have realized that providing quality annotations was more convenient for them than completing other available short hits (the listing of the HIT only had the base payment for the first 30 videos).
1 2 3 4 5 0 600 1200 1800 (a) Valence 1 2 3 4 5 0 600 1200 1800 (b) Activation 1 2 3 4 5 0 600 1200 1800 2400 3000 (c) Dominance Fig. 12. Distribution of scores assigned to the videos for (a) valence, (b) activation, and (c) dominance.
Furthermore, the evaluation should be designed with time to accommodate for the annotation of the reference set.
Another limitation of the approach is the 28% over-head due to the reference sets (Table 1 - phase three). The overhead can be reduced by modifying the design of the evaluation (e.g., evaluating the quality with fewer videos, increasing the time between check points). In our case, collecting extra annotations for the reference set was not a problem sinceTarget - improvisedare the most important videos for our project. These 652 videos have at least 20 annotations on average, providing a unique dataset to ex-plore interesting questions about how to annotate emotions (e.g., studying the balance between quantity and quality in the annotations, comparing errors made by classifiers and humans).
The Fleiss’ kappa values achieved by the proposed ap-proach are generally considered to fall in the “moderate agreement” range. Emotional behaviors in conversational speech convey ambiguous emotions, making the perceptual evaluation a challenging task. Many of the related studies reporting perceptual evaluations in controlled conditions have reported low inter-evaluator agreement [4], [9], [15]. Metallinou and Narayanan [21] showed low agreement even for annotations completed by the same rater multiple times. We are exploring complementary approaches to in-crease agreement between workers that are appropriate for crowdsourcing evaluations.
7 C
ONCLUSIONSThis paper explored a novel way of conducting emotional analysis using crowdsourcing. Our method used online quality assessment, stopping the evaluation when the qual-ity of the worker drops below a threshold. The paper pre-sented a systematic evaluation consisting of three phases. The first phase collected emotional labels for our reference set (one video per HIT). The second phase consisted of a sequence of videos where we staggered videos from our reference set. This phase revealed the behavior of workers completing multiple videos per HITs. We found that evalu-ating multiple videos provided better inter-evaluator agree-ment than evaluating one video per HIT. The results from this phase also revealed a drop in performance associated with fatigue, starting approximately after 40 minutes. Phase three presented our novel approach, where videos from the reference set were included in the evaluation, facilitating the evaluation in real time of the inter-evaluator agreement provided by the worker. With this information, we stopped
the survey when the quality drops below a given threshold. As a result, we effectively mitigated the problem of fatigue or lack of interest by using reference videos to monitor the quality of the evaluations. We improved inter-evaluator agreement by approximately six degrees as measured by the proposed angular similarity metric (Eq. 3, Table 3). The annotation with this approach also produced higher agreement in terms of kappa statistic.
An important aspect of the approach is that the reference videos are similar to the rest of the videos to be evaluated. As a result, the worker is not aware when he/she is being evaluated, solving an intrinsic problem in detecting spam-mers using crowdsourcing. By including reference videos across the evaluation, we were able to detect early signs of fatigue or lack of interest. This is an important benefit of the proposed approach, which is not possible with other filter-ing techniques used in crowdsourcfilter-ing based evaluations.
Further work on this project includes creating a multi-dimensional filter that considers not only the primary emo-tion, but also other part of the survey. In phase three, we do not observe improvements in inter-evaluator agreement for valence, activation, and dominance. An open question is to explore potential improvements by considering comprehen-sive metrics capturing all the facets of the survey.
ACKNOWLEDGMENTS
The authors would like to thank Emily Mower Provost for the discussion and suggestions on this project. This study was funded byNational Science Foundation (NSF) grant IIS 1217104 and a NSF CAREER award (IIS-1453781).
REFERENCES
[1] C. Akkaya, A. Conrad, J. Wiebe, and R. Mihalcea, “Amazon Mechanical Turk for subjectivity word sense disambiguation,” in
NAACL HLT 2010 Workshop on Creating Speech and Language Data with Amazon’s Mechanical Turk, Los Angeles, CA, USA, June 2010, pp. 195–203.
[2] V. Ambati, S. Vogel, and J. Carbonell, “Active learning and
crowd-sourcing for machine translation,” in International conference on
Language Resources and Evaluation (LREC 2010), Valletta, Malta, May 2010, pp. 2169–2174.
[3] S. Buchholz and J. Latorre, “Crowdsourcing preference tests, and
how to detect cheating,” inInterspeech 2011, Florence, Italy, August
2011, pp. 3053–3056.
[4] C. Busso, M. Bulut, and S. Narayanan, “Toward effective
auto-matic recognition systems of emotion in speech,” inSocial emotions
in nature and artifact: emotions in human and human-computer
interac-tion, J. Gratch and S. Marsella, Eds. New York, NY, USA: Oxford