Documents de Treball
THE EFFECT OF RELATIONSHIP LENDING
ON FIRM PERFORMANCE
Judit Montoriol Garriga
Document de Treball núm. 06/5
© Judit Montoriol Garriga
Coordinador / Coordinator Documents de treball:
David Urbano http://selene.uab.es/dep-economia-empresa/recerca/Documents.htm e-mail: david.urbano@uab.es Telèfon / Phone: +34 93 5814298 Fax: +34 93 5812555 Edita / Publisher:
Departament d'Economia de l'Empresa http://selene.uab.es/dep-economia-empresa/ Universitat Autònoma de Barcelona
Facultat de Ciències Econòmiques i Empresarials Edifici B
08193 Bellaterra (Cerdanyola del Vallès), Spain Tel. 93 5811209
Juny / June, 2006
THE EFFECT OF RELATIONSHIP LENDING
ON FIRM PERFORMANCE
Judit Montoriol Garriga
Document de Treball núm. 06/5
La sèrie Documents de treballd'economia de l'empresa presenta els avanços i resultats d'inves-tigacions en curs que han estat presentades i discutides en aquest departament; això no obstant, les opinions són responsabilitat dels autors. El document no pot ser reproduït total ni parcial-ment sense el consentiparcial-ment de l'autor/a o autors/res. Dirigir els coparcial-mentaris i suggerències direc-tament a l'autor/a o autors/res, a la direcció que apareix a la pàgina següent.
A Working Paper in the Documents de treballd'economia de l'empresa series is intended as a mean whereby a faculty researcher's thoughts and findings may be communicated to interested readers for their comments. Nevertheless, the ideas put forwards are responsibility of the au-thor. Accordingly a Working Paper should not be quoted nor the data referred to without the written consent of the author. Please, direct your comments and suggestions to the author, which address shows up in the next page.
.
The Effect of Relationship Lending
on Firm Performance
Judit Montoriol Garriga
1Universitat Aut`onoma de Barcelona Universitat Pompeu Fabra
June 30, 2006
Abstract
We examine how relationship lending affects firm performance using a panel dataset of about 70,000 small and medium Spanish firms in the period 1993-2004. We model firm performance jointly with the firm’s choice of the number of bank relationships. Controlling for firm fixed effects and using instrumental variables for the decision on the number of bank relationships, we find that firms maintaining exclusive bank relationships have lower profitability. The result is consistent with the view that banks appropriate most of the value generated through close relationships with its borrowers as long as they do not face competition from other lenders.
1I would like to thank Vicente Cu˜nat for his valuable advice. I would also like to thank Santiago Carb´o, Anthony Saunders, Natalia Utrero and seminar participants at the First Fall Workshop on Economics in Granada (October 2005), the Workshop on Social Capital, Relationship Banking and Firm Financial Conditions in Castell´o de la Plana (January 2006), the Spring Meeting of Young Economists (May 2006) and seminar participants at Universitat Aut`onoma de Barcelona (June 2006) for very useful comments and suggestions. All errors are mine. Financial support from Banco Herrero Ayuda a la Investigaci´on 2005 is greatly appreciated. Contact email: judit.montoriol@uab.es
1
Introduction
Long-term ties between main banks and their client firms generate value and increase economic efficiency.2 Little is known, though, on how this value is divided among the
stakeholders involved in such relationships. The asymmetric role played by the lender and the borrower while building the relationship implies that the direct recipient of the benefits of close relationships is the lender. To the extent that the lender passes these benefits to the borrower, relationships will also be valuable from the borrower’s point of view. In this paper some doubt is cast on banks sharing the benefits of lending relationships by examining the performance of firms with close bank relationships, with respect to firms without those relationships with its lenders.
The modern literature on financial intermediation has long emphasized the value-creation function of lending relationships. In a context of asymmetric information in the credit markets, lending relationships facilitate the information exchange between the borrower and the lender through repeated interaction over the duration of the relationship and through the provision of multiple financial services. Lenders invest in generating information from their client firms and borrowers are more inclined to disclose information (Boot, 2000). In consequence, the information asymmetries between the bank and the firm are lessened as time goes by. This enhances eco-nomic efficiency through many channels. First, having a long-term horizon permits the design of implicit credit contracts over the duration of the relationships that in-crease value. This is achieved, for instance, through reduction in welfare-dissipating collateral requirements (Berger and Udell, 1995), through the deployment of welfare-enhancing intertemporal tax-subsidy schemes in loan pricing (Petersen and Rajan, 1995), as well as through more flexible contracting terms (Boot, Greenbaum and Thakor, 1993).3 Second, the reusability of the information generated by the lender
over repeated transactions and over time is also beneficial in terms of savings on the fixed cost of screening and monitoring (Boot, Greenbaum and Thakor, 1993). Third, it avoids the free-rider problem of monitoring since the bank internalizes the bene-fits of such investments. Higher monitoring levels increase value since, for instance, they help solve principal-agent problems of managerial behavior. Additionally,
rela-2Recent empirical evidence provides support for the importance of bank relationships to small firms in terms of both credit availability and loan contract terms such as loan interest rates and collateral requirements. See, for instance, Petersen and Rajan 1994, 1995, Berger and Udell 1995, Cole 1998, Elsas and Krahnen 1998, Harhoff and K¨orting 1998
3This greater flexibility of loan contracts could be welfare dissipating if the soft-budget constraint problem is acute.
tionship banks develop sector-specific expertise that enhances the value of financed projects (Boot and Thakor, 2000). What is more, relationship lending contributes greatly to economic growth by promoting the efficient allocation of capital as long as better informed banks provide credit to the most productive projects first (Northcott, 2004).
At the same time, close bank-firm relationships entail some costs to the firm. On the one hand, having a single relationship gives an informational monopoly to the only informed bank, which can impose hold-up costs for the firm. On the other hand, the soft-budget constraint problem is more likely to happen when only one lender has to option to bail out the firm in case of distress. Existing empirical research on relationship lending stresses that benefits outweigh the costs, that is, relationships generate value.
Only to the extent that such value creation is passed on to or shared with the borrower, through lower cost of borrowing, more flexible contract terms, and so on, a relationship will also be valuable for a firm that borrows from its relationship lender. That is to say, a firm will benefit from relationship lending as long as the bank shares the value with the borrower. However, whether firms that have a single bank relationship outperform firms with multiple bank relationships has not been investigated yet. We address this issue in this paper. If lending relationships are valuable, it should be reflected in firm performance. We test whether the intensity of banking relationships, measured by the number of bank relationships, benefits firms in terms of their profitability and growth.
This hypothesis is tested using a panel dataset of small and medium sized Spanish firms in the period 1993-2004. We focus on small firms for various reasons. First, small firms are more likely to suffer information problems in the capital markets. The value of relationship lending, which is based on a bank gathering soft information, is likely to be higher for the smallest, youngest and most opaque firms because of the lack of credit history, the impossibility to credibly disclose their quality, and the lack of separation between ownership and management, which increases the asymmetric information between insiders and outsiders (lenders). Second, small firms are typically restricted to obtaining external finance only from financial institutions. Public debt markets are only accessible for large firms. While little more than 500 Spanish companies access the capital market, more than 2.5 million small firm rely on financial intermediaries to finance their investment projects (Cardone, Casasola and Sanmart´ın, 2005). Third, small firms are extremely important for the Spanish economy: roughly 50% of the 3
million Spanish firms do not have employees, 1.3 million have between one and nine employees. About 180,000 firms have between 10 and 499 employees and only 1,700 Spanish firms have more than 500 employees.
Previous empirical literature has already investigated the relationship between bank relationships and firm performance. Degryse and Ongena (2001) use a panel dataset of 235 publicly listed Norwegian firms between 1979 and 1995 and find that firms with a bilateral relationship are more profitable. Fok et al. (2004) examine 178 firms traded on the Taiwan Stock Exchange between 1994 and 1998. They find that the number of foreign-bank relationships is positively related to firm performance; however, the number of domestic-bank relationships is negatively related to firm per-formance. Since domestic-bank loans are more likely to be relationship loans, the results are interpreted as evidence that bilateral relationships are profitable. A pa-per with opposite results is Weinstein and Yafeh (1998).They analyze 6836 Japanese firms in the period 1977-1986 and find that firms with close ties to their lenders ex-hibit slow growth rates and lower profitability. That shows that in Japan most of the benefits of bank-firm relationships are appropriated by the banks. However, none of the existing papers has empirically examined this relationship for small firms. As explained above, bank relationships are particularly important for small firms. This paper will contribute to the existing literature by providing empirical evidence for small firms.
This paper is also related to a branch of empirical papers that measures the im-pact on a firm’s stock price when information about a bank relationship is revealed. Fama (1985) argues that bank-firm relationships are important since they affect a firm’s ability to raise capital, from both within the bank and other non-bank sources. Based on that observation, James (1987) compares the stock price reaction to an-nouncements of private and public debt and bank loans. He finds that bank loans announcements are associated with positive and statistically significant stock price reactions, while announcements of private and public debt are not followed by such a response. Numerous event studies have expanded the results in James (1987).4
How-ever, since the analysis relies on the stock price reaction, this type of event studies can only be implemented for large, listed firms. Given our interest in measuring the value of bank relationships for small firms, we need another methodology that will be presented in the next section. Section 3 describes the dataset. We present the
4Slovin, Sushka and Hudson (1988), James and Wier (1990), Slovin and Young (1990), Billet et al. (1995) and Shockley and Thakor (1998) among others.
regression results in section 4 and the robustness checks in section 5. The last section concludes.
2
Empirical Strategy
To assess the impact of bank relationships on firm performance, we start by regressing a measure of firm performance on a bank relationships measure, controlling for firm-specific fixed-effects, firm age, size and other financial characteristics of the firm. The basic regression model has the following form:
F irm P erf ormance Measureit = β0+β1Measure of Bank Relationshipsit+
+ β2F irm ageit+β3F irm sizeit+
+ β F inancial Characteristicsit+
+ αi+dt+uit
where αi are firm fixed-effects, dt are year fixed-effects and uit is the error term.
The model presented so far assumes that the firms’ choice of the number of bank relationships does not depend on firm performance. A relevant contribution of this paper is to relax this assumption because bank relationships are as likely to affect performance as performance is to affect the number of bank relationships. That is, the causality between firm performance and lending relationships can go either way. For instance, firm performance could be partially observable to non-relationship banks that will compete to gain them as clients. Thus, higher competition among banks for good performing firms can give rise to a positive relationship between performance and number of bank relationships. Additionally, Yosha (1995) argues that more profitable firms prefer bilateral financing to multilateral financing in order to minimize the disclosure of sensitive information to third parties. On the contrary, firms with a single bank relationship that want to increase the number of bank relationships might face a winner’s curse problem because non-relationship banks identify switching firms as non-performing firms (Von Thadden 1995). In consequence, better-performing firms may be reluctant to increase the number of bank relationships to avoid being perceived in the banking market as a non-performing firm. Thus, bank relationships are potentially endogenous with firm performance, which would lead to inconsistent estimations for the model proposed above.
We address this potential reverse causality through a simultaneous equations model that will be estimated using the Generalized Method of Moments (GMM). We first model the firm’s decision on the number of bank relationships, and then, in a second stage, we use the fitted values of the first stage as our right-hand side variable of interest.5 We use three instrumental variables in the first stage, two of
them are defined at the province level and one at the industry level: (1) the number of mergers in the past three years in the province where the firm is located, (2) the Herfindahl index of branch banking market concentration in the province where the firm is located6,7, and (3) the industry ratio of bank debt over total assets.8 As is well
known, the instruments must satisfy two conditions: they must be uncorrelated with the error term and they must be partially correlated with the endogenous variable (bank relationships) once the effect of all the other explanatory variables has been netted out (Wooldridge 2002, p.84). First, mergers of financial institutions will di-rectly affect those borrowers that have a relationship with each of the merging banks. We expect that these firms will react in the years following the merger by increasing their number of bank relationships. Second, the banking market structure affects the number of bank relationships because concentrated credit markets might enhance bank-firm relationships (Petersen and Rajan 1995). By using these two instruments, we are implicitly assuming that the distribution of bank branches across provinces is exogenous, in the sense that branching and mergers decisions of banks in other provinces are not based on the relative performance of firms in each province. It is typically the case that a bank’s decision to increase its branch network is determined by its ability to collect deposits in that local market, and is less concerned with the small business activity or its ability to grant business loans. Even though empirical evidence on this issue is not available for Spain, studies for other European coun-tries show that business opportunities are just one of many other factors that explain
5We follow a similar approach to that of Degryse and Ongena (2001) and Foket al.(2004). 6The Herfindahl index of branch banking market concentration is calculated at the province level using the number of bank branches that each commercial and savings bank has in each province. That is, the concentration index in each province and year is computed as the sum of the market shares squared for each financial institution operating in that province.
7Like many Spanish studies (Maudos, 2001; Carb´o, Humphrey and Rodr´ıguez, 2003; Carb´o, L´opez and Rodr´ıguez, 2003), we assume that the relevant market to measure banking competition is the province, given that we do expect the small and medium firms that compose our sample to seek banking finance close to their location. A practical reason for this choice is that the only available information at a different level other than national is the branch distribution in each province.
8Industries are defined as two digit SIC codes. The average ratio is computed using the firms in our sample by industry and year.
bank branch expansion, such as past market structure, level and growth of GDP, bank mergers, political reasons, etc.9 The last instrumental variable, namely
indus-try average bank debt scaled by assets, measures indusindus-try dependence on external finance.10 It is expected to be positively related to the number of bank
relation-ships if the bank risk-diversification hypothesis applies. That is, if banks want to limit their exposure to a given borrower, then firms that need more external finance will approach more banks to obtain additional credit. This effect has been shown to be particularly important for lower-credit-quality firms (Farinha and Santos 2002). Thus, using the leverage ratio for each firm (need of external finance by firm) would not be a good instrument because it is correlated with firm performance. Instead, we use a measure of dependence on external finance at the industry level. We expect that, on average, firms in industries highly dependent on external finance will need more lenders to satisfy their credit needs. The validity of our instruments will be further assessed empirically with the F-test of excluded instruments and the Hansen J test of overidentifying restrictions.
In alternative specifications, we also considered additional instruments such as the density of bank branches in the province where the firm is located.11 The availability
of bank branches in the vicinity of the firm (density of bank branches) may have an effect on the number of bank relationships due to transportation and information costs. However, this variable is highly correlated to the Herfindahl index and the test of validity of instruments exhibits a preference towards Herfindahl. Thus, the reported regressions do not include bank density as an instrument.
A second estimation problem comes from the fact that it is possible that the relation between performance and strength of bank-firm relationships is neither a correlation running from relationships to performance nor a reverse correlation in which performance affects relationships, but rather a spurious relationship attributed to unobservable individual heterogeneity among firms. Suppose there is an unobserv-able individual characteristic, like managerial ownership, that is positively related to both performance and relationships. If this individual characteristic is omitted from the specification, a regression of performance on the number of bank relationships
9See, for example, Calcagnini,et al. (1999) who provide Italian evidence.
10Alternatively, we have defined the external dependence of external finance of an industry as the ratio of bank debt over total liabilities and bank debt over creditors, and the results are virtually unaffected.
11The density of bank branches is computed as the total number of branches of all banks operating in the province where the firm is located.
will spuriously indicate a positive relationship because the number of banks is a pos-itive proxy for a firm’s characteristics. Using panel data methodology and assuming individual heterogeneity to be the fixed individual effect that does not vary through time is a way to solve the endogeneity caused by the spurious relationship.
The structural equations of the simultaneous model are:
Measure of Bank Relationshipsit = γ0 +γ1F irm P erf ormance Measureit+
+ γ2Mergerspt+γ3Herf indahlpt+
+ γ4Bank Debt/Assetsit+
+ γ5F irm ageit+γ6F irm sizeit+
+ γ F inancial Characteristicsit+
+ αi+dt+uit
F irm P erf ormance Measureit = β0+β1Measure of Bank Relationshipsit+
+ β2F irm ageit+β3F irm sizeit+
+ β F inancial Characteristicsit+
+ ηi+dt+υit
where αi and ηi are firm fixed-effects, dt are year fixed-effects anduit and υit are
the error terms.
The coefficient of interest is β1.It measures the effect of the exogenous variation of
the closeness of relationships on firm performance. When banks share the benefits of relationships with their client firms, we expect β1 to be positive. On the contrary, a
negative β1 would be evidence that banks appropriate most of the benefits generated
through the relationships.
To capture the multidimensional character of performance several indicators of firm performance have been used. We are going to focus on two firm performance measures specified as the dependent variable: return on total assets (ROA) and sales growth. As a robustness check five more measures are used: economic profitability, financial profitability, return on shareholders funds, asset turnover and value added growth. We use three alternative measures of bank relationships: (1) the Number of
Bank Relationships (Ni), (2) an indicator variable for one relationship versus multiple
bank-relationships (value zero) and (3) the Share by Bank, which is computed as (1/Ni), where Ni is the number of bank relationships of firm i.
The empirical specification further includes the main factors that affect firm per-formance such as age of the firm, size and financial structure as independent variables. Firm age is measured by the log of the age of the firm relative to its founding date. We do not have a priori a prediction for the effect of age. On the one hand, firm age captures the length of the firm’s track record. More profitable firms are more likely to survive. On the other hand, age can be a proxy for flexibility and management efficiency. Older firms are more likely to have a rigid administrative process and more bureaucracy. Firm size is measured by the log of the number of employees. We mea-sure the capital structure of a firm by the debt to assets ratio (Leverage) and liquidity as the current assets over current liabilities ratio. We expect a negative effect of this variable on firm performance. We include the inventory over assets ratio to proxy for the quality of management (Activity). We also include a measure of tangibility of as-sets (fixed asas-sets over asas-sets), which is also a proxy for the ability to pledge collateral. In some specifications, the Altman’s Z-score is included as an independent variable in the regression to capture the firm credit risk.12 This is a compound measure built
from accounting ratios that helps to predict how close a firm is to bankruptcy (Alt-man, 2002). A higher Z-score implies a lower default risk.13 We further computed
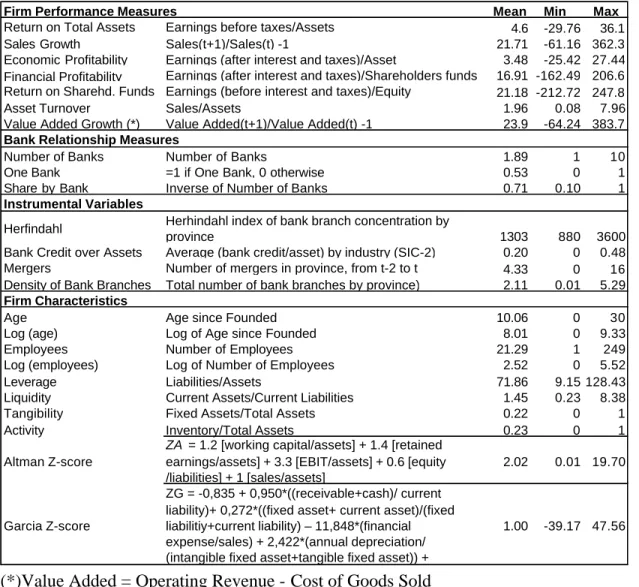
the Z-score proposed by Garc´ıa et al. (1997) because it is based on the estimation of a bankruptcy model for a sample of small and middle sized firms of the Spanish manufacturing sector.14. Table 1 provides the definition of the dependent variables
and the instrumental variables together with basic descriptive statistics.
12The Altman’s Z-score is calculated as: Z = 0.012 [working capital/assets] + 0.014 [retained earnings/assets] + 0.033 [EBIT/assets] + 0.006 [equity /liabilities] + 1 [sales/assets]. Although in the original model the fourth ratio is calculated by market value of capital / book value of debt, here we have used the alternative proposed by Scherr and Hulburt (2001): the book value (and not the market value) of equity. This is because the market value is not available in the case of SMEs.
13We estimated the model without the Altman’s Z-score as an explanatory variable because it is potentially endogenous. The results are virtually unaffected, thus, we decided to keep it because we judge it important to have a control of firm credit risk in the model.
14According to this model, the values used as proxies of firm financial strength will be com-puted as: ZA = -0.835 + 0.950*((receivable+cash)/current liability)+ 0.272*((fixed asset+current asset)/(fixed liabilitiy+current liability) - 11.848*(financial expense/sales) + 2.422*(annual depreci-ation/(intangible fixed asset+tangible fixed asset)) + 6,976*(earnings before taxes/total liabilities).
3
Data
The primary source of firm-level information is the SABE (System of Analysis of Spanish Balance Sheets) database, elaborated by Bureau Van Dijk15. This database
includes accounting and financial information for more than 600,000 Spanish firms for the period 1990 to 2004 which was obtained from the annual financial statements deposited at the Registry of Companies. To be included in the database, the firm must have at least one employee. Apart from accounting data, there is also some complementary information about the firms, like the headquarters location, date of constitution, firm industry, number of employees, legal form of the business, the opinion of the auditor, number of banks with whom the firm usually operates, and whether the firm is listed in the stock exchange.
The SABE database is updated regularly. The historical series are not available for some variables, such as the number of bank relationships (only the current observation of the variable is kept in the database). This variable has been recovered from previous updates of the database, one per year, from 1993 to 2004 in order to have a complete panel dataset on the number of bank relationships. A data limitation is due to the fact that the database does not distinguish between zero banks and missing value in that variable (cell is empty).
We use two additional sources of data: the Annual Statistics of the Spanish Banking Association (AEB) and the Annual Statistics of the Spanish Savings Banks (CECA), to obtain the number of branches of each bank by province and to construct a chronology of banking mergers and acquisitions during the sample period 1993-2004 (see Table 2). The final sample consists of 66,630 firms and 549,657 firm-year obser-vations.
3.1
Sample Selection
We selected active firms with positive sales, not listed in the stock exchange, in all industrial sectors except banking16 that during the period of analysis (1993-2004)
complied with the SME condition according to the requirements established by the European Commission Recommendation 2003/361/EC on the definition of small and
15The majority of the data is drawn from the CD dated March 2005 - update 67.
16In particular, we have dropped firms in the following industry sectors: Depository Institutions, Non-depository Credit Institutions, Security and Commodity Brokers, Dealers, Exchanges, and Ser-vices (SIC codes 60, 61 and 62).
medium-sized firms17. If both consolidated and non consolidated accounts are
avail-able, we choose the non consolidated ones.
The final sample consists of an unbalanced panel of 73,809 firms in the period 1993-2004, with a total of 603,350 firm-year observations. The average number of observations per firm is 8.2, ranging from a maximum of 10 observations for almost half of the sample to just one observation for 561 firms (0.76 percent of the sample). The estimated regressions are robust regarding the problem of unbalanced panel data. The maximum number of firms is achieved in 2002 with 72,665 observations in the sample, which represents 9.5 percent of the total population of Spanish SMEs in that year18.
In the regression analysis the number of firm-year observations is 510,846, corre-sponding to 66,452 firms, because of missing values on some key variables and because firms in the provinces of Ceuta and Melilla and those firms with minimum age greater than 20 years were dropped.
4
Regression Results
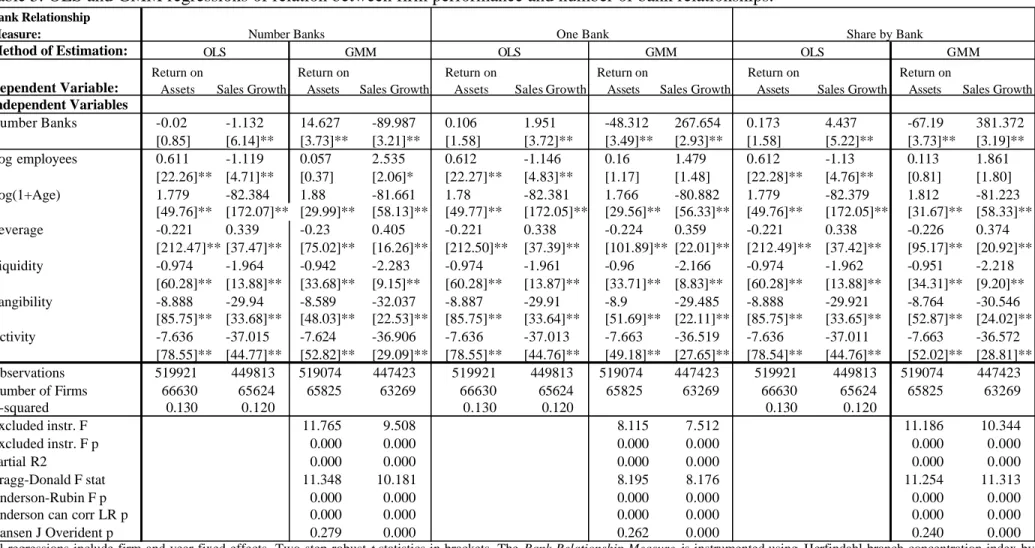
The main results can be found in table 3. OLS and GMM estimations are both reported. We obtain a positive relationship between number of bank relationships and return on total assets and a negative relationship with sales growth. The sign of the relationship is validated when we use the dummy variable One Bank relationship and the continuous variable Share by Bank as alternative measures of bank relationships. In the last row of table 3, we report the Hansen test for the validity of the ex-cluded instruments. An exex-cluded instrument refers to that used in the first-stage regression but not included in the second-stage regression. Included instruments re-fer to all other exogenous variables used to identify the endogenous variable. We
17Specifically, the sample firms is made up of enterprises which employ fewer than 250 persons and which have an annual turnover not exceeding EUR 50 million, and/or an annual balance sheet total not exceeding EUR 43 million. Within the SME category, a small enterprise is defined as an enterprise which employs fewer than 50 persons and whose annual turnover and/or annual balance sheet total does not exceed EUR 10 million. A micro enterprise is defined as an enterprise which employs fewer than 10 persons and whose annual turnover and/or annual balance sheet total does not exceed EUR 2 million.
18There were 778,093 firms with at least one employee in Spain in 2002, from which 773,603 had between one and 200 employees. Of the whole population of Spanish SMEs, the sample con-tains 28 percent of the joint stock companies, 8 percent of the limited liability companies and less than 1 percent of the companies with other legal forms (mostly partnerships with employees and cooperatives).
obtain Hansen p-values above 0.05, which suggest that we cannot reject the validity of the instruments at the 5% critical level for the equations with return on assets as the dependent variable. However, the validity of the instruments is not confirmed when the dependent variable is sales growth.
Ceteris paribus, increasing by one the number of bank relationships increases ROA
by 14 percentage points. The result is statistically and economically significant. Firm characteristics and financial ratios help explain the variation on the return over assets within the firm. We observe that as firms get older they are more profitable. Firm size is not significant. An increase in the ratio of debt over assets decreases profitability. Surprisingly, firms increasing their liquidity have lower performance that those than do not. Firms that increase the ratio of fixed assets over assets or increase the inventory to assets ratio have a lower profitability ratio.
In column 4 of table 3, we can see that the number of bank relationships has a negative effect on firm growth. Nevertheless, this result needs to be carefully assessed because the Hansen test does not validate the instruments, which means that the identification strategy is not valid for that dependent variable. It is seen that young and larger firms grow less. In terms of the financial ratios, the signs are the same as for the profitability ratio, except leverage: firms that increase the debt-to-assets ratio exhibit higher growth.
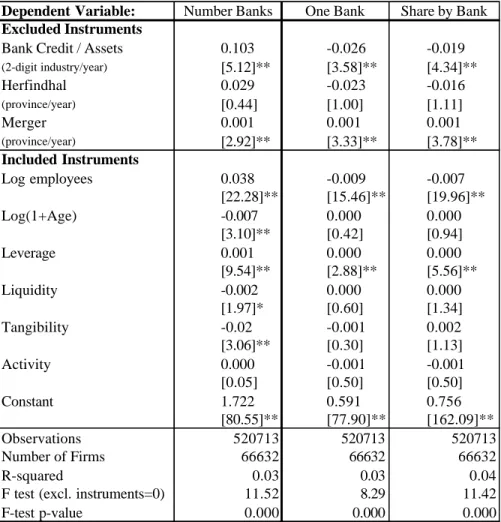
The first stage regressions can be found in table 4. In the last two rows we re-port the F-test and the associated p-value of the joint significance of the excluded instruments (Herfindahl, bank credit over assets in the industry and merger). This test validates the significance of the instruments for the three measures of bank re-lationship, i.e., the number of banks, the dummy of one bank relationship and the share by bank. As expected, the higher the bank credit in the industry, the larger the number of banks that the firms have in that industry. After a merger, firms react by increasing the number of bank relationships. The Herfindahl index of banking market concentration is not significant in none of the three equations. However, we decided to keep it as an excluded instrument because the C test of exogeneity of subsets of instruments cannot reject the Herfindahl index as an instrument.
5
Robustness Checks
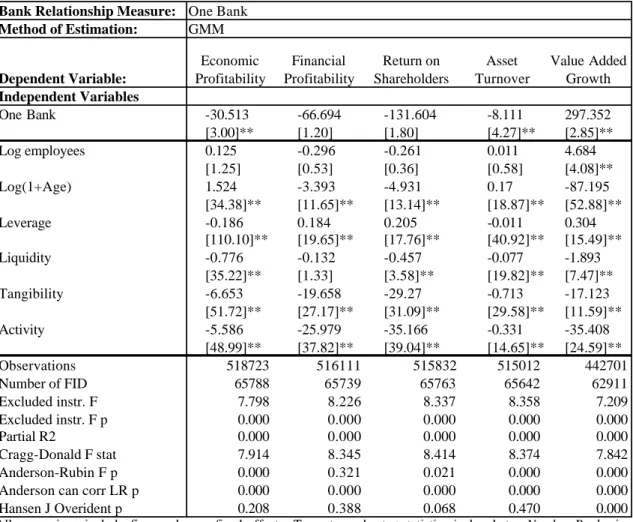
Several robustness checks have been performed to validate the results obtained thus far. We start by considering alternative dependent variables to measure firm
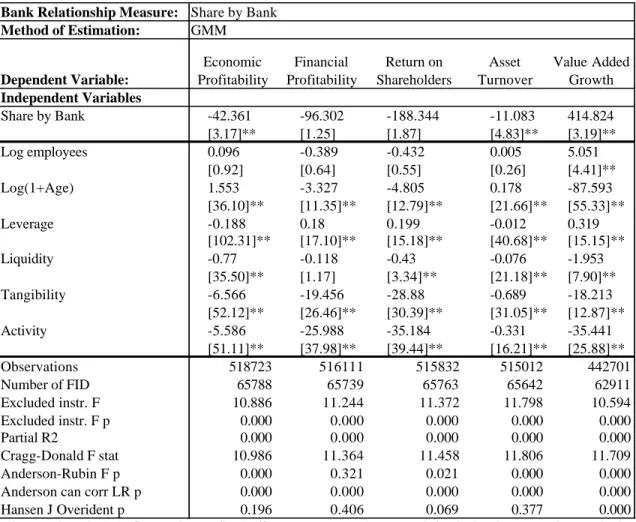
perfor-mance. The results can be found in table 5 (number of banks), table 6 (one bank) and table 7 (share by bank). The results are qualitatively similar to those reported in Section 4.
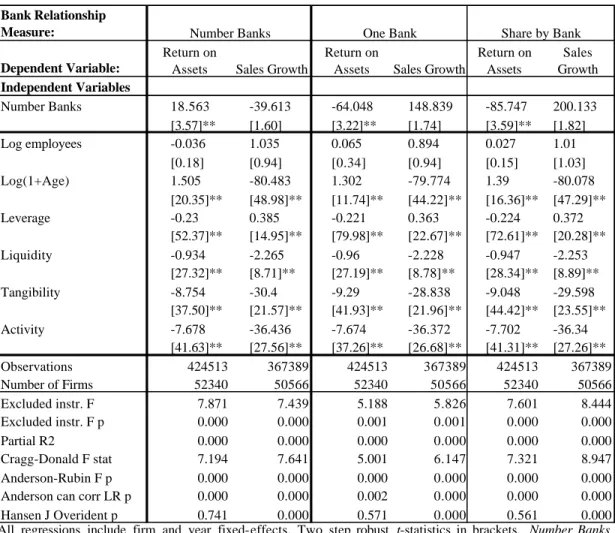
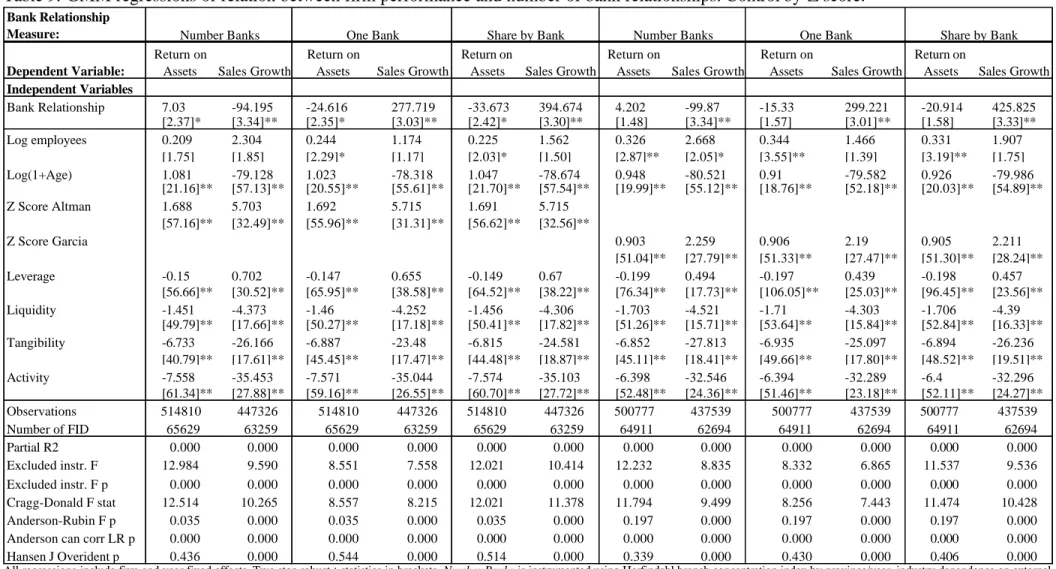
The next robustness check consists of eliminating the micro enterprises (less than ten employees) from our sample. The reason is that the quality of the accounting information of these firms is usually poor and most likely they have not been audited. The results in Table 8 corroborate the findings in the main regressions. After that, we include the Z-score to further control for the credit quality of the firm. We choose not to include it in the main specification since it could be considered an endogenous variable that is jointly determined with firm performance. We consider two alternative definitions of the Z-score. First, the Altman Z-score corresponds to the original definition provided by Altman (1968). Second, the Garc´ıa Z-score corresponds to a re-estimation of the model of Altman by Garc´ıa et al. (1997).The results in table 9 confirm the sign of the relationships obtained so far.
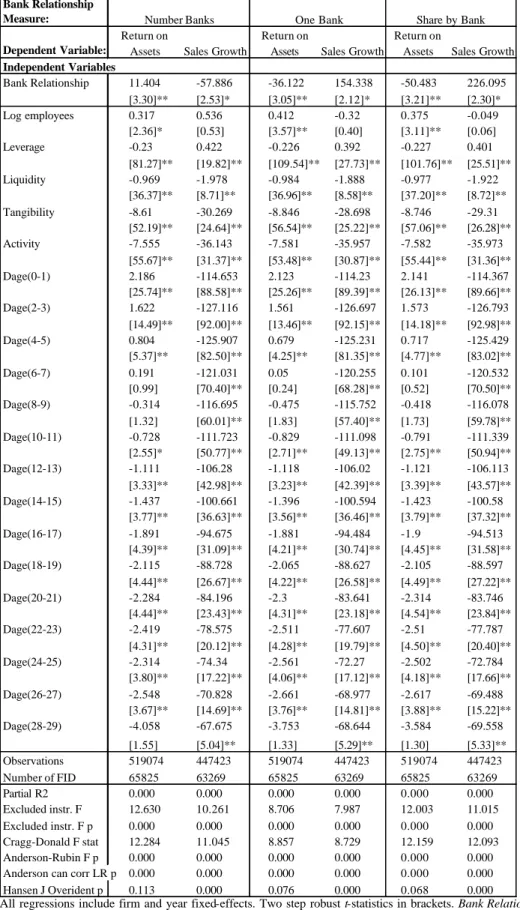
Finally, we are particularly careful in checking that our result is not driven by firm age. That is, our result could be capturing the life cycle of the firm. We want to disentangle the two stories that move in the same direction, namely the firms’ life cycle and building relationships with lenders (as a firm ages, the number of banks increases and profitability increases). Therefore, we have run additional regressions including age in days (instead of years), age-squared and dummies of age for each year. In Table 10 we report these regressions. After further controlling for firm age, our result of the effect of the number of bank relationships on firm performance is maintained.
We performed additional robustness checks (not reported) mainly referring to the instruments used. For instance, we included the density of bank branches in each province. With the same approach used to compute the number of mergers, we also computed the number of new entries and exits of banks in each province and year. However, the Hansen J test and the C statistic showed that the three instruments used are the ones that best identify the exogenous variation of the bank relationships variables.
6
Conclusion
In this paper evidence is provided consistent with the view that information prob-lems in the capital markets have an important effect on corporate performance. This
evidence comes from the fact that firms with an exclusive relationship with a bank -those firms that we a priori believe can minimize these problems - are less profitable than firms having multiple lenders. A possible explanation could be that the informa-tion acquired by the single bank remains proprietary - informainforma-tional monopoly- , and later on the bank is able to extract monopoly rents from the firm with an exclusive bank relationship.
The paper also provides some insights on how the benefits of relationship lending are shared between the bank and the firm. Using data from a large sample of Spanish firms, we argue that although close ties to a bank improve firm access to capital, they are not necessarily accompanied by higher profits or growth rates. The results are consistent with models where banks appropriate a large part of the benefits generated through relationships with clients (Sharpe 1990; Rajan 1992). Empirical evidence in Japan, a bank based economy, is consistent with the findings of this paper (Weinstein and Yafeh 1998).
References
Altman, E. (1968), ‘Financial ratios, discriminant analysis and the prediction of cor-porate bankruptcy’, Journal of Finance23, 589–609.
Altman, E. (2002), ‘Bankruptcy, credit risk, and high yield bonds’, Blackwell
Pub-lishers, Malden, MA .
Berger, A. N. and Udell, G. (1995), ‘Relationship lending and lines of credit in small firm finance’, Journal of Business 3(68), 351–381.
Billett, M., Flannery, M. and Garfinkel, J. (1995), ‘The effect of lender identity on a borrowing firms equity return’, Journal of Finance50, 699–718.
Boot, A. W. A. (2000), ‘Relationship banking: What do we know?’, Journal of
Fi-nancial Intermediation 9, 7–25.
Boot, A. W. A., Greembaum, S. and Thakor, A. V. (1993), ‘Reputation and discretion in financial contracting’, American Economic Review 83, 1165–1183.
Boot, A. W. A. and Thakor, A. V. (2000), ‘Can relationship banking survive compe-tition?’, Journal of Finance 55(2), 679–713.
Carb´o-Valverde, S., del Paso, R. L. and Rodr´ıguez-Fern´andez, F. (2003), ‘Medici´on de la competencia en mercados bancarios regionales’,Revista de Economia Aplicada
11(32), 5–33.
Carb´o-Valverde, S., Humphrey, D. and Rodr´ıguez-Fern´andez, F. (2003), ‘Deregula-tion, bank competition and regional growth’, Regional Studies.
Carb´o-Valverde, S., Rodr´ıguez-Fern´andez, F. and Udell, G. F. (2006), ‘Bank market power and SME financing constraints’,Documento de Trabajo n. 237, Fundaci´on
de las Cajas de Ahorros Madrid .
Cardone, C., Casasola, M. J. and Samart´ın, M. (2005), ‘Do banking relationships improve credit conditions for Spanish SMEs?’, Business Economics Working Papers, Universidad Carlos III, Departamento de Econom´ıa de la Empresa
(wb052806).
Cole, R. A. (1998), ‘The importance of relationships to the availability of credit’,
Degryse, H. and Ongena, S. (2001), ‘Bank relationships and firm profitability’,
Fi-nancial Management 30, 9–34.
Elsas, R. and Krahnen, J. P. (1998), ‘Is relationship lending special? Evidence from credit-file data in germany’, Journal of Banking & Finance 22(10-11), 1283– 1316.
Fama, E. (1985), ‘What’s different about banks?’, Journal of Monetary Economics
15, 29–36.
Farinha, L. A. and Santos, J. A. C. (2002), ‘Switching from single to multiple bank lending relationships: Determinants and implications’, Journal of Financial
In-termediation 11(2), 124–151.
Fok, R. C., Chang, Y. C. and Lee, W. T. (2004), ‘Bank relationships and their effects on firm performance around the Asian financial crisis: Evidence from Taiwan’,
Financial Management 33(2).
Garc´ıa, D., Calvo, A. and Arqu´es, A. (1997), ‘Factores discriminantes del riesgo financiero de la industria manufacturera espa˜nola’, en Calvo, A., y Garc´ıa, D.
(coordinadores), Predicci´on de la insolvencia empresaria, Madrid: AECA. .
Greenbaum, S. I. and Thakor, A. V. (1995), Contemporary Financial Intermediation, The Dryden Press, Orlando, Florida.
Harhoff, D. and K¨orting, T. (1998), ‘Lending relationships in germany - empirical evidence from survey data’, Journal of Banking and Finance 22, 1317–1353. Illueca, M. y Maudos, J. (2006), ‘Coste de la financiacion empresarial, banca
rela-cional y competencia bancaria: Evidencia del caso espa˜nol’,en Banca Relacional y Capital Social en Espa˜na: Competencia y Confianza, P´erez dir., Fern´andez de Guevara, J., Illueca, M., Maudos, J., Pastor, J.M. y E. Tortosa, cap. 5,
Fun-daci´on BBVA, Bilbao .
James, C. M. (1987), ‘Some evidence on the uniqueness of bank loans’, Journal of
Financial Economics19(2), 217–235.
Jayaratne, J. and Wolken, J. (1999), ‘How important are small banks to small business lending? New evidence from a survey of small firms’, Journal of Banking &
Maddala, G. S. (1983), Limited-Dependent and Quantitative Variables in Economet-rics, Cambridge University Press, New York.
Northcott, C. (2004), ‘Competition in banking: A review of the literature’, Bank of
Canada Working Papers (04-24).
Petersen, M. and Rajan, R. (1994), ‘The benefits of lending relationships: Evidence from small business data’, Journal of Finance 1(49), 3–37.
Petersen, M. and Rajan, R. (1995), ‘The effect of credit market competition on lending relationships’,Quarterly Journal of Economics (110), 407–443.
Rajan, R. (1992), ‘Insiders and outsiders: The choice between relationship and arm-slength debt’, Journal of Finance 47, 1367–1400.
Sharpe, S. A. (1990), ‘Asymmetric information, bank lending, and implicit contracts: A stylized model of customer relationships’, Journal of Finance 45(4), 1069–87. Stiglitz, J. and Weiss, A. (1981), ‘Credit rationing in markets with imperfect
infor-mation’, American Economic Review 71, 393–410.
von Thadden, E. L. (1995), ‘Long-term contracts, short-term investment and moni-toring’, Review of Economic Studies62(4), 557–75.
Weinstein, D. E. and Yafeh, Y. (1998), ‘On the costs of a bank-centered financial system: Evidence from the changing main bank relations in Japan’, Journal of
Finance 53(2), 635–672.
Wooldridge, J. M. (2001), Econometric Analysis of Cross Section and Panel Data, The MIT Press, Cambridge, Massachusetts.
Yosha, O. (1995), ‘Information disclosure costs and the choice of financing source’,
Table 1. Definition of variables and summary statistics
Mean Min Max
Return on Total Assets Earnings before taxes/Assets 4.6 -29.76 36.1
Sales Growth Sales(t+1)/Sales(t) -1 21.71 -61.16 362.3
Economic Profitability Earnings (after interest and taxes)/Asset 3.48 -25.42 27.44 Financial Profitability Earnings (after interest and taxes)/Shareholders funds 16.91 -162.49 206.6 Return on Sharehd. Funds Earnings (before interest and taxes)/Equity 21.18 -212.72 247.8
Asset Turnover Sales/Assets 1.96 0.08 7.96
Value Added Growth (*) Value Added(t+1)/Value Added(t) -1 23.9 -64.24 383.7
Number of Banks Number of Banks 1.89 1 10
One Bank =1 if One Bank, 0 otherwise 0.53 0 1
Share by Bank Inverse of Number of Banks 0.71 0.10 1
Herfindahl Herhindahl index of bank branch concentration by
province 1303 880 3600
Bank Credit over Assets Average (bank credit/asset) by industry (SIC-2) 0.20 0 0.48
Mergers Number of mergers in province, from t-2 to t 4.33 0 16
Density of Bank Branches Total number of bank branches by province) 2.11 0.01 5.29
Firm Characteristics
Age Age since Founded 10.06 0 30
Log (age) Log of Age since Founded 8.01 0 9.33
Employees Number of Employees 21.29 1 249
Log (employees) Log of Number of Employees 2.52 0 5.52
Leverage Liabilities/Assets 71.86 9.15 128.43
Liquidity Current Assets/Current Liabilities 1.45 0.23 8.38
Tangibility Fixed Assets/Total Assets 0.22 0 1
Activity Inventory/Total Assets 0.23 0 1
Altman Z-score
ZA = 1.2 [working capital/assets] + 1.4 [retained earnings/assets] + 3.3 [EBIT/assets] + 0.6 [equity /liabilities] + 1 [sales/assets]
2.02 0.01 19.70
Garcia Z-score
ZG = -0,835 + 0,950*((receivable+cash)/ current liability)+ 0,272*((fixed asset+ current asset)/(fixed liabilitiy+current liability) – 11,848*(financial expense/sales) + 2,422*(annual depreciation/ (intangible fixed asset+tangible fixed asset)) +
1.00 -39.17 47.56
Firm Performance Measures
Instrumental Variables Bank Relationship Measures
(*)Value Added = Operating Revenue - Cost of Goods Sold Number of Firm- Year observations: 549,657
This table defines the dependent variables and the instrumental variables used in this chapter. The explanatory variables have already been defined in table 3.1.
Table 2. Mergers in Spain in years 1992-2004.
YEAR TARGET FINANCIAL INSTITUTION ACQUIRING FINANCIAL INSTITUTION N(1)
2004 BANCO ATLANTICO, S.A. BANCO DE SABADELL, S.A. 45
2004 BANCO DE VITORIA, S.A. BANCO ESPAÑOL DE CREDITO, S.A. 5
2004 CREDIT LYONNAIS, S.A. S.E. CALYON, S.E. 1
2003 BANCO ZARAGOZANO, S.A. BARCLAYS BANK, S.A. 28
2003 HSBC INVESTMENT BANK PLC. S.E. HSBC BANK PLC, S.E. 1
2003 ACTIVOBANK, S.A. BANCO DE SABADELL, S.A. 2
2003 BANCO DE ASTURIAS, S.A. BANCO DE SABADELL, S.A. 2
2003 BCO DESARROLLO ECONOMICO ESPAÑOL BANCO ESPAÑOL DE CREDITO, S.A. 2
2003 BBVA PRIVANZA BANCO, S.A. BANCO BILBAO VIZCAYA ARGENTARIA, S.A. 13
2002 BANCO DE EXTREMADURA, S.A. BANCO SIMEON, S.A. 0
2002 BANCO DE MURCIA, S.A. BANCO DE VALENCIA, S.A. 2
2002 BANCO HERRERO, S.A. BANCO DE SABADELL, S.A. 24
2002 BANCO LUSO, S.A. BANCO SIMEON, S.A. 1
2002 EUROHYPO A.G. EUROPAISCHE HYPOTHEKENBANK D.B.,S.E. EUROHYPO A.G., S.E. 1
2001 CAJA AH Y PRESTAMOS DE CARLET CJ AH. VALENCIA, CASTELLON Y ALICANTE, BANCAJA 1
2001 PROBANCA, SERVICIOS FINANCIEROS, S.A. SOCIEDAD ESPAÑOLA BANCA NEGOCIOS PROBANCA 1 2001 SOLBANK SBD, S.A. BANCO DE SABADELL, S.A. 18
2000 CREDIT LYONNAIS ESPAÑA, S.A. CAJA DE AHORROS DE SALAMANCA Y SORIA 11
2000 BANCA CATALANA, S.A. BANCO BILBAO VIZCAYA ARGENTARIA, S.A. 6
2000 BANCA JOVER, S.A. CAJA DE AHORROS Y M.P. DE MADRID 6
2000 BANCO DE ALICANTE, S.A. BANCO BILBAO VIZCAYA ARGENTARIA, S.A. 5
2000 BANCO DEL COMERCIO, S.A. BANCO BILBAO VIZCAYA ARGENTARIA, S.A. 50
2000 CAJA AH PROVINCIAL DE PONTEVEDRA CAIXA AFORROS DE VIGO, OURENSE E PONTEVEDRA 5
2000 CAJA AH Y M.P. MUNICIPAL PAMPLONA CAJA DE AHORROS Y M.P. DE NAVARRA 2
2000 BANCO DE NEGOCIOS ARGENTARIA, S.A. BANCO BILBAO VIZCAYA ARGENTARIA, S.A. 1
1999 ARGENTARIA, CAJA POSTAL Y BANCO HIPOTECARIO, S.A. BANCO BILBAO VIZCAYA ARGENTARIA, S.A. 52
1999 BANCO DIRECTO, S.A. BANCO DE NEGOCIOS ARGENTARIA, S.A. 1
1999 CAJA AHORROS PROVINCIAL DE ORENSE CAIXA DE AFORROS DE VIGO E OURENSE 5
1999 DEXIA BANCO LOCAL, S.A. BANCO DE CREDITO LOCAL DE ESPAÑA, S.A. 1
1999 SINDICATO DE BANQUEROS DE BARCELONA, S.A. CAJA AH. VALENCIA, CASTELLON Y ALICANTE, BANCAJA 7
1999 BANCO CENTRAL HISPANO, S.A. BANCO SANTANDER, S.A. 52
1998 BANCO EXTERIOR DE ESPAÑA, S.A. ARGENTARIA, CAJA POSTAL Y BANCO HIPOTECARIO 52 1998 BANCO HIPOTECARIO DE ESPAÑA, S.A. ARGENTARIA, CAJA POSTAL Y BANCO HIPOTECARIO 46
1997 BANCO DE LA EXPORTACION, S.A. CAIXA D'ESTALVIS DE CATALUNYA 8
1997 CAIXABANK, S.A. CAJA DE AHORROS Y PENSIONES DE BARCELONA 3
1996 BANCO GRANADA JEREZ, S.A. CAJA DE AHORROS Y PENSIONES DE BARCELONA 10
1995 BANCO DE CREDITO AGRICOLA, S.A. ARGENTARIA, CAJA POSTAL Y BANCO HIPOTECARIO 21 1995 CAJA PROVINCIAL AHORROS CORDOBA CAJA DE AHORROS Y MONTE DE PIEDAD DE CORDOBA 2
1994 BANCO DE CREDITO CANARIO BANCO BILBAO VIZCAYA ARGENTARIA, S.A. 2
1994 BANCO DE JEREZ, S.A. BANCO GRANADA JEREZ, S.A. 8
1994 BANCO MERIDIONAL, S.A. BANCO BILBAO VIZCAYA ARGENTARIA, S.A. 11
1994 BANCO POPULAR INDUSTRIAL, S.A. BANCO POPULAR ESPAÑOL, S.A. 5
1994 CAJA AH DE JEREZ DE LA FRONTERA CAJA AH. PROV. SAN FERNANDO DE SEVILLA Y JEREZ 3
1993 CAJA AH Y SOCORROS DE SAGUNTO CJ AH. VALENCIA, CASTELLON Y ALICANTE, BANCAJA 1
1992 BANCO COMERCIAL ESPAÑOL, S.A. CREDIT LYONNAIS ESPAÑA, S.A. 5
1992 CAJA AH DE CUENCA Y CIUDAD REAL CAJA DE AHORROS DE CASTILLA-LA MANCHA 7
1992 CJ AHORROS PROVINCIAL DE ALBACETE CAJA DE AHORROS DE CASTILLA-LA MANCHA 3
1992 C AH PROVINCIAL ALICANTE Y VALENCIA CAJA DE AHORROS DEL MEDITERRANEO 4
1992 CJ AHORROS PROVINCIAL DE TOLEDO CAJA DE AHORROS DE CASTILLA-LA MANCHA 6
Table 3. OLS and GMM regressions of relation between firm performance and number of bank relationships. Bank Relationship Measure: Method of Estimation: Dependent Variable: Independent Variables Number Banks -0.02 -1.132 14.627 -89.987 0.106 1.951 -48.312 267.654 0.173 4.437 -67.19 381.372 [0.85] [6.14]** [3.73]** [3.21]** [1.58] [3.72]** [3.49]** [2.93]** [1.58] [5.22]** [3.73]** [3.19]** Log employees 0.611 -1.119 0.057 2.535 0.612 -1.146 0.16 1.479 0.612 -1.13 0.113 1.861 [22.26]** [4.71]** [0.37] [2.06]* [22.27]** [4.83]** [1.17] [1.48] [22.28]** [4.76]** [0.81] [1.80] Log(1+Age) 1.779 -82.384 1.88 -81.661 1.78 -82.381 1.766 -80.882 1.779 -82.379 1.812 -81.223 [49.76]** [172.07]** [29.99]** [58.13]** [49.77]** [172.05]** [29.56]** [56.33]** [49.76]** [172.05]** [31.67]** [58.33]** Leverage -0.221 0.339 -0.23 0.405 -0.221 0.338 -0.224 0.359 -0.221 0.338 -0.226 0.374 [212.47]** [37.47]** [75.02]** [16.26]** [212.50]** [37.39]** [101.89]** [22.01]** [212.49]** [37.42]** [95.17]** [20.92]** Liquidity -0.974 -1.964 -0.942 -2.283 -0.974 -1.961 -0.96 -2.166 -0.974 -1.962 -0.951 -2.218 [60.28]** [13.88]** [33.68]** [9.15]** [60.28]** [13.87]** [33.71]** [8.83]** [60.28]** [13.88]** [34.31]** [9.20]** Tangibility -8.888 -29.94 -8.589 -32.037 -8.887 -29.91 -8.9 -29.485 -8.888 -29.921 -8.764 -30.546 [85.75]** [33.68]** [48.03]** [22.53]** [85.75]** [33.64]** [51.69]** [22.11]** [85.75]** [33.65]** [52.87]** [24.02]** Activity -7.636 -37.015 -7.624 -36.906 -7.636 -37.013 -7.663 -36.519 -7.636 -37.011 -7.663 -36.572 [78.55]** [44.77]** [52.82]** [29.09]** [78.55]** [44.76]** [49.18]** [27.65]** [78.54]** [44.76]** [52.02]** [28.81]** Observations Number of Firms R-squared Excluded instr. F 11.765 9.508 8.115 7.512 Excluded instr. F p 0.000 0.000 0.000 0.000 0.000 0.000 Partial R2 0.000 0.000 0.000 0.000 0.000 0.000 Cragg-Donald F stat 11.348 10.181 8.195 8.176 Anderson-Rubin F p 0.000 0.000 0.000 0.000 0.000 0.000
Anderson can corr LR p 0.000 0.000 0.000 0.000 0.000 0.000
Hansen J Overident p 0.279 0.000 0.262 0.000 0.240 0.000 11.186 11.254 10.344 11.313 0.130 0.120 519074 447423 65825 63269 519921 449813 66630 65624 447423 65825 63269 519921 449813 66630 65624 0.130 0.120 519074 447423 63269 519921 66630 0.130 519074 65825 449813 65624 0.120 OLS OLS
Number Banks One Bank Share by Bank
OLS GMM GMM GMM
Return on
Assets Sales Growth
Return on
Assets Sales Growth
Return on
Assets Sales Growth
Return on
Assets Sales Growth
Return on
Assets Sales Growth
Return on
Assets Sales Growth
All regressions include firm and year fixed-effects. Two step robust t-statistics in brackets. The Bank Relationship Measure is instrumented using Herfindahl branch concentration index by province/year, industry dependence on external finance and number of mergers. Reported statistics: F statistic and p-value of excluded instruments test, partial R-squared of excluded instruments, Cragg-Donald F statistic of weak identification, Anderson-Rubin test of joint significance of endogenous regressors in main equation (p-value reported), Anderson canonical correlation LR test of underidentification (p-value reported) and Hansen J test of overidentification of all instruments (p -value reported).
Table 4. First stage regressions. Determinants of the Bank Relationship Measures.
Dependent Variable: Excluded Instruments
Bank Credit / Assets 0.103 -0.026 -0.019
(2-digit industry/year) [5.12]** [3.58]** [4.34]** Herfindhal 0.029 -0.023 -0.016 (province/year) [0.44] [1.00] [1.11] Merger 0.001 0.001 0.001 (province/year) [2.92]** [3.33]** [3.78]** Included Instruments Log employees 0.038 -0.009 -0.007 [22.28]** [15.46]** [19.96]** Log(1+Age) -0.007 0.000 0.000 [3.10]** [0.42] [0.94] Leverage 0.001 0.000 0.000 [9.54]** [2.88]** [5.56]** Liquidity -0.002 0.000 0.000 [1.97]* [0.60] [1.34] Tangibility -0.02 -0.001 0.002 [3.06]** [0.30] [1.13] Activity 0.000 -0.001 -0.001 [0.05] [0.50] [0.50] Constant 1.722 0.591 0.756 [80.55]** [77.90]** [162.09]** Observations 520713 520713 520713 Number of Firms 66632 66632 66632 R-squared 0.03 0.03 0.04
F test (excl. instruments=0) 11.52 8.29 11.42
F-test p-value 0.000 0.000 0.000
Number Banks One Bank Share by Bank
All regressions include firm and year fixed-effects. Two step robust t-statistics in brackets.
Reported statistics: F statistic and p-value of excluded instruments test (Ho: instruments are not different form zero).
Table 5. GMM regressions of relation between firm performance and number of bank relationships. Alternative measures of firm performance and firm growth. Measure of Bank Relationships is Number Banks.
Bank Relationship Measure: Method of Estimation: GMM Dependent Variable: Independent Variables Number Banks 9.137 25.286 47.684 2.249 -91.278 [3.20]** [1.49] [2.13]* [4.85]** [3.27]** Log employees 0.063 -0.635 -0.845 0.002 5.53 [0.56] [0.94] [0.95] [0.11] [4.39]** Log(1+Age) 1.596 -3.203 -4.577 0.189 -88.092 [34.07]** [10.18]** [11.28]** [22.22]** [55.69]** Leverage -0.19 0.172 0.184 -0.012 0.346 [82.51]** [12.51]** [10.50]** [33.95]** [12.87]** Liquidity -0.764 -0.098 -0.392 -0.075 -2.026 [34.96]** [0.94] [2.93]** [21.50]** [8.00]** Tangibility -6.456 -19.108 -28.255 -0.662 -19.599 [47.61]** [23.66]** [26.98]** [28.89]** [12.79]** Activity -5.562 -25.941 -35.09 -0.326 -35.74 [51.83]** [37.81]** [39.14]** [16.92]** [26.60]** Observations 518723 516111 515832 515012 442701 Number of FID 65788 65739 65763 65642 62911 Excluded instr. F 11.799 11.842 11.843 12.824 10.884 Excluded instr. F p 0.000 0.000 0.000 0.000 0.000 Partial R2 0.000 0.000 0.000 0.000 0.000 Cragg-Donald F stat 11.391 11.454 11.468 12.366 12.008 Anderson-Rubin F p 0.000 0.321 0.021 0.000 0.000
Anderson can corr LR p 0.000 0.000 0.000 0.000 0.000
Hansen J Overident p 0.220 0.584 0.136 0.185 0.000 Number Banks Economic Profitability Financial Profitability Return on Shareholders Asset Turnover Value Added Growth
All regressions include firm and year fixed-effects. Two step robust t-statistics in brackets. Number Banks is instrumented using Herfindahl branch concentration index by province/year, industry dependence on external finance and number of mergers. Reported statistics: F statistic and p-value of excluded instruments test, partial R-squared of excluded instruments, Cragg-Donald F statistic of weak identification, Anderson-Rubin test of joint significance of endogenous regressors in main equation (p-value reported), Anderson canonical correlation LR test of underidentification (p-value reported) and Hansen J test of overidentification of all instruments (p -value reported).
Table 6. GMM regressions of relation between firm performance and number of bank relationships. Alternative measures of firm performance and firm growth. Measure of Bank Relationships is One Bank.
Bank Relationship Measure: Method of Estimation: GMM Dependent Variable: Independent Variables One Bank -30.513 -66.694 -131.604 -8.111 297.352 [3.00]** [1.20] [1.80] [4.27]** [2.85]** Log employees 0.125 -0.296 -0.261 0.011 4.684 [1.25] [0.53] [0.36] [0.58] [4.08]** Log(1+Age) 1.524 -3.393 -4.931 0.17 -87.195 [34.38]** [11.65]** [13.14]** [18.87]** [52.88]** Leverage -0.186 0.184 0.205 -0.011 0.304 [110.10]** [19.65]** [17.76]** [40.92]** [15.49]** Liquidity -0.776 -0.132 -0.457 -0.077 -1.893 [35.22]** [1.33] [3.58]** [19.82]** [7.47]** Tangibility -6.653 -19.658 -29.27 -0.713 -17.123 [51.72]** [27.17]** [31.09]** [29.58]** [11.59]** Activity -5.586 -25.979 -35.166 -0.331 -35.408 [48.99]** [37.82]** [39.04]** [14.65]** [24.59]** Observations 518723 516111 515832 515012 442701 Number of FID 65788 65739 65763 65642 62911 Excluded instr. F 7.798 8.226 8.337 8.358 7.209 Excluded instr. F p 0.000 0.000 0.000 0.000 0.000 Partial R2 0.000 0.000 0.000 0.000 0.000 Cragg-Donald F stat 7.914 8.345 8.414 8.374 7.842 Anderson-Rubin F p 0.000 0.321 0.021 0.000 0.000
Anderson can corr LR p 0.000 0.000 0.000 0.000 0.000
Hansen J Overident p 0.208 0.388 0.068 0.470 0.000 Asset Turnover Value Added Growth One Bank Economic Profitability Financial Profitability Return on Shareholders
All regressions include firm and year fixed-effects. Two step robust t-statistics in brackets. Number Banks is instrumented using Herfindahl branch concentration index by province/year, industry dependence on external finance and number of mergers. Reported statistics: F statistic and p-value of excluded instruments test, partial R-squared of excluded instruments, Cragg-Donald F statistic of weak identification, Anderson-Rubin test of joint significance of endogenous regressors in main equation (p-value reported), Anderson canonical correlation LR test of underidentification (p-value reported) and Hansen J test of overidentification of all instruments (p -value reported).
Table 7. GMM regressions of relation between firm performance and number of bank relationships. Alternative measures of firm performance and firm growth. Measure of Bank Relationships is Share by Bank.
Bank Relationship Measure: Method of Estimation: GMM Dependent Variable: Independent Variables Share by Bank -42.361 -96.302 -188.344 -11.083 414.824 [3.17]** [1.25] [1.87] [4.83]** [3.19]** Log employees 0.096 -0.389 -0.432 0.005 5.051 [0.92] [0.64] [0.55] [0.26] [4.41]** Log(1+Age) 1.553 -3.327 -4.805 0.178 -87.593 [36.10]** [11.35]** [12.79]** [21.66]** [55.33]** Leverage -0.188 0.18 0.199 -0.012 0.319 [102.31]** [17.10]** [15.18]** [40.68]** [15.15]** Liquidity -0.77 -0.118 -0.43 -0.076 -1.953 [35.50]** [1.17] [3.34]** [21.18]** [7.90]** Tangibility -6.566 -19.456 -28.88 -0.689 -18.213 [52.12]** [26.46]** [30.39]** [31.05]** [12.87]** Activity -5.586 -25.988 -35.184 -0.331 -35.441 [51.11]** [37.98]** [39.44]** [16.21]** [25.88]** Observations 518723 516111 515832 515012 442701 Number of FID 65788 65739 65763 65642 62911 Excluded instr. F 10.886 11.244 11.372 11.798 10.594 Excluded instr. F p 0.000 0.000 0.000 0.000 0.000 Partial R2 0.000 0.000 0.000 0.000 0.000 Cragg-Donald F stat 10.986 11.364 11.458 11.806 11.709 Anderson-Rubin F p 0.000 0.321 0.021 0.000 0.000
Anderson can corr LR p 0.000 0.000 0.000 0.000 0.000
Hansen J Overident p 0.196 0.406 0.069 0.377 0.000 Economic Profitability Financial Profitability Return on Shareholders Asset Turnover Value Added Growth Share by Bank
All regressions include firm and year fixed-effects. Two step robust t-statistics in brackets. Number Banks is instrumented using Herfindahl branch concentration index by province/year, industry dependence on external finance and number of mergers. Reported statistics: F statistic and p-value of excluded instruments test, partial R-squared of excluded instruments, Cragg-Donald F statistic of weak identification, Anderson-Rubin test of joint significance of endogenous regressors in main equation (p-value reported), Anderson canonical correlation LR test of underidentification (p-value reported) and Hansen J test of overidentification of all instruments (p -value reported).
Table 8. GMM regressions of relation between firm performance and number of bank relationships. Regressions with small and medium firms.
Bank Relationship Measure: Dependent Variable: Independent Variables Number Banks 18.563 -39.613 -64.048 148.839 -85.747 200.133 [3.57]** [1.60] [3.22]** [1.74] [3.59]** [1.82] Log employees -0.036 1.035 0.065 0.894 0.027 1.01 [0.18] [0.94] [0.34] [0.94] [0.15] [1.03] Log(1+Age) 1.505 -80.483 1.302 -79.774 1.39 -80.078 [20.35]** [48.98]** [11.74]** [44.22]** [16.36]** [47.29]** Leverage -0.23 0.385 -0.221 0.363 -0.224 0.372 [52.37]** [14.95]** [79.98]** [22.67]** [72.61]** [20.28]** Liquidity -0.934 -2.265 -0.96 -2.228 -0.947 -2.253 [27.32]** [8.71]** [27.19]** [8.78]** [28.34]** [8.89]** Tangibility -8.754 -30.4 -9.29 -28.838 -9.048 -29.598 [37.50]** [21.57]** [41.93]** [21.96]** [44.42]** [23.55]** Activity -7.678 -36.436 -7.674 -36.372 -7.702 -36.34 [41.63]** [27.56]** [37.26]** [26.68]** [41.31]** [27.26]** Observations 424513 367389 424513 367389 424513 367389 Number of Firms 52340 50566 52340 50566 52340 50566 Excluded instr. F 7.871 7.439 5.188 5.826 7.601 8.444 Excluded instr. F p 0.000 0.000 0.001 0.001 0.000 0.000 Partial R2 0.000 0.000 0.000 0.000 0.000 0.000 Cragg-Donald F stat 7.194 7.641 5.001 6.147 7.321 8.947 Anderson-Rubin F p 0.000 0.000 0.000 0.000 0.000 0.000 Anderson can corr LR p 0.000 0.000 0.002 0.000 0.000 0.000 Hansen J Overident p 0.741 0.000 0.571 0.000 0.561 0.000
Number Banks One Bank Share by Bank Return on
Assets Sales Growth
Return on
Assets Sales Growth
Return on Assets
Sales Growth
All regressions include firm and year fixed-effects. Two step robust t-statistics in brackets. Number Banks is instrumented using Herfindahl branch concentration index by province/year, industry dependence on external finance and number of mergers. Reported statistics: F statistic and p-value of excluded instruments test, partial R-squared of excluded instruments, Cragg-Donald F statistic of weak identification, Anderson-Rubin test of joint significance of endogenous regressors in main equation (p-value reported), Anderson canonical correlation LR test of underidentification (p-value reported) and Hansen J test of overidentification of all instruments (p -value reported).
Table 9. GMM regressions of relation between firm performance and number of bank relationships. Control by Z score. Bank Relationship Measure: Dependent Variable: Independent Variables Bank Relationship 7.03 -94.195 -24.616 277.719 -33.673 394.674 4.202 -99.87 -15.33 299.221 -20.914 425.825 [2.37]* [3.34]** [2.35]* [3.03]** [2.42]* [3.30]** [1.48] [3.34]** [1.57] [3.01]** [1.58] [3.33]** Log employees 0.209 2.304 0.244 1.174 0.225 1.562 0.326 2.668 0.344 1.466 0.331 1.907 [1.75] [1.85] [2.29]* [1.17] [2.03]* [1.50] [2.87]** [2.05]* [3.55]** [1.39] [3.19]** [1.75] Log(1+Age) 1.081 -79.128 1.023 -78.318 1.047 -78.674 0.948 -80.521 0.91 -79.582 0.926 -79.986 [21.16]** [57.13]** [20.55]** [55.61]** [21.70]** [57.54]** [19.99]** [55.12]** [18.76]** [52.18]** [20.03]** [54.89]** Z Score Altman 1.688 5.703 1.692 5.715 1.691 5.715 [57.16]** [32.49]** [55.96]** [31.31]** [56.62]** [32.56]** Z Score Garcia 0.903 2.259 0.906 2.19 0.905 2.211 [51.04]** [27.79]** [51.33]** [27.47]** [51.30]** [28.24]** Leverage -0.15 0.702 -0.147 0.655 -0.149 0.67 -0.199 0.494 -0.197 0.439 -0.198 0.457 [56.66]** [30.52]** [65.95]** [38.58]** [64.52]** [38.22]** [76.34]** [17.73]** [106.05]** [25.03]** [96.45]** [23.56]** Liquidity -1.451 -4.373 -1.46 -4.252 -1.456 -4.306 -1.703 -4.521 -1.71 -4.303 -1.706 -4.39 [49.79]** [17.66]** [50.27]** [17.18]** [50.41]** [17.82]** [51.26]** [15.71]** [53.64]** [15.84]** [52.84]** [16.33]** Tangibility -6.733 -26.166 -6.887 -23.48 -6.815 -24.581 -6.852 -27.813 -6.935 -25.097 -6.894 -26.236 [40.79]** [17.61]** [45.45]** [17.47]** [44.48]** [18.87]** [45.11]** [18.41]** [49.66]** [17.80]** [48.52]** [19.51]** Activity -7.558 -35.453 -7.571 -35.044 -7.574 -35.103 -6.398 -32.546 -6.394 -32.289 -6.4 -32.296 [61.34]** [27.88]** [59.16]** [26.55]** [60.70]** [27.72]** [52.48]** [24.36]** [51.46]** [23.18]** [52.11]** [24.27]** Observations 447326 514810 447326 447326 437539 500777 437539 437539 Number of FID 65629 63259 65629 63259 65629 63259 64911 62694 64911 62694 64911 62694 Partial R2 0.000 0.000 0.000 0.000 0.000 0.000 0.000 0.000 0.000 0.000 0.000 0.000 Excluded instr. F 9.590 8.551 7.558 10.414 8.835 8.332 6.865 9.536 Excluded instr. F p 0.000 0.000 0.000 0.000 0.000 0.000 0.000 0.000 0.000 0.000 0.000 0.000 Cragg-Donald F stat 10.265 8.557 8.215 11.378 9.499 8.256 7.443 10.428 Anderson-Rubin F p 0.035 0.000 0.035 0.000 0.035 0.000 0.197 0.000 0.197 0.000 0.197 0.000 Anderson can corr LR p 0.000 0.000 0.000 0.000 0.000 0.000 0.000 0.000 0.000 0.000 0.000 0.000 Hansen J Overident p 0.436 0.000 0.544 0.000 0.514 0.000 0.339 0.000 0.430 0.000 0.406 0.000 514810 12.984 12.514 11.474 11.537 500777 514810 12.021 12.021 500777 12.232 11.794 Number Banks One Bank Share by Bank
Return on
Assets Sales Growth
Return on
Assets Sales Growth
Return on
Assets Sales Growth
Share by Bank Return on
Assets Sales Growth Number Banks
Return on
Assets Sales Growth
One Bank Sales Growth Return on
Assets
All regressions include firm and year fixed-effects. Two step robust t-statistics in brackets. Number Banks is instrumented using Herfindahl branch concentration index by province/year, industry dependence on external finance and number of mergers. Reported statistics: F statistic and p-value of excluded instruments test, partial R-squared of excluded instruments, Cragg-Donald F statistic of weak identification, Anderson-Rubin test of joint significance of endogenous regressors in main equation (p-value reported), Anderson canonical correlation LR test of underidentification (p-value reported) and Hansen J test of overidentification of all instruments (p-value reported). * significant at 10%; ** significant at 5%; *** significant at 1%
Table 10. GMM regressions of relation between firm performance and number of bank relationships. Alternative specification: further control by firm age.
Bank Relationship Measure: Dependent Variable: Independent Variables Bank Relationship 11.404 -57.886 -36.122 154.338 -50.483 226.095 [3.30]** [2.53]* [3.05]** [2.12]* [3.21]** [2.30]* Log employees 0.317 0.536 0.412 -0.32 0.375 -0.049 [2.36]* [0.53] [3.57]** [0.40] [3.11]** [0.06] Leverage -0.23 0.422 -0.226 0.392 -0.227 0.401 [81.27]** [19.82]** [109.54]** [27.73]** [101.76]** [25.51]** Liquidity -0.969 -1.978 -0.984 -1.888 -0.977 -1.922 [36.37]** [8.71]** [36.96]** [8.58]** [37.20]** [8.72]** Tangibility -8.61 -30.269 -8.846 -28.698 -8.746 -29.31 [52.19]** [24.64]** [56.54]** [25.22]** [57.06]** [26.28]** Activity -7.555 -36.143 -7.581 -35.957 -7.582 -35.973 [55.67]** [31.37]** [53.48]** [30.87]** [55.44]** [31.36]** Dage(0-1) 2.186 -114.653 2.123 -114.23 2.141 -114.367 [25.74]** [88.58]** [25.26]** [89.39]** [26.13]** [89.66]** Dage(2-3) 1.622 -127.116 1.561 -126.697 1.573 -126.793 [14.49]** [92.00]** [13.46]** [92.15]** [14.18]** [92.98]** Dage(4-5) 0.804 -125.907 0.679 -125.231 0.717 -125.429 [5.37]** [82.50]** [4.25]** [81.35]** [4.77]** [83.02]** Dage(6-7) 0.191 -121.031 0.05 -120.255 0.101 -120.532 [0.99] [70.40]** [0.24] [68.28]** [0.52] [70.50]** Dage(8-9) -0.314 -116.695 -0.475 -115.752 -0.418 -116.078 [1.32] [60.01]** [1.83] [57.40]** [1.73] [59.78]** Dage(10-11) -0.728 -111.723 -0.829 -111.098 -0.791 -111.339 [2.55]* [50.77]** [2.71]** [49.13]** [2.75]** [50.94]** Dage(12-13) -1.111 -106.28 -1.118 -106.02 -1.121 -106.113 [3.33]** [42.98]** [3.23]** [42.39]** [3.39]** [43.57]** Dage(14-15) -1.437 -100.661 -1.396 -100.594 -1.423 -100.58 [3.77]** [36.63]** [3.56]** [36.46]** [3.79]** [37.32]** Dage(16-17) -1.891 -94.675 -1.881 -94.484 -1.9 -94.513 [4.39]** [31.09]** [4.21]** [30.74]** [4.45]** [31.58]** Dage(18-19) -2.115 -88.728 -2.065 -88.627 -2.105 -88.597 [4.44]** [26.67]** [4.22]** [26.58]** [4.49]** [27.22]** Dage(20-21) -2.284 -84.196 -2.3 -83.641 -2.314 -83.746 [4.44]** [23.43]** [4.31]** [23.18]** [4.54]** [23.84]** Dage(22-23) -2.419 -78.575 -2.511 -77.607 -2.51 -77.787 [4.31]** [20.12]** [4.28]** [19.79]** [4.50]** [20.40]** Dage(24-25) -2.314 -74.34 -2.561 -72.27 -2.502 -72.784 [3.80]** [17.22]** [4.06]** [17.12]** [4.18]** [17.66]** Dage(26-27) -2.548 -70.828 -2.661 -68.977 -2.617 -69.488 [3.67]** [14.69]** [3.76]** [14.81]** [3.88]** [15.22]** Dage(28-29) -4.058 -67.675 -3.753 -68.644 -3.584 -69.558 [1.55] [5.04]** [1.33] [5.29]** [1.30] [5.33]** Observations 519074 447423 519074 447423 519074 447423 Number of FID 65825 63269 65825 63269 65825 63269 Partial R2 0.000 0.000 0.000 0.000 0.000 0.000 Excluded instr. F 12.630 10.261 8.706 7.987 12.003 11.015 Excluded instr. F p 0.000 0.000 0.000 0.000 0.000 0.000 Cragg-Donald F stat 12.284 11.045 8.857 8.729 12.159 12.093 Anderson-Rubin F p 0.000 0.000 0.000 0.000 0.000 0.000
Anderson can corr LR p 0.000 0.000 0.000 0.000 0.000 0.000
Hansen J Overident p 0.113 0.000 0.076 0.000 0.068 0.000
Share by Bank Return on
Assets Sales Growth
Number Banks One Bank
Return on
Assets Sales Growth
Return on
Assets Sales Growth
All regressions include firm and year fixed-effects. Two step robust t-statistics in brackets. Bank Relationship is instrumented using Herfindahl branch concentration index by province/year, industry dependence on external finance and number of mergers. Reported statistics: F statistic and p-value of excluded instruments test, partial R-squared of excluded instruments, Cragg-Donald F statistic of weak identification, Anderson-Rubin test of joint significance of endogenous regressors in main equation (p-value reported), Anderson canonical correlation LR test of underidentification (p-value reported) and Hansen J test of overidentification of all instruments (p-value reported). * significant at 10%; ** significant at 5%; *** significant at 1%
Edicions / Issues:
95/1 Productividad del trabajo, eficiencia e hipótesis de convergencia en la industria textil-confección europea
Jordi López Sintas
95/2 El tamaño de la empresa y la remuneración de los máximos directivos Pedro Ortín Ángel
95/3 Multiple-Sourcing and Specific Investments Miguel A. García-Cestona
96/1 La estructura interna de puestos y salarios en la jerarquía empresarial Pedro Ortín Ángel
96/2 Efficient Privatization Under Incomplete Contracts Miguel A. García-Cestona
Vicente Salas-Fumás
96/3 Institutional Imprinting, Global Cultural Models, and Patterns of
OrganizationalLearning: Evidence from Firms in the Middle-Range Countries Mauro F. Guillén (The Wharton School, University of Pennsylvania)
96/4 The relationship between firm size and innovation activity: a double decision approach
Ester Martínez-Ros (Universitat Autònoma de Barcelona) José M. Labeaga (UNED & Universitat Pompeu Fabra)
96/5 An Approach to Asset-Liability Risk Control Through Asset-Liability Securities Joan Montllor i Serrats
María-Antonia Tarrazón Rodón
97/1 Protección de los administradores ante el mercado de capitales: evidencia empírica en España
Rafael Crespí i Cladera
97/2 Determinants of Ownership Structure: A Panel Data Approach to the Spanish Case Rafael Crespí i Cladera
97/3 The Spanish Law of Suspension of Payments: An Economic Analysis From Empirical Evidence
Esteban van Hemmen Almazor
98/1 Board Turnover and Firm Performance in Spanish Companies Carles Gispert i Pellicer
98/2 Libre competencia frente a regulación en la distribución de medicamentos: teoría y evidencia empírica para el caso español
Eva Jansson