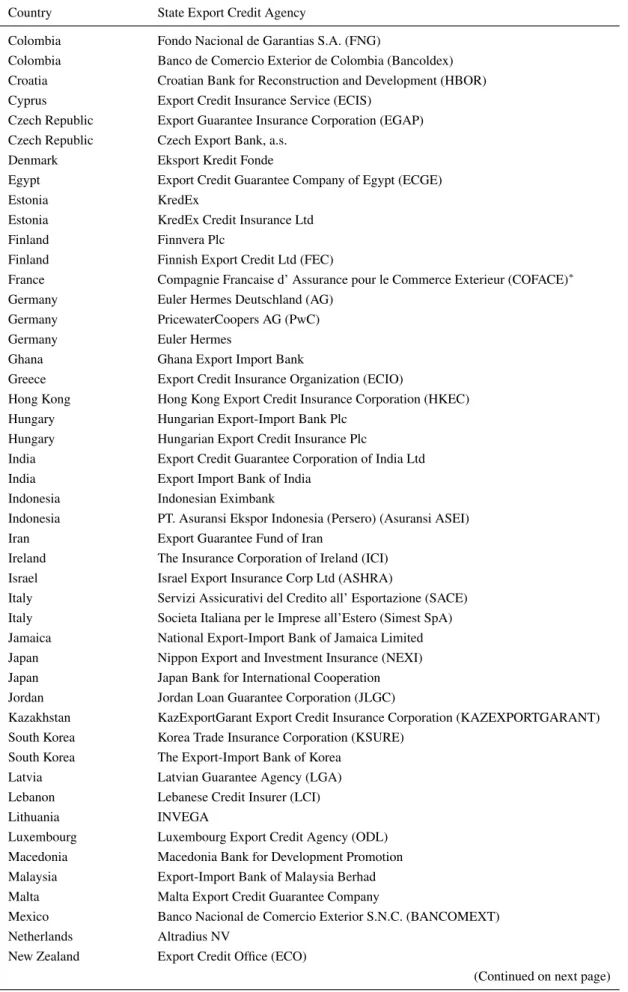
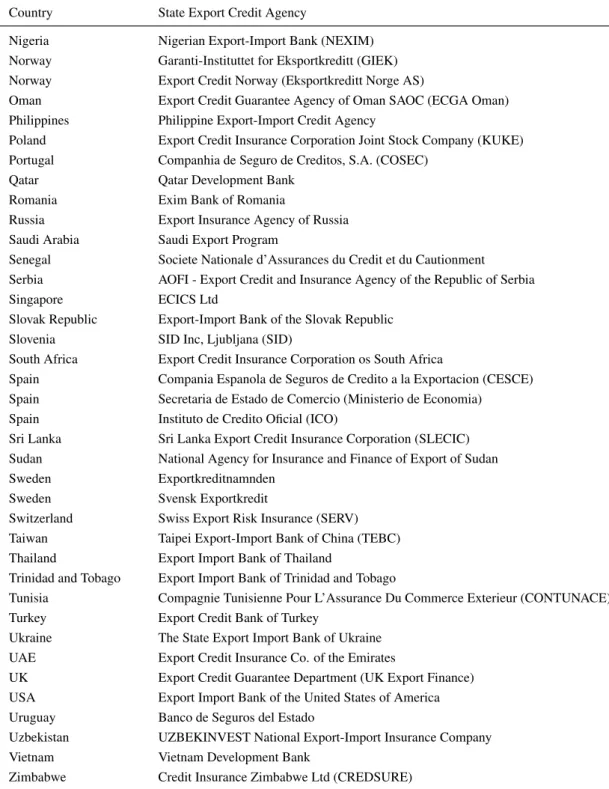
Does the US EXIM Bank Really Promote US Exports?
∗Natasha Agarwalaand Zheng Wangb,c
aWorld Education Foundation, Norway
b Leicester Business School, De Montfort University, Leicester, LE1 9BH, United Kingdom
cGEP, University of Nottingham, Nottingham, NG7 2RD, United Kingdom
24 May, 2017
Abstract
This paper investigates the impact of US Export-Import Bank (EXIM) on US exports par-ticularly in the wake of international competition from foreign national export credit agencies (ECAs). We employ a gravity framework on a country-industry-year-level panel dataset that matches EXIM authorizations with US bilateral exports. Our results depict the general ineffec-tiveness of the Bank in promoting exports within and across industries. Some heterogeneities behind the general finding are also uncovered: industries other than aerospace parts and products are more likely to benefit from EXIM authorizations, and EXIM authorizations to larger busi-nesses seem to be more effective in encouraging exports. Furthermore, we find no evidence that explains the role of EXIM in encouraging US exports by offsetting foreign ECA competition. These results are neither affected by competing countries’ membership to the OECD Arrange-ment nor by the size of American firms that received EXIM support. Our results cast doubt on the ubiquitously positive claims made by the Bank and its supporters, yet also provide policy lessons for countries that are either in the inception stages of establishing their own ECAs or are now placing greater importance on ECA financing in encouraging exports.
Key Words:Trade credits; EXIM; export competition; value chain; US
JEL Classifications:F13, F14, F55
∗
We thank seminar participants at Fudan University, Shanghai University of Finance and Economics, and the University of Dundee for their helpful comments, and Magnus Lodefalk and Abishek Choutagunta for their help with some of the data. We also thank Louis Dupuy for his invaluable suggestions. All remaining errors are our own. Responsibility of the views, opinions, suggestions and analysis in this article lies solely with the authors and does not reflect the institutions they belong to. Agarwal: World Education Foundation, Norway; Email:[email protected]. Wang: Leicester Business School, De Montfort University, Leicester, LE1 9BH, United Kingdom; Email:[email protected].
Does the US EXIM Bank Really Promote US Exports?
Abstract
This paper investigates the impact of US Export-Import Bank (EXIM) on US exports par-ticularly in the wake of international competition from foreign national export credit agencies (ECAs). We employ a gravity framework on a country-industry-year-level panel dataset that matches EXIM authorizations with US bilateral exports. Our results depict the general ineffec-tiveness of the Bank in promoting exports within and across industries. Some heterogeneities behind the general finding are also uncovered: industries other than aerospace parts and products are more likely to benefit from EXIM authorizations, and EXIM authorizations to larger busi-nesses seem to be more effective in encouraging exports. Furthermore, we find no evidence that explains the role of EXIM in encouraging US exports by offsetting foreign ECA competition. These results are neither affected by competing countries’ membership to the OECD Arrange-ment nor by the size of American firms that received EXIM support. Our results cast doubt on the ubiquitously positive claims made by the Bank and its supporters, yet also provide policy lessons for countries that are either in the inception stages of establishing their own ECAs or are now placing greater importance on ECA financing in encouraging exports.
Key Words:Trade credits; EXIM; export competition; value chain; US
1 Introduction
The positive role of trade financing in facilitating international trade is ubiquitously agreed and confirmed by researchers (e.g.Chor and Manova,2012;Manova,2013). Nevertheless, the impact of trade financing provided by national export credit agencies (ECAs) is much less in the clear. While one camp advocates ECA financing and endorses its positive effect on a country’s exports and jobs, the other camp doubts the efficiency of this non-market intervention and raises concern about the unintended distortions brought about by such government interventions.1 In the US, this debate reached its climax when its Export-Import Bank (EXIM), the official export credit agency (ECA) of the country, closed to new business after June 30, 2015.2 Despite the sharp controversy around the functions of the EXIM Bank, surprisingly no systematic evidence exists in the academic literature regarding the effectiveness of the US EXIM Bank in promoting trade.
In this paper, we attempt to steer this debate into clarity by investigating whether and how – if any – support (in the form of authorizations) provided by the US EXIM Bank affects US exports. We try to uncover the heterogeneity under this potential export-promoting effect of EXIM authoriza-tion across various dimensions including industries, regions, and size of American companies that received EXIM support.3 We then move on to examining whether the potential export-promoting effect of EXIM authorization is affected by competition from other countries’ ECA-financed export-ing activities particularly in the wake of international institutional arrangements such as the OECD Arrangement on Officially Supported Export Credits (the Arrangement hereafter).
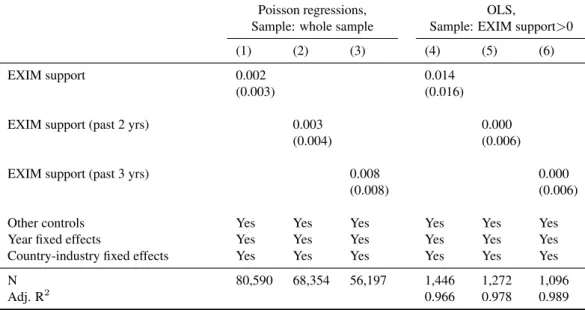
Using panel data on US export flows disaggregated by receiving country, industry, and year, our first set of results provide no detectable evidence on the export-promoting effects of EXIM au-thorization. However, further inspection reveals that this insignificant effect masks heterogeneities: EXIM authorizations to all sectors, except for aerospace products and parts (NAICS 3364), have a significantly positive, albeit small effect on US exports, and that this effect is only observable for American companies that are not classified as small by the Bank.4 Furthermore, we find that the
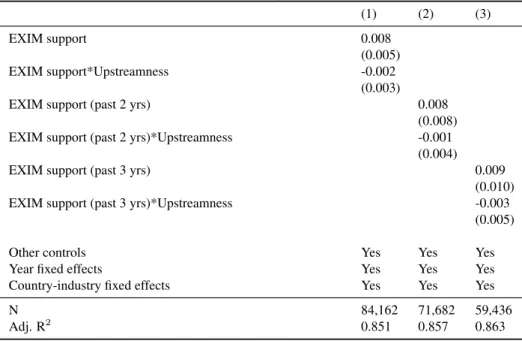
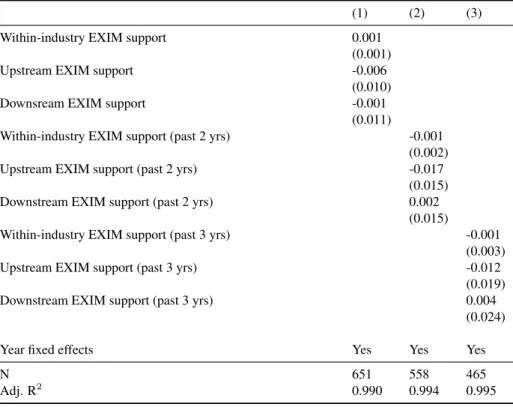
positive average export-promoting effect of EXIM authorization is not affected by competition from exporting activities financed by foreign governments’ ECAs, and that this effect is neither affected by foreign governments’ accession to the Arrangement nor by the size of American companies that received EXIM assistance. In addition, the general ineffectiveness of EXIM authorization is robust when taking into account the heterogeneity with an industry’s position in the value chain, and when accounting for the possibility of influences that may spill over across sectors.
The above results have important policy implications for policymakers in the US as well as in other countries. Our research highlights the importance of going beyond evaluating a general
export-1SeeJames(2011) for a review of the viewpoints of both camps.
2On December 4, 2015, the Bank was reauthorized by the Congress for business as usual. 3
We look at these dimensions because of its explicit focus in the US EXIM Bank Charter.
4
The US EXIM Bank adopts the qualifying criteria for “small business” from the U.S. Small Business Administration (SBA) definition. SBA has established a “Table for Small Business Size Standards” for industries in the North American Industry Classification System, where the size standards are based on either annual sales or average employment. The latest table updated on February 26, 2016 can be accessed from the SBA website athttps://www.sba.gov/sites/default/ files/files/Size Standards Table.pdf.
promoting effect of ECA financing, and exploring the heterogeneity behind this general effect that is related to country and industry characteristics. It calls attention to the significance of ECAs in offset-ting competition from other countries’ ECA-financed exporoffset-ting activities. Consequently, it revives the political debate on whether resorting to domestic institutions is the answer to improving trade competitiveness without leading to protectionism and market distortions (domestically and interna-tionally. It also rekindles the debate on countries’ binding constraints under various international institutional arrangements, and the countering effect on countries’ international commitments as a result of their accession to these arrangements.
Our analysis extends the existing studies that establish a positive and significant impact of ECA financing on ECA country exports. In a pioneering study, Egger and Url(2006) analyze Austrian export flows disaggregated by receiving country and 2-digit industry, and show that export credit guarantees extended by Austria’s ECA, Oesterreichische Kontrollbank (OeKB), indeed foster eco-nomic activity, resulting in a multiplier effect of 2.8. Furthermore, OeKB financing not only results in the broadening of trade partners towards high-risk regions but also leaves the goods structure of foreign trade almost unchanged.Moseret al.(2008) analyze German export flows, disaggregated by receiving country and year, and show that export credit guarantees extended by Germany’s official ECA, Euler Hermes (Hermes), do lead to higher German exports with a multiplier effect of about 1.7. The effectiveness of ECA financing crucially hinges on both the sample of countries and the time pe-riod considered. Both studies above show a more than proportional effect of export credit guarantees on export volumes with short-run effects of ECA financing on export volumes being smaller than long-run effects. This is argued to be largely because of the lag between the day when a guarantee is authorized and the actual shipment of the good.
In a similar vein, Felbermayr and Yalcin(2013) study German export flows disaggregated also by receiving country and 2-digit industry, and document that a 1% increase in export credit guaran-tees extended by Hermes, boosts exports on average by about 0.012%. Moreover, they show that the effectiveness of Hermes in increasing exports varies across sectors, regions and income groups. In particular, Hermes effect is large in a small number of sectors which are aviation, shipbuilding and transportation sector. Characterized by high time-to-build lags and large external financial de-pendence, these sectors indicate that Hermes’ guarantees alleviate sectoral financial frictions. Lastly, they show that Hermes does not play a strong role in reducing the impact of financial frictions in im-porting countries on German exports. Likewise, the positive Hermes effect becomes smaller for less vulnerable sectors in terms of credit constraints. Additionally, they show that Hermes have helped contain export collapse during the recent financial crisis of 2008, particularly in sectors with higher credit constraints. At a more disaggregated level,Badinger and Url (2013) analyze a cross-section of 178 firms for the year 2008, and show that export credit guarantees extended by OeKB increase firm-exports from some 80% to 100%. More so, the effect of export credit guarantees is larger for exports to countries with higher credit risk. The generally positive pro-trade impact of trade credits is confirmed in some other studies with data collected either from Berne Union or individual export credit insurer (van der Veer,2015;Korineket al.,2010;Auboin and Engemann,2014).
bank-intermediated trade finance, particularly at times of financial distress at the banks, reduce the volume of exports for firms that continue exporting to a given product-destination market (i.e. intensive margin), and have no impact on the probability that a firm exists or enters new product or destina-tion markets (i.e. extensive margin) (Amiti and Weinstein,2011;Paravisiniet al.,2014;Prete and Federico,2014). They argue that lack in bank-intermediated trade finance reduces exports through raising the variable cost of production rather than the sunk cost of entry investments.
Last, our research is linked to an increasing body of literature on the impact of trade finance on a country’ level and pattern of international trade, both at the macro- and micro- level (e.g.Chor and Manova,2012;Manova,2013;Manovaet al.,2015). This line of research argues that financial comparative advantage alleviates the substantial sunk, fixed, and variable costs of trade such that financially developed economies export more, especially in financially vulnerable sectors, through entering more markets, shipping more products to each destination, and selling more of each product. While our empirical approach is closed related to Egger and Url (2006), Moseret al.(2008), andFelbermayr and Yalcin(2013), we make several distinctive extensions and contributions to this growing body of literature. First, to the best of our knowledge about the academic literature, we provide the first rigorous evaluation of the effectiveness of US EXIM Bank, a dominant player in the world EXIM financing. Second, this is the first paper that provides evidence on whether EXIM authorization enables domestic exporters to overcome the competition emanating from foreign gov-ernment ECA financing, particularly in cases where foreign govgov-ernment ECAs are acceded to the OECD Arrangement. Finally, we investigate whether and how EXIM financing enables exporters to move up the industrial chain and evolve itself in the global value chain, offering the first evidence of its kind in the context of global production networks.
The rest of the paper is structured as follows. Section2sets out the conceptual framework elab-orating the possible channels and directions in which ECA financing would affect aggregate exports. Section3proposes an empirical gravity model for the estimation of the effect of EXIM support. Sec-tion4provides an institutional background on the US EXIM Bank. Section5describes the data and offers descriptive evidence. Section6 presents our results and analysis of the possible influencing channels. Section7 concludes this paper with a discussion on the limitations and possibilities of future research.
2 Conceptual Framework
To export is not cost free. It requires substantial upfront costs in the form of sunk, fixed, and variable costs. While export-related sunk and fixed costs could include learning about the prof-itability of potential export markets, making market-specific investments in capacity/product cus-tomization/regulatory compliance, and setting up and maintaining foreign distribution networks, variable costs could include shipping, duties and freight insurance, and any variable production costs (Manova,2013). These costs have to be incurred before the export revenues are realized where the
realization can be deferred because of potential delays in cross-border shipping and delivery.5 Owing to the risks6associated with the realization of export revenues and yet the financial need to provide for export-related costs tied to and in support of international trade transactions, firms prefer financing through an active trade finance market to utilizing their retained earnings or inter-national cash flows from operations. This preference is evident in the fact that 80% to 90% of trade transactions involve some credit, insurance or guarantee, from various players including multilat-eral financial institutions, regional development banks, ECAs, and commercial institutions (Auboin,
2009b).7 While private banks account for some 80% of the trade finance market through lending (Auboin, 2009b), ECAs are now becoming ever more popular in this market, largely due to the changing role played by ECAs in trade finance: from being lenders/insurers of last resort8, to
per-forming secondary market operations in the form of securitization or refinancing guarantees9, and to being a public interventionist especially in times of crisis10, among others. In a survey conducted by the International Chamber of Commerce, only 6.5% of the bank respondents agree that ECAs do not help in narrowing trade finance gaps with the remaining 93.5% agreeing at various levels: 18.5% agreeing that they help ‘very little’, 46.7% agreeing that they help ‘somewhat’, and 28.3% agreeing that they help ‘to a great extent’ (ICC,2016). ECAs silently assumes risk in the trade finance markets and thereby provide necessary protection in various forms of financial support.
Despite the importance of ECAs in the trade finance market, its implications on country-level exports continues to remain a conundrum.11 Does ECA-financing have a positive, negative, or no impact on country exports? If yes, then what are the potential channels through which these effects are mediated?
Existing research including Egger and Url (2006), Moser et al. (2008), and Felbermayr and Yalcin(2013) provide evidence on the positive impact of Austrian and German ECAs have had on
5
Potential delays in cross-border shipping and delivery could be for a number of reasons including port handling, customs clearances, border compliance, and documentary compliance, among others.Manova(2013) reports that typically, cross-border shipping and delivery take 60 days longer to complete than domestic orders.
6Risks here could be commercial where one of the parties involved is unable to fulfill its part of the contract. For
instance, on the one hand, an exporter may not be able to secure payments for his merchandise in case of bankruptcy or insolvency of the importer or rejection by the importer. On the other hand, the importer bears the risk of alteration or delayed delivery of goods. Besides commercial risk, traders further have to deal with exchange rate fluctuation risk, country risk, transportation risk, and political risk (Auboin and Meier-Ewert,2003).
7
SeeAuboin and Meier-Ewert(2003) for a list of traditional actors and instruments of a trade finance market.
8The US EXIM Bank is one such example where the Bank acts as a lender/insurer of last resort for credit-worthy
foreign importers of US goods and services.
9
For instance, the German ECA (Euler-Hermes) provides for a securitization guarantee scheme under the name “Verbriefungsgarantie, details of which can be found at http://www.agaportal.de/en/aga/produkte/ verbriefungsgarantie.html. For more details on securitization and refinancing guarantees scheme seeISMED(2011).
10The financial crisis of 2008 witnessed the bulk of the support provided by ECAs essentially with programs for
short-term lending of working capital and credit guarantees aimed at SMEs. While for certain countries the commitment is very large (German and Japan), for other countries very large lines of credit have been granted to secure supplies with key trading partners (Auboin,2009a). For instance, the US and China agreed that their respective ECAs would make an additional US$20 billion available for bilateral trade, and the US and South Korea made a similar commitment for US$3 billion (https://www.wto.org/english/thewto e/coher e/challenges e.htm). Efforts of government-back institutions heightened due to estimated market gap to be around US$25 billion which private sector was unable to provide for.
11
For simplicity, in our discussion, we assume that all firms in the economic system are eligible for ECA financing, and that firm characteristics such as firm size, firm productivity, amongst others, which could have an impact on the demand for ECA financin, are assumed away.
these countries’ exports respectively. They postulate that ECA financing reduces profit uncertainty on the exporter’s side stemming from the default risk on the importer’s side. Reduction in uncertainty and risks, therefore, encourages exporters to engage in greater cross-border trading activities thereby increasing country exports (Moseret al.,2008).
Risk mitigation being one channel, ECAs also have a positive impact on home-country exports through the liquidity channel. ECAs provide its home-country exporters with liquidity that enables them to overcome their continuous need of export-related costs, and offer foreign importers fluidity to pay for home country products or services. By ensuring liquidity, ECAs help its country’s exporters enter into the competitive international markets with both products and financing, encouraging home-country exports. Note that the risk mitigation and liquidity channels may not necessarily operate in silos and move in tandem. For instance, exporters with an ECA-issued export credit insurance not only insure themselves against delay/default of their foreign receivables (risk channel) but can also get financing from their banks by borrowing against the insurance policy (liquidity channel).12 Likewise, being financed by an ECA-backed direct loan not only ensures exporters/importers of enhanced fluidity (liquidity channel) but also, by transferring importers’ debt obligation incurred in the purchase of ECA country’s exports, protects exporters against defaulting importers or delayed import payments as well as provides flexibility to the importer in repaying the loan which further reduces the risk of default on repayment (risk channel). Alternatively, by assuming credit risk of private-financiers (risk channel) through refinancing guarantees or securitization, ECAs facilitate private financiers access to the funds they need for granting export credit that could then be passed on to the borrower (liquidity channel). Therefore, by responding to risk and inadequate liquidity in the trade finance market through various instruments, ECAs encourage its home country’s exports.13 The magnitude of the potential positive impact of ECA financing on country exports, however, depends on a host of factors. For instance, destinations with a higher degree of information barriers and insecurity should benefit more strongly from ECA financing, independently of the industry struc-ture (Egger and Url,2006). Besides, industries that produce capital goods which are sophisticated, expensive, and involve long lead times with complex supply chains; and/or industries that demand a greater external financial dependence because of continuous investments requirements, large ges-tation periods, longer cash harvest periods, high R&D, or high working capital, should benefit more strongly from ECA financing, particularly in counter-cyclical periods. This is because if demand dries up as a result of a financial failure or other types of globalization shock, there is a risk that the production losses will be permanent.14 In such cases, ECAs provide with necessary trade finance thereby preventing export and trade flow declines.
While ECAs’ ability to complement risk with liquidity cannot be refuted, there are also a number 12Payment default/delay can happen for a number of reasons such as the borrower becoming insolvent, adverse measures
taken by foreign governments or warlike events arise, among others.
13
While there appears to be no literature that attempts to identify when and which form of ECA-backed trade financing instruments is used, there are such studies on bank-intermediated trade finance instruments (seeAuboin and Engemann
(2013) for a review).
14
http://www.exim. gov/news/archives/speeches/us-exports-competitiveness-and-export-import-bank-united-states.
of factors which may eliminate or even reverse any export-enhancing benefits of ECA financing.15 For instance, because of government mandate or strategic objective ECAs may reallocate capital that would have been put into other uses.16 Unless reallocation of resources addresses market failure,
economic efficiency may be lost. By taking resources from general economic uses and putting them to less-efficient uses, the bank creates distortions in the economy and imposes opportunity costs that are probably higher than the value-added generated from ECA intervention. Besides, ECAs may un-derstate the economic costs of export financing by assuming that they have special insights or access to information which private financiers do not have and hence are in a better position to evaluate the creditworthiness of a transaction.17 As a result, ECAs may miscalculate the risk associated in cross-border activities, create a systematic bias for ECA financing, and crowd out private financiers who would be better able to lend on terms that reflect the market value and risk of projects. At best, distortive allocations may not generate additional exports as expected; at worst, the mercantilistic interventionism by ECAs may actually reduce exports.
It can therefore be derived that while ECA financing can affect aggregate exports via its impact on the cost to trade or the demand for ECA country’s exports, the actual net effect is subject to empirical findings. In what follows, we use a modified gravity model to estimate the reduced-form net effect of ECA financing, and the estimation stands open to empirical irregularities which may influence the effect in various ways.
3 Empirical Methodology
Based on the theoretical underpinning of the gravity model of trade (e.g.Anderson and van Win-coop,2003), market clearance and general equilibrium imply that bilateral trade between countries can be expressed as Xijkt=ef(Sjkt)Ejkt Yikt Ykt τijkt PiktPjkt 1−σk , (1)
where exports of goodkfrom country ito countryjin yeart,Xijkt, depend on a range of factors: countryj’s expenditure onkint,Ejkt; an adjustment factoref(·)which is a function of US EXIM supportSjkt for importing countryj on sectorkin yeart; the share of countryiin the world pro-duction of k int, Yikt
Ykt; bilateral trade costs τijkt; and multilateral resistance terms PiktPjkt. The parameter σk, which is assumed to be greater than one, is the elasticity of substitution specific to goodkand common across countries. Note that the adjustment factoref(·)broadly accommodates the aforementioned various influencing channels of EXIM financing on exports, and is thus intended to capture the reduced-form net effect of US EXIM support.
15
The understanding of potential drawback of ECA intervention has been drawn fromJames(2011).
16
The US EXIM Bank is one such example where congressional mandate/strategic objective may govern or define its credit authorization portfolio.
17
Vanessa Weaver, a member of the Board of Directors of the US EXIM Bank, was quoted saying that while private financial institutions do not have enough information to assess which transactions are creditworthy, the Bank personnel can go in to a minister of finance or the president of a company and ask for accounting records that are audited under IAS rules thereby ensuring the required push for reforms and the kind of structures that are needed. SeeWeaver(2002).
Taking natural logarithms of the both sides of (1) and settingi=U Sgives lnXjktU S =f(Sjkt) + lnEjkt+ ln YktU S Ykt + (1−σk)[lnτjktU S−(lnPktU S+ lnPjkt)]. (2)
A challenge in practice with the estimation of the above specification is that it is difficult to find data for all the variables Ejkt,
YU S kt
Ykt , τ
U S
jkt, PktU S, and Pjkt that are time variant for disaggregated industries (NAICS4 level).18 To overcome this difficulty, we make assumptions that the values of
Ejktand
YU S kt
Ykt are time functions of their base-year values, and the variablesτ
U S
jkt,PktU S, andPjktare proportional to their country-level counterparts with the proportions remaining stable over time:
Ejkt ≡ eδtEjk, YktU S/Ykt ≡ eθtYkU S/Yk, τjktU S ≡ eλkτU S jt , PktU S ≡ eγkPU S t , Pjkt ≡ eµkPjt. (3)
Now inserting (3) into (2) and further assuming the linearity off(·)(i.e. f(Sjkt) = αSjkt) and the constancy of the elasticity of substitution between all goods (i.e.σk =σ), we have
lnXjktU S = αSjkt+ lnEjk+ ln YU S k Yk + (1−σ)[lnτjtU S−(lnPtU S+ lnPjt)] +δt+θt+ (1−σ)(λjk−γk−µk). (4)
Merging overlapping parameters, we have the following equation for empirical estimation:
lnXjktU S = αSjkt+ (1−σ)[lnτjtU S−(lnPtU S+ lnPjt)]
+φt+ηjk+ZjktΓ+jkt, (5)
where the vectorZjkt contains additional controls,φtcaptures all unobserved time-specific factors, ηjk absorbs all country-industry-specific factors including the time-invariant variableEjk, and the error termjkt represents the white noise of the model.
As the standard practice in the empirical gravity literature, we assume bilateral trade costsτj,tU S to be a function of a number of geographical, cultural, and institutional factors:
τjtU S ≡ exp(ρ1distU Sj +ρ2langjU S+ρ3contigjU S+ρ4legjU S+ρ5currU Sj +ρ6colU Sj
+ρ7wtoU Sjt +ρ8rtaU Sjt ), (6)
wheredistU Sj is the logged geographical distance between country j and the US weighted by the 18Despite a large number of missing records, the UN-INDSTAT database provides data on industrial output for 2-digit
ISIC sectors of many countries, but not on price. The same applies to OECE-STAN database which covers even less countries. Data on country-industry-year specific demand is also unavailable.
population of countries, langjU S is a dummy which takes on the value of one if country j has the same official language (i.e. English) as the US and zero otherwise,contigjU Sis a dummy for sharing the border with the US,legU Sj is a dummy for having the same legal origin as the US,currU Sj is a dummy for sharing the same official currency (i.e. the US dollar) as the US,wtoU Sjt the dummy for the partner country being a member of GATT/WTO as is the US, andrtaU S
jt the dummy for being in a common regional free trade agreement with the US.
FollowingBaier and Bergstrand(2009) andBergeret al.(2013), the multilateral resistance terms, lnPtU S+lnPjt, are approximated by a first-order log-linear expansion of the nonlinear price equation system inAnderson and van Wincoop(2003). Specifically, it is shown that under the assumption of symmetry of bilateral trade costs, the multilateral resistance terms can be expressed as GDP-weighted average trade costs:
lnPtU S+ lnPjt = N X l=1 ωl,tlnτj,l,t+ N X l=1 ωltlnτltU S+ N X l=1 N X m=1 ωltωmtlnτkmt, (7)
whereωlt≡Ylt/Ytis the share of countrylin world GDP.
Plugging (6) into (7) gives a function of the multilateral resistance terms as a linear combination of observable components of trade costs as in (6):
lnPtU S+ lnPj,t = ρ1Qdistj +ρ2Qlangj +ρ3Qcontigj +ρ4Qlegj +ρ5Qcurrj +ρ6Qcolj
+ρ7Qwtojt +ρ8Qrtajt , (8) where Qsj ≡ N X l=1 ωltsjl+ N X l=1 ωltsU Sl + N X l=1 N X m=1 ωltωmtskm,
f or s=dist, lang, contig, leg, curr, col
Qsjt ≡ N X l=1 ωltsjlt+ N X l=1 ωltsU Slt + N X l=1 N X m=1 ωl,tωmtskmt, f or s=wto, rta.
Therefore we can now control for trade costs and multilateral resistance terms jointly using the same set of observable variables:
lnτj,tU S−(lnPtU S+ lnPj,t) = ρ1(distU Sj −Qdistj ) +ρ2(langU Sj −Q
lang j ) +ρ3(contigU Sj −Q contig j ) +ρ4(leg U S j −Q leg j )
+ρ5(currjU S−Qcurrj ) +ρ6(coljU S−Qcolj )
4 Background of the US EXIM Bank
Founded in 1934, the US EXIM Bank is the official export credit agency of the United States. It operates as an independent, self-sustaining, and wholly owned corporation of the US government. Its mission is to create and sustain US jobs by financing and facilitating the exports of US goods and services, providing competitive export financing, and ensuring a level playing field for US goods and services in the global marketplace. The Bank in exercising its functions, supplements and en-courages, and not competes, with private financiers. As a matter of fact, the Bank is encouraged to consider the need to involve private financiers while determining whether to provide support for a transaction. This is evident in the fact that about 98% of the Bank’s transactions include a partnering private financial entity (US EXIM Bank,2014). While the Bank assumes credit and country risk that private financiers are unwilling or unable to accept by providing financing at terms competitive with foreign ECAs, it must balance this risk by ensuring reasonable assurance of repayment for its credit authorization.19
Given congressional mandate or its own strategic objective, the Bank supports certain types of exports. For instance, on the one hand, the Bank is mandated to make available not less than 25% of its authorized capital to small and medium enterprises, and at the same time it must promote greater financing to projects that focus on renewable energy and sub-Saharan African region.20 On the other hand, the Bank also strategically provides competitive financing to certain industries perceived with high potential for US export growth which comprise of agribusiness, aircraft and avionics, satellites, mining, oil and gas development, and power generation involving renewable energy. Besides indus-tries, the Bank strategically targets nine key markets which it identifies as high potential emerging economies: Brazil, Colombia, Mexico, Turkey, South Africa, Nigeria, India, Indonesia, and Vietnam (US EXIM Bank,2013b).
Internationally, the Bank abides by the disciplines laid out under the OECD Arrangement on Officially Supported Export Credits.21 The Arrangement is a “Gentlemen’s Agreement” negotiated
by the participants to the Arrangement.22
19Section 2(b)(1)(B), the Charter of the Export-Import Bank of the United States (the Charter hereafter), updated
Febru-ary 29, 2016.
20
The Bank does not have a quantitative target to promote the exports of goods and services related to renewable energy sources, and to promote financing to sub-Saharan Africa. See in the Charter Section 2(b)(1)(E)(v) for small business, Section 2(b)(1)(K) for renewable energy, and Section 2(b)(9)(A) for Sub-Saharan Africa.
21The main purpose of the Arrangement is to provide a framework for the orderly use of government-backed export
financing (within the participating countries), with the goal of encouraging competition among exporters based on quality and price of goods and services rather than on the most favorable government-backed financing terms and conditions. The financing terms and conditions could be related to minimum interest rates, risk fees, and maximum repayment terms. The OECD views the Arrangement as “rules” defining constraints on members’ lending activity.
22
The participants to the OECD Arrangement currently are: Australia, Canada, the EU, Japan, South Korea, New Zealand, Norway, Switzerland and the United States (for the purpose of this paper, countries in the EU are taken from
https://www.gov.uk/eu-eea.). Brazil is a participant to the Sector Undertaking On Export Credits For Civil Aircraft. Information on participating countries has been gathered from the Agreement on Officially Supported Export Credits, February 1, 2016, TAD/PG(2016)1.
5 Data and Descriptive Statistics
The US EXIM support data used in this study is drawn from the annual accounting reports of the Bank which is made available under the Open Government Directive.23 It contains transactional information on all authorizations that has been approved or denied by the EXIM Board of Direc-tors from 2007 through 2013.24 Transactional information includes authorized amount that has been approved including approved amount to assist small American businesses, financing program (di-rect loans, loan guarantees or export credit insurance), industry classification of the product (6-digit NAICS or 4-digit SIC code), country of the foreign buyer, among others.
To address our research question, we map the Bank’s transactional data to the US exports data extracted from UN COMTRADE.25 Using concordances from US Census Bureau and US Bureau of Economic Analysis, we aggregate the industry classification to 4-digit IO/NAICS sectors. After cleaning the data, our sample comprises of 148,708 observations resulting from a three dimensional panel of 226 countries, 94 industries, and 7 years spanning from 2007 to 2013. On the one hand, only 11% of the country-industry-year observations records no imports from the US. The remaining 89% have imports from the US at least once across all the 7 years, 62% imported from the US for all 7 years in the dataset. On the other hand, 96% of the country-industry-year observations received no EXIM authorization. The remaining 4% report to having been authorized by the Bank at least once across the 7 years, while only 0.13% report to having been authorized by the Bank for all the years in the sample period.
Figure1reveals, at both country and industry levels, a positive correlation between the total value of the Bank’s authorization portfolio and US exports, thus backing the Bank’s assertion of supporting American exporters by equipping them with financing tools necessary to compete for global sales.
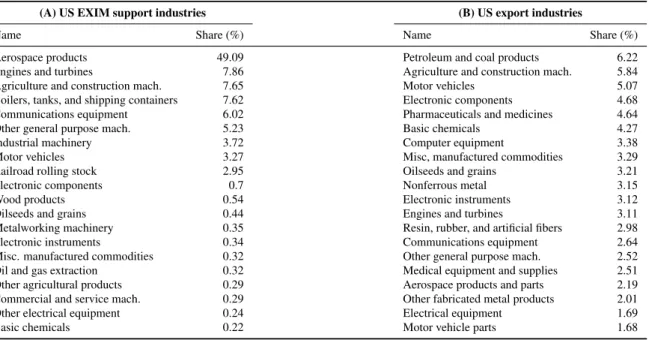
Nevertheless, Tables1and2reveal the skewed distribution of EXIM authorization across tries and industries where the Bank does not necessarily authorize its available funds to those coun-tries and induscoun-tries that dominate US exports. For instance, India received a maximum 10.96% share of the Bank’s portfolio followed by Saudi Arabia at 10.55%. However, total exports to India and Saudi Arabia accounted for only 1.46% and 1.08% share of total US exports as against the maximum 20.76% share of total US exports to Canada who received only 1.60% share in the Bank’s portfolio. In a similar vein, while aerospace products and parts (NAICS 3364) received a maximum 49.09% share of the Bank’s portfolio, its exports accounted for only 2.19% of total US exports as opposed to the maximum 6.22% share of petroleum and coal products (NAICS 3240) exports that received only
23
Data can be accessed athttp://www.exim.gov/open-government-directive.
24
The dataset reports only 2 transactions, one from each fiscal year 2012 and 2013, where the EXIM Board of Directors denied authorization. The two transactions amounted to US$61,465,615 representing a mere 0.11% of the total authoriza-tions approved for the fiscal year 2012 and 2013. We exclude the two denied transacauthoriza-tions from the dataset. The resulting dataset used in the paper comprises of all authorizations approved by the EXIM Board of Directors from 2007 through 2013.
25The Bank’s transactional data fail to provide information on US exports. We, therefore, use available information on
the country of foreign buyer, industry classification of the product, and the year of authorization, to aggregate transactions at the country-industry-time level. Much of the transactional information is lost in the process of transforming disaggre-gated transaction level data to aggredisaggre-gated country-industry-time level data. To the transformed country-industry-time level dataset, we then append the US exports data from UN COMTRADE.
AGO ARE ARG AUS AZE BEL BGD BGR BHR BOL BRA BRB CAN CHE CHL CHN CMR COD COL CRI CYM CYP CZE DEU DNK DOM ECU EGY ESP EST ETH FIN FJI FRA GBR GEO GHA GRC GTM GUY HKG HND HRV HUN IDN IND IRL IRQ ISL ISR ITA JAM JOR JPN KAZ KEN KOR KWT LBR LBY LKA LTU LUX LVA MAC MAR MDG MEX MLT MNG MOZ MRT MUS MYS NGA NIC NLD NOR NZL OMN PAK PAN PERPHL POL PRT PRY ROU RUS SAU SGP SLE SLV SRB SUR SVK SWE TGO THA TTO TUR UGA UKR URY VGB VNM ZAF ZMB slope = .38 s.e. = .05 18 20 22 24 26
Average US exports (logged, US$)
(2007−2013)
5 10 15 20
Average US EXIM authorizations (logged, US$) (2007−2013) 1111 1112 1113 1114 1119 1121 112A 1130 1140 2110 2121 2122 21233111 3112 3113 3114 3115 3116 3117 3118 3119 3121 3131 3132 3133 3141 3149 3150 31603211 3212 3219 3221 3222 3231 3241 3251 3252 3253 3254 3255 3256 3259 3261 3262 3271 3273 3279 3311 3312 3313 3314 3315 3321 3322 3323 3324 3325 3326 3327 3329 3331 3332 3333 3334 3335 3336 3339 3341 3342 3343 3344 3345 3346 3351 3352 3353 3359 3361 3362 3363 3364 3365 3366 3369 3371 3372 3379 33913399 slope = .29 s.e. = .05 20 21 22 23 24 25
Average US exports (logged, US$)
(2007−2013)
10 15 20 25
Average US EXIM aurthorizations (logged, US$) (2007−2013)
Fig. 1. US EXIM authorization and US exports by country and industry. The left panel shows the correlation between the log values of US exports and US EXIM authorization, both in US$ and taken as averages of the period 2007-2013, for all country destinations. The right panel shows the correlation between the log values of US exports and US EXIM authorization, both in US$ and taken as averages of the period 2007-2013, for all US 4-digit NAICS industries. The solid straight lines are the fitted linear trends, and the surrounding dashed lines give the 95% confidence intervals of the estimated linear trends.
0.06% share in the Bank’s authorization.
Table3shows that there is a negative correlation between what the Bank authorizes to a region in total and what it authorizes to small businesses for that particular region. For instance, for the period 2007 through 2013, Asian region received the highest share in the Bank’s total authorization portfolio of loans, guarantees and insurance at 34.4%, of which only 2% was authorized to small businesses. On the contrary, for the same period, Caribbean region received the lowest share in the Bank’s total authorization portfolio at 1.1%, of which, however, 24.7% was authorized to small businesses. It should be noted that on a global scale the Bank’s authorization to small businesses ranges from 5% to 11% for the period 2007 through 2013, which is well below the mandated authorization to small businesses at 20%.26
The definitions and summary statistics of the main variables of this research are contained in Table4. Not surprisingly, the variables for exports and EXIM authorizations have large standard deviations relative to their means as a result of the highly skewed distributions as seen from above. The gravity variables contain sufficient variations representing a wide spectrum of characteristics of US trade partners in the data. The four standardized foreign ECA competition measures show varying degrees of ECA competition US exporters face in foreign markets (see Section6.3 for the details about the construction of these measures).
26See Section 635(b)(1)(E)(v) of the US Code Title 12 “Banks and Banking”. Note that this threshold was raised to
Table 1. Top 20 US EXIM supported destinations and US export markets
(A) US EXIM support recipients (B) US export destinations
Name Share (%) Name Share (%)
India 10.96 Canada 20.76
Saudi Arabia 10.55 Mexico 14.08
Mexico 8.39 China 6.39
United Arab Emirates 6.25 Japan 4.84
Turkey 5.37 Germany 3.55
Ireland 4.96 United Kingdom 3.44
Rep. of Korea 4.73 Netherlands 3.03
China, Hong Kong SAR 4.40 Rep. of Korea 2.86
Indonesia 3.62 Brazil 2.64
Brazil 3.29 Belgium 2.21
China 3.28 China, Hong Kong SAR 2.21
Ethiopia 2.96 Singapore 2.10
Singapore 2.81 France 1.86
Russian Federation 1.95 Australia 1.81
Chile 1.78 Switzerland 1.48
Germany 1.61 India 1.46
Canada 1.60 Italy 1.12
United Kingdom 1.49 United Arab Emirates 1.10
Israel 1.46 Saudi Arabia 1.08
Netherlands 1.34 Colombia 1.04
Note. This table reports the top 20 markets, ranked by their shares in US total EXIM authorization and exports (2007-2013) respectively.
Table 2. Top 20 US EXIM supported industries and US export industries
(A) US EXIM support industries (B) US export industries
Name Share (%) Name Share (%)
Aerospace products 49.09 Petroleum and coal products 6.22 Engines and turbines 7.86 Agriculture and construction mach. 5.84 Agriculture and construction mach. 7.65 Motor vehicles 5.07 Boilers, tanks, and shipping containers 7.62 Electronic components 4.68 Communications equipment 6.02 Pharmaceuticals and medicines 4.64 Other general purpose mach. 5.23 Basic chemicals 4.27
Industrial machinery 3.72 Computer equipment 3.38
Motor vehicles 3.27 Misc, manufactured commodities 3.29 Railroad rolling stock 2.95 Oilseeds and grains 3.21
Electronic components 0.7 Nonferrous metal 3.15
Wood products 0.54 Electronic instruments 3.12
Oilseeds and grains 0.44 Engines and turbines 3.11
Metalworking machinery 0.35 Resin, rubber, and artificial fibers 2.98 Electronic instruments 0.34 Communications equipment 2.64 Misc. manufactured commodities 0.32 Other general purpose mach. 2.52 Oil and gas extraction 0.32 Medical equipment and supplies 2.51 Other agricultural products 0.29 Aerospace products and parts 2.19 Commercial and service mach. 0.29 Other fabricated metal products 2.01 Other electrical equipment 0.24 Electrical equipment 1.69
Basic chemicals 0.22 Motor vehicle parts 1.68
Note. This table reports the top 20 industries (4-digit NAICS), ranked by their shares in US total EXIM authorization and exports (2007-2013) respectively.
T able 3 . Distrib ution of EXIM funds across re gional mark ets Re gion 2007 2008 2009 2010 2011 2012 2013 T otal Africa (a):V alue (US$, million) 138.4 476.5 377.8 970.6 450.3 1480.3 513.7 4407.6 (b): Share of (a) in total EXIM authorization 3.0% 15.9% 4.5% 12.3% 4.0% 8.7% 4.1% 6.8% (c) Proportion of (a) for small b usinesses 6.0% 29.5% 10.8% 0.9% 1.7% 1.8% 7.8% 6.2% Asia (a):V alue (US$, million) 1839.6 296.6 3364.6 1522.9 5449.7 3218.6 6623.2 22315.2 (b): Share of (a) in total EXIM authorization 39.7% 9.9% 39.8% 19.3% 48.9% 18.9% 52.3% 34.4% (c) Proportion of (a) for small b usinesses 0.6% 10.2% 1.2% 9.2% 0.3% 0.4% 3.1% 2.0% Caribbean (a):V alue (US$, million) 37.4 41.9 35.5 397.7 54.6 128.5 14.1 709.7 (b): Share of (a) in total EXIM authorization 0.8% 1.4% 0.4% 5.0% 0.5% 0.8% 0.1% 1.1% (c) Proportion of (a) for small b usinesses 35.5% 38.2% 18.8% 29.6% 10.2% 7.0% 48.3% 24.7% Europe (a):V alue (US$, million) 401.6 890.1 1296.9 1987 3162.1 2089.1 3427.4 13254.2 (b): Share of (a) in total EXIM authorization 8.7% 29.6% 15.3% 25.2% 28.4% 12.3% 27.1% 20.4% (c) Proportion of (a) for small b usinesses 12.3% 1.5% 1.2% 3.5% 5.1% 1.1% 4.7% 3.7% Me xico and Central America (a):V alue (US$, million) 651 866.5 602.3 1067.1 1067.1 1909.3 596.2 6759.5 (b): Share of (a) in total EXIM authorization 14.0% 28.9% 7.1% 13.5% 9.6% 11.2% 4.7% 10.4% (c) Proportion of (a) for small b usinesses 34.6% 12.0% 51.0% 12.8% 23.9% 15.5% 47.0% 23.7% Middle East (a):V alue (US$, million) 488 2.9 2346.6 1304.5 411.4 6720.4 1313 12586.8 (b): Share of (a) in total EXIM authorization 10.5% 0.1% 27.7% 16.5% 3.7% 39.5% 10.4% 19.4% (c) Proportion of (a) for small b usinesses 2.4% 66.3% 0.2% 14.4% 0.3% 5.8% 1.2% 4.9% North America (a):V alue (US$, million) 708.7 33.2 1.2 64.6 52.9 180.8 1.5 1042.9 (b): Share of (a) in total EXIM authorization 15.3% 1.1% 0.0% 0.8% 0.5% 1.1% 0.0% 1.6% (c) Proportion of (a) for small b usinesses 0.0% 2.1% 100.0% 10.4% 15.4% 3.0% 70.9% 2.2% Oceania and South P acific (a):V alue (US$, million) 0.4 1.1 3.4 169.5 63 285 14.9 537.3 (b): Share of (a) in total EXIM authorization 0.0% 0.0% 0.0% 2.1% 0.6% 1.7% 0.1% 0.8% (c) Proportion of (a) for small b usinesses 100.0% 41.7% 15.9% 0.6% 2.2% 0.2% 7.6% 1.0% South America (a):V alue (US$, million) 371.4 394.4 433.6 573.5 503.1 1298.8 164.9 3739.7 (b): Share of (a) in total EXIM authorization 8.0% 13.1% 5.1% 7.3% 4.5% 7.6% 1.3% 5.8% (c) Proportion of (a) for small b usinesses 8.8% 8.1% 11.5% 7.8% 13.9% 8.8% 33.1% 10.6% T otal (a):V alue (US$, million) 4,636.1 3,002.1 8,458.5 7,887.9 11,151.2 17,025.8 12,654.0 64,815.6 (b): Share of (a) in total EXIM authorization 100.0% 100.0% 100.0% 100.0% 100.0% 100.0% 100.0% 100.0% (c) Proportion of (a) for small b usinesses 20.8% 22.7% 10.7% 7.2% 4.7% 2.9% 13.7% 9.1% Note. This table reports the distrib ution of US EXIM funds across re gional mark ets. F or each re gion, three ro ws of numbers are displayed: ro w (a) gi v es the v alue of EXIM authorization granted each year , ro w (b) sho ws the share of (a) in the total US EXIM authorization granted to all mark ets in that year , and ro w (c) reports the percentage of (a) that is granted to small b usinesses.
T able 4 . Definitions and summary statistics of k ey v ariables V ariable Definition N Mean S.D. Min Max Exports ( ln X U S j k t ) Log v alue of US exports of product k to country j in year t (unit of unlogged v alue: US$). Source: UN COMTRADE. 145,700 10.62 6.62 0.00 24.01 EXIM ( ln E X I M j k t ) Log v alue of US EXIM Bank authorizations for exports of product k to country j in year t (unit of unlogged v alue: US$). Source: US EXIM Bank Open Go v ernment Directi v e. 145,700 0.17 1.56 0.00 22.33 Distance ( ln dist U S j ) Log v alue of geographical distance between country j and the US weighted by city popula tion with countries. Source: CEPII Gra vity Database. 136,676 9.06 0.47 7.64 9.71 Common language ( lang U S j ) Dummy which tak es on the v alue of 1 if country j has the same of ficial language (i.e. English) as the US and zero otherwise. Source: CEPII Gra vity Database and authors’ compilation. 125,772 0.22 0.41 0.00 1.00 Common border ( contig U S j ) Dummy which tak es on the v alue of 1 if country j shares border with the US and zero otherwise. Source: CEPII Gra vity Database. 125,772 0.01 0.10 0.00 1.00 Common le g al origin ( leg U S j ) Dummy which tak es on the v alue of 1 if country j has the same le g al origin as the US and zero otherwise. Source: CEPII Gra vity Database. 125,772 0.35 0.48 0.00 1.00 Common currenc y ( cur r U S j ) Dummy which tak es on the v alue of 1 if country j has the same of ficial currenc y (i.e. the US dollar) as the US and zero otherwise. Source: CEPII Gra vity Database and authors’ compila-tion. 125,772 0.01 0.10 0.00 1.00 Colon y ( col U S j ) Dummy which tak es on the v alue of 1 if country j 1 has ev er been in a colonial relationship with the US. Source: CEPII Gra vity Database. 125,772 0.03 0.17 0.00 1.00 Members to GA TT/WT O ( W T O U S j t ) Dummy which tak es on the v alue of 1 if country j and the US are members to GA TT/WT O. Source: CEPII Gra vity Database and authors’ compilation. 125,772 0.78 0.42 0.00 1.00 Members to R T As ( r ta U S j t ) Dummy which tak es on the v alue of 1 if country j and the US are signatories to the same re gional trade agreement and zero ot herwise. Source: CEPII Gra vity Database and authors’ compilation. 125,772 0.03 0.17 0.00 1.00 F oreign ECA competition measure 1 ( Gj k t )) Standardized measure of export competition the US faces in sector k , mark et j and year t ; see eq. ( 10 ) for details. Source: authors’ calculation. 80,460 0.00 1.00 -0.20 59.59 F oreign ECA competition measure 2 ( Gj k t )) Standardized measure of export competition the US faces in sector k , mark et j and year t ; see eq. ( 11 ) for details. Source: authors’ calculation. 80,460 0.00 1.00 -0.22 51.58 F oreign ECA competition measure 3 ( Gj k t )) Standardized measure of export competition the US faces in sector k , mark et j and year t ; see eq. ( 13 ) for details. Source: authors’ calculation. 108,900 0.00 1.00 -0.18 57.01 F oreign ECA competition measure 4 ( Gj k t )) Standardized measure of export competition the US faces in sector k , mark et j and year t ; see eq. ( 14 ) for details. Source: authors’ calculation. 108,900 0.00 1.00 -0.18 55.62 Note. The subscripts j , k , and t inde x importer -country , 4-digit N AICS industries, and years respecti v ely . Columns with headings “N”, “Mean”, “S.D. ”, “Min”, and “Max” sho w the numbers of observ ations, mean v alues, standard de viations, and minimum and maximum v alues of v ariables, respecti v ely .
6 Results
6.1 Baseline results
We now turn to our formal regression analysis, looking into the estimated results of eq. (5) in various forms. Note that since our data is rectangularized (i.e. expanded so that all possible country-industry-year combinations exist) to facilitate gravity analysis, a great number of zeros are created. In our baseline regressions, we adopt three approaches to address the issue of the excessive number of zeros. First, we follow the common practice of adding one US dollar to both export and EXIM authorization values before taking logs so that all observations are kept in log transformation. Sec-ond, we replace the continuous EXIM authorization measure with an EXIM authorization indicator which takes on the value of one if a country-industry-year observation receives positive EXIM autho-rization and zero otherwise, which allows us to estimate the effect of receiving any positive EXIM authorization as a whole. Third, reported in AppendixAwe use Poisson estimations to avoid adding one to the dependent variable (i.e. exports) as suggested by (e.g.Silva and Tenreyro,2006).27
A potential bias in the estimation comes from the “selection” of projects due to the congressional mandate or strategic financing objective. In particular, if firm size is positively correlated with exports (e.g.Bernard and Jensen,1995), congressional mandate to provide a proportion of EXIM authorized capital to small and medium enterprises (SMEs) could lead to a downward bias in the estimated EXIM effect. To address this concern, first we control for the employment share of SMEs in each NAICS industry using data from the US Census Bureau.28 Second, the inclusion of country-industry fixed effects ensures that any influences from unobserved factors specific at these levels are ruled out, in particular those factors, such as geopolitical preference, that would affect the country-industry preferences in EXIM financing decisions. Lastly, by introducing time dummies, time effects common to all industries and markets are netted out.
The baseline results are reported in Table5. We find that the coefficient on the contemporaneous EXIM authorization variable, whether continuous or binary, is negative but statistically insignificant from zero when stronger specifications of fixed effects (country-industry fixed effects) are imposed in columns 2-3 and 5-6. This implies that in a given year, EXIM authorizations do not have a sizable impact on US exports with its partner countries. The sign and magnitude of the estimated elasticity of EXIM authorizations with respect to US exports stand in contrast to the positive and significant estimates found byEgger and Url(2006) for Austria,Moseret al.(2008) andFelbermayr and Yalcin(2013) for Germany, with magnitude in the range of 0.04-0.66.29We also conduct Poisson regressions and experiment on the baseline specifications using the subsample of positive EXIM
27
We only do this for the baseline specifications as the implementation of Poisson estimation on fuller models with many dummies requires extraordinarily large computational power which is beyond an ordinary workstation capacity.
28
We also try including the share of SMEs in the total number of firms in each NAICS industry, and the results remain almost identical. In addition, the exclusion of these SME share measures also does not impact the conclusions.
29
In the view of the fact that differences in the export-promoting effects of German and Austrian ECAs could be for a number of reasons such as differences in management and operations, products and facilities they offer, to name a few, and thatEgger and Url(2006),Moseret al. (2008) andFelbermayr and Yalcin(2013) do not explicitly attribute their results to any such specific factor, reference to their estimated impact is only representational and not comparative. Also seeInternational Financial Consulting Ltd.(2012) andHecker(1997) on differences across ECAs that make it difficult to compare the same.
authorization observations only. Estimates shown in TableA1, AppendixA, are qualitatively in line with the above findings. For the ease of interpretation of elasticities, our preferred estimates in the rest of the analysis remain to be the continuous EXIM authorization variable.
Note that it is possible that EXIM authorization in a given year translates into exports in the following years for two reasons. First, because we measure EXIM support as total authorization, it often takes more than one year (especially for longer-term loans) for all the authorized funds to be disbursed for trade. Second, there may exist some time gap between the authorization and the actual availability of funds for use (Egger and Url,2006;Moseret al.,2008). Therefore, to test whether EXIM authorization has an effect beyond the year of authorization, in columns 8-10 we introduce lagged EXIM authorization variables which take into account EXIM authorization in both present and past years. We find that the coefficient on the lagged EXIM authorization variable, whether continuous or binary, stay insignificant. This implies that there are no detectable time lag effects of EXIM authorization.
The above analysis consists of all industries which are treated equally in the regression. Nev-ertheless, it is evident in Table2that aerospace parts and products (NAICS 3364) enjoys the lion’s share in the EXIM’s financing portfolio, accounting for half of the Bank’s authorization. If for other controlled factors this industry has a higher tendency of exports, it is then necessary to separate this particular industry from others in estimation as the inclusion of it may lead to upward bias in the EXIM effect. Consequently, estimates presented in Table6 now show that EXIM authorization to sectors other than aerospace parts and products has a significant but very small positive effect on US export activities: we estimate an elasticity of 0.003 for the present-year effect (column 10), which suggests that an increase in EXIM authorization by 10% creates additional exports by 0.03% in the same year. If lags of EXIM authorization are accounted for, we find an increase in the magnitude of EXIM authorization effect in the range of 0.006 (column 11), suggesting that a 10% expansion in EXIM authorization generates a 0.06% increase in exports. To better grasp the economic meaning of the magnitude, we compute average elasticity. Country-industry average of EXIM authorization is about US$20.5 million and the average US exports is about US$74.3 million.30 Therefore, a 10% increase in the average annual EXIM authorization, which is US$2.05 million (20.5×0.1), creates additional exports of US$2.23 milion (74.3 ×0.03), which amounts to an economically relevant multiplier of2.23/2.05 = 1.09. A size of this multiplier means that every US$100 of EXIM au-thorization to sectors other than aerospace products, creates US$109 of additional US exports from these sectors as a whole. The size of this estimated multiplier is lower than those found for Germany at 1.7 (Moseret al.,2008) and Austria at 2.8 (Egger and Url,2006).
It should also be noted that: (a) lags of EXIM authorization beyond two years, do not have an impact on US exports (column 12), and (b) the effect of EXIM authorization is greater for model with lags (column 11) when compared to models with contemporaneous effect (column 10). As we do not find evidence of export-promoting benefits arising from EXIM authorization to the aerospace parts and products sector (columns 1-6), the remaining analysis focuses on other sectors.
30
The figures used to calculate elasticities in this section are based on the real term values corresponding to the relevant non-zero sub-samples in the dataset.
T able 5 . The ef fect of US EXIM support on US exports: baseline results Dependent v ariable: log v alue of US exports ln X U S j k t (1) (2) (3) (4) (5) (6) (7) (8) (9) (10) 1(EXIM > 0) -0.192 ∗∗ -0.011 -0.011 (0.075) (0.033) (0.033) EXIM support -0.011 ∗∗ -0.002 -0.002 (0.006) (0.003) (0.003) 1(EXIM > 0, past 2 yrs) 0.006 (0.044) 1(EXIM > 0, past 3 yrs) 0.011 (0.047) EXIM support (past 2 yrs) -0.001 (0.004) EXIM support (past 3 yrs) -0.000 (0.004) Other controls: trade cost and multilateral resistance terms, destination income per capita, bi lateral exchange rate, industry external financial dependence, share of small and medium b usinesses in sectoral emplo yment Y ear fix ed ef fects No No Y es No No Y es Y es Y es Y es Y es Industry-year fix ed ef fects Y es No No Y es No No No No No No Country-year fix ed ef fects Y es No No Y es No No No No No No Country-industry fix ed ef fects No Y es Y es No Y es Y es Y es Y es Y es Y es N 85,241 85,241 85,241 85,241 85,241 85,241 72,601 60,198 72,601 60,198 Adj. R 2 0.732 0.848 0.848 0.732 0.848 0.848 0.854 0.862 0.854 0.862 Note. This table reports baseline re gression results on the ef fect of EXIM support on US exports. The dependent v ariable is the log v alue of US exports ln X U S j k t . 1(EXIM > 0) is a dummy which tak es on the v alue of one when EXIM authorization is positi v e and zero otherwise. EXIM support is the log v alue of US EXIM authorization. The suf fix es “past 2 yrs” and “past 3 yrs” indicates v ariables that tak e last tw o or three years’ data as a whole. T rade cost and multilateral resistance terms are constructed as a function of observ able v ariables defined at the country pai r-ye ar le v el: distance, dumm ies for sharing a common of ficial language, a common border , a common le g al origin, a colonial relationship historically , and dummies for both being in GA TT/WT O and a common re gional trade agreement. Destination income per capita is GDP per capita in US$ in 2005 constant prices, and bilateral exchange rate is the exchange rate of the local currenc y ag ai nst US$, both obtained from W orld De v elopment Indicators. Industry external financial dependence measure is from Chor and Mano v a ( 2012 ), and is further multiplied with year dumm ies so that its ef fect is allo wed to v ary across both industries and years. Share of small and medium b usine sses in sectoral emplo yment is extracted from US Census Bureau and is industry-year specific. Standard errors in parentheses are clustered at country-industry le v el. Superscripts *, **, *** indicate significance at 10%, 5%, and 1% le v els respecti v ely .
T able 6 . The ef fect of US EXIM support on US exports: aerospace products vs. other products Dependent v ariable: log v alue of US exports ln X U S j k t Exports of aerospace products industry Exports of other products (1) (2) (3) (4) (5) (6) (7) (8) (9) (10) (11) (12) 1(EXIM > 0) 0.013 0.038 (0.258) (0.023) 1(EXIM > 0, past 2 yrs) -0.087 0.069 ∗∗ (0.416) (0.033) 1(EXIM > 0, past 3 yrs) -0.162 0.040 (0.492) (0.045) EXIM support 0.005 0.003 ∗∗ (0.014) (0.002) EXIM support (past 2 yrs) -0.000 0.006 ∗∗ (0.023) (0.002) EXIM support (past 3 yrs) -0.008 0.003 (0.029) (0.004) Other controls Y es Y es Y es Y es Y es Y es Y es Y es Y es Y es Y es Y es Y ear fix ed ef fects Y es Y es Y es Y es Y es Y es Y es Y es Y es Y es Y es Y es Country fix ed ef fects Y es Y es Y es Y es Y es Y es No No No No No No Country-industry fix ed ef fects No No No N o No No Y es Y es Y es Y es Y es Y es N 1,079 919 762 1,079 919 762 84,162 71,682 59,436 84,162 71,682 59,436 Adj. R 2 0.786 0.788 0.808 0.786 0.788 0.808 0.851 0.857 0.863 0.851 0.857 0.863 Note. This table reports re gression results on the ef fect of EXIM support on US exports, for aerospace industry (N AICS 3364) and other industries separately . V ariables are defined as in T able 5 . Standard errors in parentheses are clustered at country-industry le v el. Superscripts *, **, *** indicate significance at 10%, 5%, and 1% le v els respecti v ely .
6.2 EXIM financing to small businesses
We now proceed to disentangle the export-promoting effect of EXIM authorization across Amer-ican companies of different sizes. This is particularly motivated by the rising debate around the need to provide EXIM support for small exporting businesses and its potential impact on their exports. Proponents, on the one hand, argue that the value of small businesses’ exports has grown markedly in recent years because the Bank shoulders some of the risks of international deals and provides private-market alternative financing. For instance, John Murphy, the senior vice president of the US Chamber of Commerce, argues that buyers overseas increasingly expect vendors to offer financing. In such a case, without the Bank, many US small businesses would be unable to extend terms to for-eign buyers and would have to ask for cash-in-advance.31 Moreover, commercial banks often refuse to accept foreign receivables as collateral for a loan without the Bank’s guarantee.32 Opponents, on the other hand, argue that the significant growth of small businesses’ exports is unlikely to have been driven by EXIM support as the vast majority of small businesses do not get any EXIM financial assistance. For instance, according toUSITC(2010), between 1997 and 2007 the value of exports per small and medium-size business increased by 80%, yet the Bank supported only 0.04% of small business establishments in 2007 (de Rugy,2014).
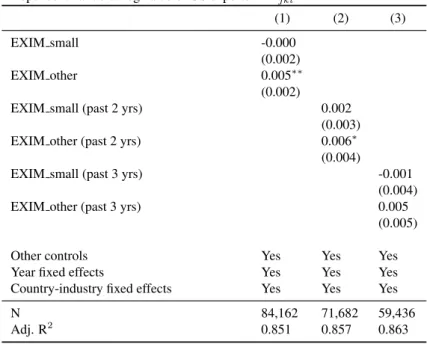
Taking these contradictory observations to the data, and estimating eq. (5) for small and non-small businesses groups, the estimates presented in columns 1-3 in Table 7 show that EXIM au-thorization to small businesses does not have an impact on their exports. On the contrary, it is the businesses that are not classified as small by the Bank that witness a positive impact of EXIM autho-rization on their exports with an upto two-year lag.
These results suggest that EXIM authorization to small exporting businesses does not serve as a strong engine for US exports. Although transactions for small business exporters increased from 85.6% of the total number of transactions in 2007 to nearly 90% in 2013, representing the highest number ever for small businesses (US EXIM Bank, 2007, 2013a), our interpretation here is that EXIM authorization to small businesses does not generate dollar value to the export kitty of the US and EXIM support is not a lifeline to small businesses’ exports as claimed by the EXIM Bank proponents.
To summarize, while the baseline results (Table5) show that EXIM authorization does not have a contemporaneous or lagged export-promoting effect, we do find that EXIM authorization to sectors other than aerospace products has a positive effect on US exports (Table6). Moreover, the positive effect is mainly driven by the Bank’s authorization to American companies that are not classified as small by the Bank (Table7) .
6.3 Foreign ECA competition
A common argument around the EXIM Bank is that without its export financing, foreign compa-nies would turn away from American goods and buy products from exporters whose countries offer
31 http://thehill. com/blogs/congress-blog/economy-budget/246347-the-arguments-for-ex-im-no-one-can-rebut. 32 http://thehill. com/blogs/congress-blog/economy-budget/246347-the-arguments-for-ex-im-no-one-can-rebut.
Table 7. The effect of US EXIM financing to small businesses on US exports
Dependent variable: log value of US exportslnXU S jkt (1) (2) (3) EXIM small -0.000 (0.002) EXIM other 0.005∗∗ (0.002)
EXIM small (past 2 yrs) 0.002
(0.003)
EXIM other (past 2 yrs) 0.006∗
(0.004)
EXIM small (past 3 yrs) -0.001
(0.004)
EXIM other (past 3 yrs) 0.005
(0.005)
Other controls Yes Yes Yes
Year fixed effects Yes Yes Yes
Country-industry fixed effects Yes Yes Yes
N 84,162 71,682 59,436
Adj. R2 0.851 0.857 0.863
Note. This table reports regression results on the effect of EXIM support extended to small businesses on US exports. EXIM small is EXIM authorization to small businesses and EXIM other is EXIM authorization to other businesses. Other variables are defined as in Table5. Standard errors in parentheses are clustered at country-industry level. Su-perscripts *, **, *** indicate significance at 10%, 5%, and 1% levels respectively.
ample export financing through its state ECAs. In other words, without US EXIM financing, Jet Airways33would not buy any Boeing aircrafts but would instead buy Bombardier aircrafts to benefit from export financing provided by the Canadian ECA, Export Development Canada.
In situations where export financing is indeed provided by the US EXIM Bank, there is a pos-sibility that foreign companies may still not purchase American goods and instead buy goods from exporters whose countries are not regulated by the OECD Arrangement. This is because countries who are not participants to the OECD arrangement are not obligated to comply with the OECD limi-tations on the terms and conditions of export credit activity, and hence are able to provide for export credit at flexible terms and conditions.40 If we add another aircraft exporting country, China, into our example above, it would then imply that even if the US EXIM Bank, an ECA whose export credit activity is regulated by the Arrangement, provides export financing to Jet Airways to purchase Boeing aircraft, Jet Airways would probably opt to buy Chinese-made aircrafts as the export credit activities of China are not regulated by the Arrangement and hence are more able to provide lenient export credit terms and conditions to Jet Airways compared to what an Arrangement-regulated-US-EXIM-Bank would have offered.
Anecdotal evidence also suggests that American exporters, without EXIM authorization, could have been at a disadvantage to foreign-ECA-financed-exporters, particularly to the ones that are not regulated by the Arrangement. For instance, John Murphy, the senior vice president of the US Chamber of Commerce, gives the example of a firm that sells US medical equipment in the Chinese
33
market who would not qualify to bid to do business in the Chinese health care system without the US EXIM Bank.34 In a similar vein, the D.C. District Court found that, without US EXIM support “airlines simply will purchase from Airbus instead of Boeing due to presence of foreign [export credit agency financing]”.35
Even in situations where the US EXIM Bank actually provides export financing to support Amer-ican exports, it is argued that the sheer volume of unregulated (by the Arrangement) ECA financing could have put American exporters at a financing disadvantage in the global marketplace. This is only evident in the fact that China, a non-Arrangement-compliant country, provided its exporters with at least US$670 billion in ECA financing over a period of two years, while the US EXIM has equipped American exporters with only about US$590 billion in financing over its entire 81-year history (US EXIM Bank,2015).36
However, anecdotal evidence suggests that, whether to counteract foreign export credit agency competition, export financing provided by the US EXIM Bank may not have necessarily contributed to US exports. This is because a large portion of export financing is drawn from sources other than the US EXIM Bank. For instance, for the year 2013 and 2014, we estimate less than one-third of the esti-mated export value, i.e. US$12.2 billion in 2013 and US$8.69 billion in 2014, of the Bank’s portfolio being directed to counteract competitive disadvantages created by foreign governments’ ECA trade financing activities.37 Besides, in 2013 (2014), only 15% (11%) of total large commercial aircraft delivered by Boeing was “ECA supported” by the Bank while a whopping 48% (54%) was “ECA eligible, but not supported” (US EXIM Bank,2013a,2014). In fact, in a ruling on the Delta versus US EXIM Bank case, D.C. District Court asserts that EXIM financing is three times more expensive than Enhanced Equipment Trust Certificate (EETCs), which are asset-backed bonds used by domes-tic airlines to finance plane purchases.38 Even, between the participants to the OECD Arrangement, ECAs have increasingly turned to tools outside of the Arrangement (e.g. market windows, untied financing, and investment support) to finance projects abroad (US EXIM Bank,2015).
Given these opposing anecdotal evidence, in this section we investigate this rising debate on whether US EXIM authorization enables US exporters to compete with foreign exporters that receive ample financing from their home-country ECAs. To do so, we use a number of measures to capture the effect of the competition the US faces from exports supported by other countries’ ECAs. The first measures is constructed as
34http://www.washingtonexaminer.
com/the-pros-and-cons-of-reauthorizing-the-export-import-bank/article/2551068.
35https://www.uschamber.com/above-the-fold/costs-closing-ex-im-mount-house-vote-nears
.
36According to the Office of the U.S. Trade Representative, the OECD Arrangement reportedly has saved US taxpayers
about US$800 million annually. The information can be accessed from the website of Office of United States Trade Representative athttps://ustr.gov/trade-agreements/wto-multilateral-affairs/oecd.
37
The requirement to categorize all loans and long-term guarantees in its annual report came through in the reauthoriza-tion of the US EXIM Bank in 2012. Therefore, we are able to calculate the estimated export value directed to meet foreign ECA competition for the years 2013 and 2014.
38http://thehill.