Wright State University Wright State University
CORE Scholar
CORE Scholar
Browse all Theses and Dissertations Theses and Dissertations 2018
Using Natural Language Processing and Machine Learning for
Using Natural Language Processing and Machine Learning for
Analyzing Clinical Notes in Sickle Cell Disease Patients
Analyzing Clinical Notes in Sickle Cell Disease Patients
Shufa KhizraWright State University
Follow this and additional works at: https://corescholar.libraries.wright.edu/etd_all
Part of the Computer Engineering Commons, and the Computer Sciences Commons
Repository Citation Repository Citation
Khizra, Shufa, "Using Natural Language Processing and Machine Learning for Analyzing Clinical Notes in Sickle Cell Disease Patients" (2018). Browse all Theses and Dissertations. 2234.
https://corescholar.libraries.wright.edu/etd_all/2234
This Thesis is brought to you for free and open access by the Theses and Dissertations at CORE Scholar. It has been accepted for inclusion in Browse all Theses and Dissertations by an authorized administrator of CORE Scholar. For more information, please contact [email protected].
Using Natural Language Processing and Machine
Learning for Analyzing Clinical Notes in Sickle
Cell Disease Patients
A Thesis submitted in partial fulfillment
of the requirements for the degree of
Master of Science
by
Shufa Khizra
B.S.C.S., Andhra University, 2014
2018
Wright State University GRADUATE SCHOOL
December 5, 2018
I HEREBY RECOMMEND THAT THE THESIS PREPARED UNDER MY SUPER-VISION BY Shufa Khizra ENTITLED Using Natural Language Processing and Machine Learning for Analyzing Clinical Notes in Sickle Cell Disease Patients BE ACCEPTED IN PARTIAL FULFILLMENT OF THE REQUIREMENTS FOR THE DEGREE OF Master of Science.
Tanvi Banerjee, Ph.D. Thesis Director
Mateen Rizki, Ph.D. Chair, Department of Computer Science and Engineering
Committee on Final Examination Tanvi Banerjee, Ph.D. Michelle Cheatham, Ph.D. Mateen Rizki, Ph.D. Barry Milligan, Ph.D.
ABSTRACT
Khizra, Shufa. M.S., Department of Computer Science and Engineering, Wright State University, 2018. Using Natural Language Processing and Machine Learning for Analyzing Clinical Notes in Sickle Cell Disease Patients.
Sickle Cell Disease (SCD) is a hereditary disorder in red blood cells that can lead to
excruciating pain episodes. SCD causes the normal red blood cells to distort its shape and
turn into sickle shape. The distorted shape makes the hemoglobin inflexible and stick to the
walls of the vessels thereby obstructing the free flow of blood and eventually making the
tissues suffer from lack of oxygen. The lack of oxygen causes serious problems including
Acute Chest Syndrome (ACS), stroke, infection, organ damage, and over the lifetime an
SCD can harm a persons spleen, brain, kidneys, eyes, bones. Sickling of RBC can be
triggered by a number of conditions such as dehydration, acidity, low levels of oxygen,
stress, and change in temperature. There is no specific medication for pain crisis and the
signs and symptoms varies from person to person, making it difficult to provide a common
treatment for SCD and understanding the disease. It is believed that 90,000 to 100,000
American are affected by SCD. Myriad number of studies have been working on gaining
better understanding of the disease and predict pain crisis and pain level. These studies
help people to mitigate or prevent pain crisis by taking precautions. However, no study
has used clinical notes to predict pain score and pain sentiment. Clinical notes provide
patient specific information including procedures and medication; and can therefore help
in predicting accurate scores.
Our study focuses on four research problems namely patient informative, pain
informa-tive, pain sentiment and pain scores using SCD data. Notes are taken for a patient during
hospitalization but only few provide beneficial information, therefore patient informative
and pain informative helps healthcare professionals to scan through the notes that can
pro-vide valuable information from all the clinical notes maintained. Pain sentiment and pain
experi-mented with two feature sets, firstly features obtained from cTAKES, a Natural Language
Processing (NLP) and secondly features obtained from text using NLP techniques. Four
supervised machine learning models namely Logistic Regression, Random Forest, Support
Vector Machines, and Multinomial Naive Bayes are built on these different sets of
fea-tures. From the results, it can be noted that cTAKES features are performing well for SCD
problem for all the four research problems with F1 score ranging from 0.40 to 0.86. This
indicates that there is promise for using NLP techniques in clinical notes as a means to
Contents
1 Introduction 1 2 Related Work 12 3 Methods 23 4 Evaluation 48 5 Conclusion 103 6 Biblography 104List of Figures
1.1 Sickled blood cells against normal blood cells [1] . . . 2
1.2 Blood clot due to sickling of red blood cells [9] . . . 4
1.3 Block diagram A demonstrating hierarchy of datasets . . . 9
1.4 Block Diagram B demonstrating the workflow of the system. . . 10
3.1 Progress notes of a patient describing the assessment, plan and intervention during the course of hospitalization. . . 24
3.2 Notes taken at the time of discharge is an example of patient informative notes . . . 25
3.3 Notes providing information of child life services and no specific informa-tion regarding patient hence non-informative . . . 26
3.4 Notes describing about the pain of the patient is considered as pain infor-mative notes . . . 27
3.5 Discharge notes with no mention of pain, hence considered as pain non-informative . . . 27
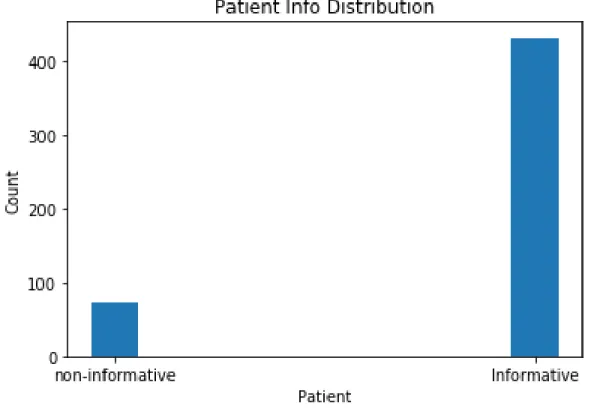
4.1 Data distribution of patient dataset with 504 data samples . . . 49
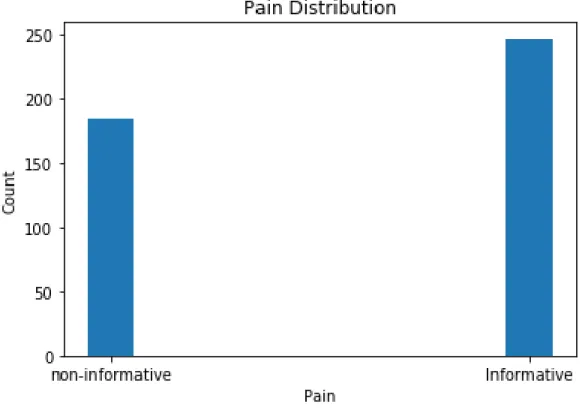
4.2 Data distribution of pain dataset with 432 data samples . . . 50
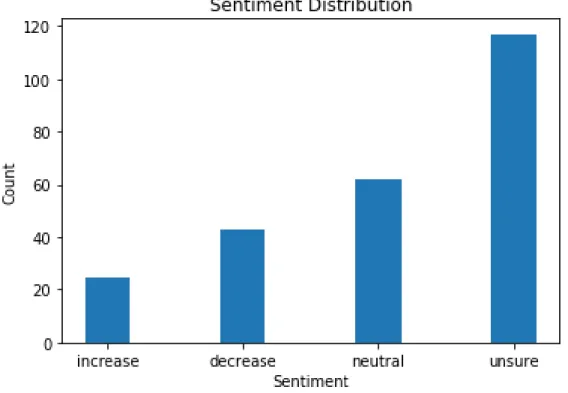
4.3 Data distribution of sentiment dataset with 247 data samples . . . 51
List of Tables
3.1 Unigrams and bigrams generated from text. . . 31
3.2 Count of unigram features generated from text . . . 31
3.3 POS tags generated for each term in the text . . . 33
3.4 Named entities generated from cTAKES are tagged to 5 categories . . . 34
3.5 Feature vector representation generated from the text tagged by cTAKES. . 35
3.6 Confusion matrix to evaluate the performance of a model . . . 45
4.1 Results without feature selection for different features and algorithms with F1 score.. . . 54
4.2 Confusion Matrix of RF with cTAKES features . . . 54
4.3 Precision and Recall of RF with cTAKES feature . . . 55
4.4 Feature selection results for different features selection algorithms with F1 score, precision, and recall . . . 55
4.5 Confusion Matrix of LR with unigram count as features for χ2 features selection . . . 56
4.6 Features selected in decreasing order of importance withχ2 feature selection 61 4.7 Themes categorized into informative and non-informative categories . . . . 65
4.8 Results without feature selection for different features and algorithms with F1 score.. . . 66
4.9 Confusion Matrix of RF with cTAKES features . . . 67
4.10 Precision and Recall of RF with cTAKES feature . . . 67
4.11 Feature selection results for different features selection algorithms with F1 score, precision, and recall . . . 68
4.12 Confusion matrix of LR with unigram tf-idf as features for χ2 feature se-lection . . . 68
4.13 Features selected in decreasing order of importance withχ2 feature selection 73 4.14 Themes categorized into informative and non-informative categories . . . . 77
4.15 Results without feature selection for different features and algorithms with F1 score.. . . 79
4.16 Confusion matrix of LR with cTAKES features . . . 80
4.17 Precision and Recall of MNB with bigram tf-idf as features . . . 80
4.18 Feature selection results for different features selection algorithms with F1 score, precision, and recall . . . 81
4.19 Confusion matrix of MNB with bigram tf-idf as features for χ2 feature selection . . . 81
4.20 Features selected in decreasing order of importance withχ2 feature selection 87
4.21 Themes categorization into increase, decrease, neutral and non-determined categories. . . 90
4.22 Results without feature selection for different features and algorithms with F1 score.. . . 92
4.23 Confusion matrix for SVM with cTAKES features . . . 93
4.24 Precision and Recall of RF with cTAKES feature . . . 93
4.25 Feature selection results for different features selection algorithms with F1 score, precision, and recall . . . 94
4.26 Confusion matrix for MNB with bigram-tfidf features andχ2feature selection 94
4.27 Features selected in decreasing order of importance withχ2 feature selection 98 4.28 Themes categorization into severe, moderate and not-determined categories 102
1
Introduction
1.1 Overview
Sickle Cell Disease (SCD) is a group of hereditary blood disorders in red blood cells. Cells
in tissue need oxygen, and the hemoglobin in red blood cells carries oxygen to different
parts of the body. Hemoglobin is disc shaped, and it is the shape of hemoglobin that
allows it to freely flow through the veins and deliver oxygen to organs; however in SCD
patients, the shape of the hemoglobin is distorted into a sickle shaped hence the name sickle
cell disease (demonstrated in Figure1.1[1]). This distorted shape makes the hemoglobin
inflexible and sticks to the vessel walls leading to blockage and eventually preventing the
tissues from receiving oxygen. Poor oxygen delivery to the tissues can cause a sudden
and severe pain crisis. Moreover, these attacks come without warning, and the patient
needs to go a to hospital for effective treatment. Lack of oxygen can also cause serious
problems, including Acute Chest Syndrome (ACS), stroke, infection, organ damage, and
Figure 1.1: Sickled blood cells against normal blood cells [1]
While normal blood cells have a lifespan of 90 to 120 days, sickle cells can live only up
to 10 to 20 days. Since the sickled hemoglobin cant change its shape and bursts eventually,
people from SCD have a shorter life span and die early due to shortage of red blood cells
[3].
SCD is inherited and not contagious and does not spread from person to person. SCD
cannot be acquired over the lifetime if it is not identified at birth [4].
1.2 Statistics
SCD affects millions of people throughout the world, and it is believed that 80% of the SCD
cases occur in Sub-Saharan African. It also occurs in people from Spanish speaking regions
such as South America, the Caribbean, Central America, India, the Arabian Peninsula and
It is believed that SCD affects 90,000 to 100,000 Americans approximately, mainly
African Americans and it occurs in 1 out of every 500 African American origin people, and
1 out of every 36,000 Hispanic-American births [5].
1.3 Causes
SCD is inherited, and people with SCD have a problem with genes involved in the
devel-opment of hemoglobin, a mutation that changes types of hemoglobin chains in red blood
cells. It is inherited when a child receives sickle cell genes from both the parents [6].
Sickling of the red blood cells can be triggered by a number of conditions such as low
levels of oxygen, acidity, dehydration of blood, stress, changes in temperature, or being at
high altitude [7]. Certain organs having high metabolic rate, such as brain muscles, extract
more oxygen leading to sickling of red blood cells [8]. Some organs are vulnerable to
lower levels of oxygen and acidity, such as when the blood moves slowly through the liver,
kidney or spleen. These conditions make the organ vulnerable to damage.
1.4 Signs and Symptoms
Some of the above mentioned causes results in sickling of the red blood cells and blocking
the blood flow to the tissues as demonstrated in figure 1.2 [9], causing it to suffer from
damage due to lack of oxygen. The damage causes disability in patients, leading to
excru-ciating pain episodes of variable severity and frequency, depending on the degree of organ
Figure 1.2: Blood clot due to sickling of red blood cells [9]
Major symptoms of sickle cell anemia include pain crisis, Acute Chest Syndrome,
heart failure, bacterial infection, fatigue, Anemia, breathing problems, gallbladder disease,
leg ulcers, headache, lung and heart injury, painful erections in men, eye damage, stroke
etc. Individuals may feel pain in any part of the body, but often in the legs, arms, chest,
belly, hand-foot syndrome, and lower back. They may also feel weakness, extreme
tired-ness, jaundice, and have trouble moving some parts of their body. Acute chest syndrome
accounts for the largest number of hospitalizations and death [10]. SCD affects the blood,
and its symptoms can occur anywhere. The signs and symptoms can vary from person to
1.5 Diagnosis
SCD can be diagnosed with a simple blood test [11]. Most often it is detected at birth
during the routine newborn screening tests, and it can also be diagnosed before birth.
1.6 Treatment
Changes in red blood cells can eventually lead to sickle cell crisis. Some of the medications
taken during the sickle cell crisis include pain medications such as narcotics, IV fluids,
blood transfusions for anemia, and curing infection.
People with SCD can often manage their pain at home by taking pain medicine and
drinking plenty of liquids. However, if the pain is severe then hospitalization is a better
option. There is no best treatment for SCD; treatment options vary from person to person
depending on the symptoms [12].
Bone marrow or stem cell transplant is the only cure for SCD, however it carries the
risk of death and other serious side effects, making it a less viable option as compared to
just managing the pain symptoms of SCD patients [12].
1.7 Progress Notes for SCD
So far we had a brief discussion of SCD, its causes, diagnosis, treatment and prevention.
Identification of SCD crisis before its occurrence is crucial as it can help the patient
miti-gate the painful episodes of the sickle cell crisis. Numerous studies are undergoing using
different techniques to prevent the sickle cell disease crisis [13] or predict pain level. One of
them uses vital signs and physical signs tracked by mobile technology to study and predict
the pain levels [13].
clin-ical records for research, taking initiatives, and making informed decisions. Integration of
clinical notes with electronic health records has led researchers to use this valuable
tex-tual information (such as medication, and procedures) to gain a better understanding of the
problem. SCD symptoms vary from person to person, and progress notes from each patient
can add medical and health status information specific to that patient to improve prediction
of the sentiment and pain scores.
Nursing Notes are medical notes made by the nurse over the course of
hospitaliza-tion of the patient. THEY record the assessments, current status, and care delivered to
the patient. The documentation provides patient assessments, plan of care, and real time
progress notes. Complete and accurate nursing notes are critical to make informed and
good decisions for patient care.
Progress notes are essential to patient care, and document patients status. Progress
notes represent a vast wealth of knowledge and insights. They are part of medical records
and keep track of nursing assessments, care provided, patient condition, patient progress,
current status, discharge summaries, and relevant information to deliver excellent care.
They provide accurate condition while the patient is under the care of healthcare team [14].
Progress notes are crucial as they record the events during patients care, allowing
clin-icians to compare the current and past status, communicate findings, plans and opinions
be-tween clinicians and other members of the healthcare team, and make informed decisions.
They are the repository of facts and clinical thinking, and are intended to communicate
patients health condition and progress to those who access the health record.
During hospitalization clinical notes and vital signs are registered. When a SCD
pa-tient is hospitalized, nursing notes are documented to monitor the ongoing progress of
the patient. They provide the patient’s assessment of their condition; plan of care notes
outlining the plan of care for the patient and goals and its outcomes; and progress notes
tracking the patient’s progress, medication, the level of pain on the pain scale, the patient’s
Nursing notes are documented several times during hospitalization, and the date and
the time are recorded during the patients assessment; hence, there are multiple notes
main-tained for each patient to track the progress over the course of hospitalization. However,
there are pitfalls in some nursing notes as some of them are copied, duplicated, sometimes
incomplete and non-informative, and dont provide meaningful information regarding the
patient as observed from the data. Hence, reusing and revisiting non-informative progress
notes for evaluation by healthcare professionals can be redundant and time consuming,
which brings up the need to identify informative and non-informative notes.
Clinical notes, a storehouse of potential breakthroughs, have been used in a number
of studies for analysis and prediction. For this study, progress notes from nursing notes are
used.
In this thesis, we are trying to solve 4 different problems. These are identifying:
1. Patient informative notes
2. Pain informative notes.
3. Pain sentiment
4. Pain score
We explain this in detail below:
1. Informative notes with respect to a patient are notes emphasizing the patient’s
med-ical history, current state, progress, medication information and discharge
informa-tion. Notes with the above information are useful for research and can lead to
mean-ingful results, for instance identifying popular medications for a patient and effective
treatment during analysis, and also save a tremendous amount of time by omitting
the non-informative notes.
2. Informative notes with respect to pain are notes demonstrating information regarding
have information regarding the patients family, progress, and playroom activities.
Not all notes are informative in terms of pain as they might emphasize other aspects.
SCD patients report pain level at different times during hospitalization, and these
notes document the patients pain, hence it is useful to identify notes demonstrating
pain versus notes emphasizing other aspects of hospitalization.
3. Pain Sentiment is broadly classified into 4 categories, namely increase, decrease,
neutral and unsure. From the notes and vital signs, a pain score for each progress
note is collected and classified into one of 4 classes based on the current and previous
score; an increase indicates a increase in pain level, decrease indicates a decrease in
pain, neutral is no change in pain and not-determined is unsure regarding pain.
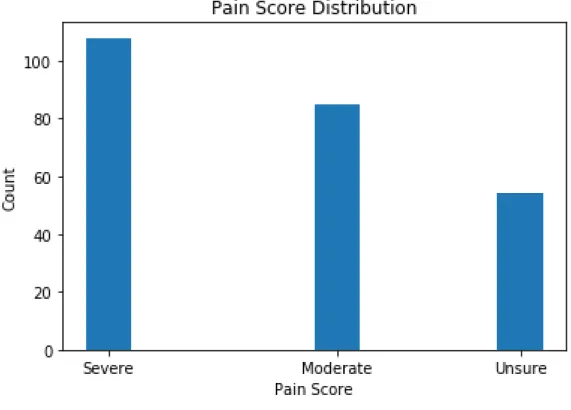
4. Pain Score is classified into 3 classes namely moderate, severe, and not-determined.
Pain scores are accrued from the vital signs and they are classified as moderate if it
falls in the range (0-6), severe (7-10) and not-determined if there was no pain score
in the notes.
Natural language processing, machine language techniques, and cTAKES are very
popular with unstructured data, and for our study we are using these techniques for the
prediction of patient informative, pain informative and pain sentiment and pain score.
This information is valuable as it saves a huge amount of time to track the patients
progress, as there are millions of patients and tracking each progress notes is tedious and
time consumptive.
1.8 Block Diagram
As discussed above, the four problems addressed in our study are identifying patient
demonstrates the hierarchy of the datasets and Figure B demonstrates the pipeline followed
in building the models.
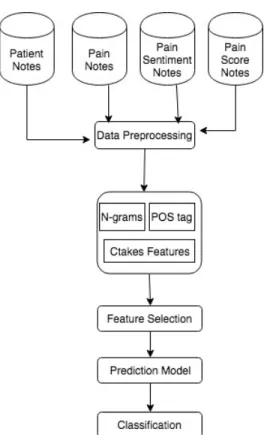
Figure 1.4: Block Diagram B demonstrating the workflow of the system.
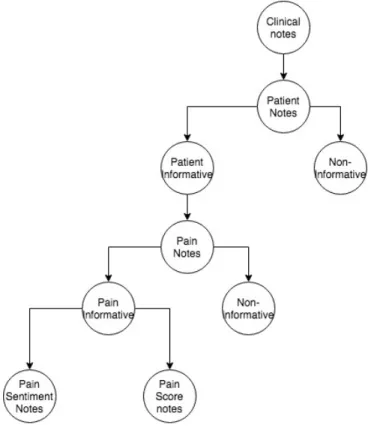
In figure1.3, the dataset follows a hierarchy of 5 levels. Clinical notes are on top of
the tree, patient informative and patient non-informative are at level 1, pain notes are at
level 2, pain informative and non-pain informative are at level 3, pain sentiment notes and
pain score notes are at level 4. The levels demonstrate how each child node is derived from
the parent note. Pain notes are derived from the patient informative notes alone, patient
non-informative notes are discarded in the pain notes dataset, similarly sentiment and pain
score notes are derived from pain informative notes, and non-pain informative notes are
discarded for building the pain sentiment and pain score notes datasets.
Figure1.4demonstrates the pipeline for building the machine learning models. All the
datasets in the study follow a similar pipeline. At stage 1, data is preprocessed; at stage 2
features are extracted, extracted features include n-grams, part of speech tags and cTAKES
features; at stage 3 features are selected using a feature selection algorithm; at stage 4,
is classifying the data to various class labels. The steps outlined in the pipeline are further
discussed in chapter 3 and 4.
1.9 Outline of Thesis
The rest of the thesis is organised as follows: chapter 2 outlines related work dealing with
work on clinical notes, NLP, and SCD. In chapter 3, data collection, annotation, methods
and various NLP and machine learning techniques used to compute the results and metrics
to quantify our results are demonstrated. In chapter 4, results and discussion are outlined
2
Related Work
This chapter discusses studies related to Natural Language Processing and text
classifica-tion. Section 2.1 explores studies using technology with wearable sensors for healthcare,
followed by section 2.2 discussing studies using clinical notes and Natural Language
Pro-cessing for healthcare, and section 2.3 explores studies using technology and Sickle Cell
Disease (SCD) specifically.
2.1 Technology and Wearable sensors
Data collected from wearable sensors are fed to machine learning models to make real
time predictions such as fall risk and human activity recognition. Healthcare is adopting
wearable devices and utilizing the real time information to build predictive models and
make real time predictions as discussed in the section below.
Giansanti et al. [15] developed a neural network classifier to predict fall risk using
mahalanobis distance and kinetic parameters assessed by wearable devices. Falls are risky
and possibly life threatening. Their model uses a new neural network (NN) to predict falls.
The NN uses kinetic parameters collected using accelerometers and rate gyroscopes during
a posturography protocol. Kinetic parameters were assessed by standing sway test in three
conditionS: eyes open (EO), eyes open on foam (EOF) (patients standing on foam instead
of floor), and eyes closed on foam (ECF), and values were noted for ten 60s trials and two
fall risk predicted by statistical classifier based on Mahalanobis distance are fed to the NN.
They trained the model on mahalanobis distance and on two groups of 30 elderly subjects
with different Tinetti fall-risk scores (determines elder’s risk of fall within the next year)
and the model was validated on two groups of 100 individuals with different Tinetti fall-risk
scores. The NN was the optimal model compared to Nave Bayes, multilayer perceptron,
Support Vector Machine, Bayes Net, and statistical classifiers implemented for the study.
The model had a 97% specificity [16] (measures proportion of negatives correctly
identi-fied) and 98% sensitivity [16] (measures the proportion of positives correctly identified)
and 0.965 AUC [17] (Area under the curve of Receiving Operating Characteristics (ROC)
is a measure to see if the model is useful, an AUC of 0.5 indicates it is no better than a
random model).
Lester et al. [18] proposed a hybrid model using Generative and Discriminative
mod-els [19] (A generative model is based on joint probability, P(x,y), with x as inputs and y as
output, and makes predictions based on Bayes theorem to calculate P(y—x) and selects the
most likely y. A Discriminative model learns to map the inputs x directly to output y)
ap-proach to identify 10 different human activities. They recorded 12 hours of data consisting
of different activities and used 80% of the data for training. Two approaches are
consid-ered for the study: for the first approach, features extracted from the data were inputted
into a static classifier for prediction, features selection was performed using boosting and
classified using ML techniques, A decision stump (a one level decision tree) came out to
be the optimal model compared to Nave Bayes (explained in Chapter 3) with precision and
recall (these metrics are explained in Chapter 3) of 98% and 84%. The second approach
uses the posterior probability of the classifier as inputs to a Hidden Markov Model [20]
(a model to recover the sequence of states to generate the emission from observed data)
and the precision and recall (explained in Chapter 3) was 99% and 91%, with an overall
accuracy of 95%. They found that the addition of the HMM to the model helped to smooth
Dawadi et al. [21] presented a model to assess cognitive health and activity quality
us-ing smart home technologies. Study develops an automatic framework to extract features
from smart home sensors data that reflect an individuals performance or ability to
com-plete the activity. The features are fed to the machine learning model to predict cognitive
health as cognitive healthy or dementia and predict the activity quality for complex set of
smart home activities. To validate the model the complex activities of 263 participants are
recorded, and these activities are performed in smart home testbed. Support Vector
Ma-chine (SVM are explained in Chapter 3) could predict cognitive health or dementia with
0.80 area under ROC, and significant correlation of 0.54 was obtained between observation
scores and predicted activity quality.
Alshurafa et al. [22] developed a model using time-frequency decomposition in a
wearable necklace using a Piezoelectric sensor to recognize Nutrition Intake. The sensor
can detect skin motion and produce output voltages with varying frequencies over time.
They developed an algorithm based on time-frequency distribution, and spectrogram
anal-ysis to distinguish between food types such as solid, liquid, hot, cold drink, hard and soft
foods. The model works by detecting swallow movements and create spectrogram, a
3-dimensional energy plot, further statistical features are generated from the spectrogram
and given to classifier for recognition. The model implemented 10 fold cross validation
and was tested on data collected from 10 subjects. Random Forest (explained in Chapter 3)
was the best performing model predicting liquid or solid class with an F1 score (explained
in Chapter 3) of 91.2%, it was also the best performing model for the rest of the classes.
Suutala et al. [23] proposed a model to automatically classify human activity
recog-nition including standing, sitting, running etc from on-body accelerometers. The dataset
consisted of signals assessed by wearable device from 13 different subjects performing 17
daily activities and some of the general activities were combined to form 9 daily activities.
Time domain features were assessed from the device and a sequential learning model was
individual input output mappings and Hidden Markov Model [9], a generative approach to
smooth temporal time dependent activity sequences. The accuracy for the model was 94%
in identifying 17 daily activities and 96% in identifying 9 daily activities.
Morris et. al. [24] developed a system called RecoFit to automatically track repetitive
exercises including weight training and calisthenics using wearable sensors. The model
has three stages, segmentation to identify exercise periods from non-exercise periods, it
is a binary state machine; followed by recognition of the exercise, the model was trained
to recognize 26 exercises circuit labeled in the training data; followed by counting the
number of repetitions. It is validated by collecting data from 114 participants over 146
sessions using cross validation. The results for the 4, 7, 13 exercises circuit has recognition
of 99%, 98% and 96%, counting was 1 repetition 93% of the time.
Shoaib et al. [25] built a model to recognize complex human activities using
smart-phone and wrist-worn motion sensors and study the effect of window size on complex
activities. For the study, data was recorded from three motion sensors namely
accelerome-ter, gyroscope, and linear acceleration sensor and have studied 7 window sizes (2-30) on 13
different activities. Their study discusses that less repetitive activities including smoking,
eating etc. are difficult to detect at smaller segmentation windows and increasing window
sizes helps in identification of complex activities. So far we have discussed some of the
papers using technology in healthcare sector, and these studies reflect the fact that different
algorithms were the best performing models for different problems, and also demonstrates
adoption of technology by healthcare to discover and validate new findings such as fall
risk, predicting human activities. This proves using technology in healthcare can help in
2.2 Clinical notes and NLP
As part of new standards clinical notes are added to the EHR data, making it available to
people and open for research. It is a repository of potential information, and understand the
problem domain better by analysing the data. Myriad number of studies and researchers
are using clinical notes and NLP in predictive modeling. The rest of this section analyses
some of the past works using NLP and Clinical Notes.
A study by Joshi et al. [26] focused on prediction of acronym expansion in
clini-cal notes. Acronym disambiguation is a well-known concern when uncovering
informa-tion from EHR data. For the study they have created 7,738 disambiguated instances of
16 ambiguous acronyms. They used different features including unigram, bigrams, POS
tags (explained in Chapter 3) and their combination, and implemented Nave Bayes, SVM
and decision tree as the machine learning algorithms for prediction. Their baseline model
reported accuracy below 50% but with unigrams as features, SVM outperformed others
obtaining an accuracy of 90% when the disambiguation acronyms in the dataset were less
than 50%, which is very difficult as the majority sense is very low. As the distribution
of the disambiguation acronym increased from 50- 80%, all the features were performing
well, with an accuracy of above 80%; as the distribution of acronym was greater than 80%,
the differences in the accuracy of the features decreased to further extend and the accuracy
for all the features was above 90%; and in all the cases SVM performed the best among all
the machine learning algorithms. Their study also indicate that unigrams are better features
compared to other features used in the study.
A study by McCart et al. [27] used clinical notes to predict falls from ambulatory
care clinical documents, and statistical text modeling to serve their needs. Their aim was
to predict the categories fall and not fall. They had 4 datasets from different sites, site A,
B, C, D, and took 70% of the data from site A to train the model and use the rest and other
sites to test the data. They employed feature selection techniques such as, gain ratio (ratio of
and used Logistic Regression, SVM and SVM-cost models to build the classifier. Different
feature selection techniques were used on different models, for instance,χ2 was used for
both SVM and SVM-cost, and gain ratio was used for logistic regression. SVM-cost model
obtained the highest AUC scores, ranging from 0.953 to 0.978, and F1 scores ranged from
0.745 0.853, however the AUC and F1 scores for all the models were relatively the same
with a difference in AUC being 0.02 and a difference in F1 score ranging from 0.02-0.05,
on any test sets. The study demonstrated that statistical text mining could reliably identify
falls in clinical documents.
A study by McCormick et al. [29] used NLP on clinical data to classify patient
smok-ing status. It is a multiclass classification, classifysmok-ing each patient into 3 categories namely
smoker, non-smoker or unknown. For the study they have generated two feature sets using
two different techniques, the first approach uses lexical features captured from the data i.e.
bag of words, and other was semantic features generated by MedLee, a clinical NLP
en-gine. Boostexter and rule based algorithms Xquery classifier were used for the study with
the above-mentioned feature sets. The best performing model used semantic features and
BoosTexter algorithm with a macro average F1 score of 0.75. The study demonstrated that
semantic features are helpful in identifying smoking status, and therefore we tried using
semantic features in our study using CTakes, a NLP system to extract information from
clinical notes.
A study by Meystre et al. [30] used NLP to extract medical problems from electronic
clinical notes, their aim was to provide help in maintaining the problem list updated,
accu-rate and complete. For the study, they tried to identify 80 medical problems from clinical
notes. UMLS MetaMAo Transfer (MMTx) application was used to detect the problem
from notes and a negation detection algorithm to identify negation in the sentence and
re-move the negated medical problem from the notes, and generate a list of medical problems
from clinical notes. By creating a custom subset of MMTx, containing the 80 concepts and
a recall of 0.896 and precision of 0.691 and F1 score of 0.780. Their study compared the
problem detection for 20, 40 and 80 problems and reveal that as the number of problems to
detect increased recall decreased.
Khalifa et. al [31] studied on adapting existing NLP resources for cardiovascular
risk factor identification in clinical notes. Eight categories of information are associated
with risk of heart disease including smoking status, diabetes, hypertension etc. The model
used Ctakes (discussed in Chapter 3) to identify the smoking status and rule based and
pattern matching modules to detect medication and laboratory results and Textractor to
detect disease and risk factor terms. The model was trained on 790 documents and tested
on 514 clinical notes. The overall micro-average f1 score of the system is 87.47%.
F1-score (discussed in Chapter 3) for identification of smoking status using Ctakes was 87%,
demonstrating the usefulness of Ctakes in healthcare studies.
A study by Melton et al. [32], an automated detection of adverse events used NLP on
discharge summaries to detect 40 adverse events. They used MedLEE, natural language
processor to convert discharge summaries to coded form (entity identification of phrases to
problem, certainity and status. For instance the sentence the patient may have a history of
mi is coded as problem: myocardial infarction, certainty: moderate, status: past history),
and input the code to a program, mapping it to a list of events that have appeared to occur
during admission. Of the 57,452 discharge summaries, the system identified 1590 adverse
events in 1461 cases with a sensitivity [5] (measures the proportion of positives correctly
identified ) of 0.28, and specificity [5] (measures proportion of negatives correctly
identi-fied) of 0.985.
NLP is applied in numerous studies using text data, and the most common machine
learning algorithms associated with the studies were Logistic Regression, SVM and
de-cision trees. Unigrams was identified as the best performing features among POS tags,
bigrams and their combination, however there are few studies trying to incorporate features
to analyze different features from NLP system and their combination in building predictive
models.
2.3 Machine learning and SCD
With the adoption of Machine learning and Natural Language Processing in healthcare
sector, multitude of papers are published each day with new discoveries and findings. As
discussed in previous section many healthcare areas including SCD in addition to cancer,
Down’s Syndrome, etc. has adopted machine learning. Predictive analysis is used in SCD
to uncover new ways to decrease the mortality rate, predict and alleviate pain crisis before
its occurrence.
A study by Desai et al. [33] on discovering a novel gene signature for elevated
Tricus-pid Regurgitation Velocity (TRV) in SCD may help in decreasing mortality rate in SCD.
An elevated TRV on transthoracic echocardiography and right heart catheterization
(RHC)-defined pulmonary hypertension are independently responsible for increasing mortality in
SCD. The study implemented SVM to identify a 10-gene signature to discriminate patients
with and without increased TRV and validated it against the validation cohort of patients
with RHC-defined PH using SVM, and it was able to identify PH in SCD with an
over-all accuracy of 90%. The study validated genomic signature as a potential biomarker in
SCD-associated elevated TRV.
Xu et al. [34] developed a deep convolutional neural network for classification of red
blood cells in SCD. The study can help in potentially assessing the severity of SCD based
on the shape of the RBC. The red blood cells in SCD are found in multiple shapes
includ-ing the sickle shape, and they developed a classifier to predict the heterogeneous shapes
in SCD. They build their model employing a hierarchical RBC patch extraction method
followed by a shape-invariant RBC patch normalization technique (to exclude background
mi-croscopy images of 8 different SCD patients and implemented 5 fold cross validation for
the results. The model performed well in identification of the 5 classes of red blood cells
namely Granular and Echinocytes, Discocytes + Oval and Elongated + Sickle and
Retic-ulocytes, and the mean accuracy was 89.28%. The study also evaluated the dataset for
8 different red blood cells resulting in the mean accuracy of 87.5%. They have also
ex-periment on classification of deoxygenated RBCs and the model obtained a high recall of
93.8% and a low precision of 60%.
Allayous et al. [35] used machine-learning algorithms for prediction of Acute Splenic
Sequestration Crisis (ASSC), a serious symptom of SCD. For the study they have used data
from 42 children described by 15 characteristics, and employed feature selection to select
4 attributes namely HT (basic ht), NEU (neutrophyle number), DELTAPLT (variation of
plates of blood), and HYGRO (hygrometry). They observed that ASSC is characterized by
decrease in hemoglobin level, therefore excluded HB (rate of basic hemoglobin) from the
feature set as they defined ASSC with HG (hemoglobin level). Their aim was to predict the
severity of SCD as mild or severe, and employed four different machine learning algorithms
namely Adaboost, Bagging, Boosting tree ranking, and Logistic Regression. All the models
performed well with an overall AUC curve of above 0.80%, and Adaboost performed well
with AUC of 0.92%.
Yang et al. [36] employed machine learning techniques to predict pain scores using
physiological measures in an effort to reduce rehospitalization and predicting pain to take
appropriate measures and prevent pain crisis. The dataset contains data from 40 patients
with 6 vital signs as features, and predicted pain on 11, 6, 4 and 2-point pain scale. Multiple
imputation by Fully Conditional Specification (FCS) was employed to solve the problem of
missing values. They made analysis on intra and inter-individual level; the intra-individual
level considers the samples from individual patients and trained multiple models for each
patient, where as for the inter-individual model the differences between individual patients
6 vital sign features for this analysis. They have employed different machine learning
models including Multinomial Logistic Regression (MLR), K-Nearest Neighbors (KNN),
Support Vector Machine (SVM), and Random Forest (RF). Feature selection usingχ2was
employed and they found that all the 6 vital signs are significant and none of them are
cor-related. The results demonstrate that MLR performed well from the rest for intra-level for
a 11 point scale with an average accuracy of 0.58, and F1 score of 0.50, and analyzed that
due to class imbalance the weighted F1 was lower than accuracy. For the Inter-individual
level, the best performing algorithm for 4-point scale was MLR with an accuracy of 0.681
and weighted F1 of 0.673 for dataset with patient labels, explaining the fact that accuracy
increases with reduction of classes.
Milton et al. [37] presented work on prediction of Fetal hemoglobin (hbF) in Sickle
Cell Anemia using an ensemble of 14 models. HbF levels are heritable and interpersonal
variability is regulated in part by three quantitative trait loci (QTL). Studies identified that
single nucleotide polymorphisms (SNPs) are found in QTLs and explain only 10-20% HbF
variability. Combining Genetic Risk Score (GRS) and SNP can explain large amount of
variance in HbF, however it is challenging to select optimal number of SNPs to combine
with GRS. The dataset for the study consists of 841 sickle cell anemia patients and the
results were tested in three independent cohorts. For the study they developed an ensemble
of 14 models using GRS composed of variable number of SNPs, and the ensemble model
explained 23.4% of variability in HbF. The ensemble model can predict HbF Levels with
an accuracy ranging between 0.28 - 0.44.
The above papers emphasize on the importance of associating SCD with Machine
learning. It helped in analysing SCD and identify ways to better understand the domain,
which wouldn’t have been possible without technology. Different areas of research are
studied in SCD, however there are no studies on using text data in analysing pain in SCD
patients. Progress notes are valuable source of information they provide resourceful data in
help in building robust models, whereas other data forms such as vital signs lack more
detailed patient information. Specifically, in the context of SCD, medications, procedures
undertaken in the hospital play an important role to reduce pain level in patients, and text
data can capture these minute details. For our study, we are using NLP techniques to
3
Methods
In this section, methods used for analyzing progress notes of SCD patients are detailed. To
deal with textual data a framework is followed, it is more a linear and iterative process. The
framework is a pipeline, and it is outlined as follows: (i) data collection and description,
(ii) data annotation, data preprocessing, (iii) feature extraction, (iv) feature selection, (v)
data modeling, and (vi) data evaluation. All the steps in the framework are discussed in
detail in this section.
3.1 Data description
Our study used data collected from 112 in-patient participants with clinical notes recorded
during their hospitalization by Duke University Hospital from June 2015 17. As discussed
earlier clinical notes have many subsets including nursing notes, pan of care notes and
progress notes; and for our study progress notes are utilized. Dataset was anonymized by
replacing names of each patient with unique labels. Patients self-reported pain score was
recorded along with the vitals signs in Electronic Health Records (EHR). Pain score is the
pain experienced by the patient when vitals were recorded, and it ranges from 0 10, where
0 indicates no pain and 10 indicates severe pain. Data in progress notes is unstructured text
data in Word format. Multiple progress notes are noted for a patient during the course of
hospitalization, and by considering each progress notes for a patient as a single data point,
sample of progress notes from the dataset.
Figure 3.1: Progress notes of a patient describing the assessment, plan and intervention during the course of hospitalization
3.2 Annotation
For our study, five scenarios namely patient informative, pain informative, pain sentiment
and pain score prediction are evaluated. For each scenario different rules are followed to
label the dataset. In this section, annotation process and rules followed to label the dataset
in the five scenarios are addressed. The dataset is self annotated, after taking inputs from
clinical collaborator from Duke University.
3.2.1
Patient informative
Nurses record clinical notes during course of hospitalization for a patient, and it contains
com-bination of informative and non-informative regarding patient, therefore identifying the
informative notes is the goal in this scenario. A note is considered as informative if it
satis-fies any of the criterions below, and the criterions are decided based on the inputs from our
clinical collaborator. Informative regarding Patient
1. Current health status
2. Current pain status
3. Health concerns
4. Medical background
5. Activities during hospitalization
6. Current therapy
7. Medical advice
8. Patients background
9. Admission information
10. Discharge information
Figure3.2 and 3.3 below demonstrates example of informative and non-informative
notes based on the criteria discussed above.
Notes in figure3.2is considered as informative as it shares information regarding the
patients discharge. Progress notes sharing information regarding other details or irrelevant
information regarding patient are considered as non-informative. Figure3.3demonstrates
an example of non-informative notes. Notes in the figure states patient is asleep and shares
irrelevant information hence annotated as non-informative.
Figure 3.3: Notes providing information of child life services and no specific information regarding patient hence non-informative
3.2.2
Pain Informative
A patient hospitalized for Sickle Cell crisis suffers excruciating pain and health
profession-als try to alleviate pain during the course of hospitalization. Clinical notes record details
regarding patients current status, reaction to medications, recovery, and pain status.
Nu-merous details regarding patient is recorded in clinical notes, and hence some notes provide
information regarding other aspects of hospitalization. Some criterions are used to label the
data point as informative or non-informative. A note is pain informative if it satisfies any
of the criterion below: Informative regarding patients
2. Pain medications
3. Current health status
For this case, it is intuitive to consider only informative notes with respect to patient,
because non-informative note with respect to patient indicates its non-informative with
respect to pain. Therefore the dataset in this case is a subset of patient dataset.
Figure3.4 and 3.5 below demonstrate examples of informative and non-informative
notes. The notes is considered informative because it has pain mention, and it explains
patients pain is 2/10 and following criteria 1. Whereas the other notes is non-informative
because it shares no information regarding pain in patient, its a discharge note with no pain
specific information.
Figure 3.4: Notes describing about the pain of the patient is considered as pain informative notes
Figure 3.5: Discharge notes with no mention of pain, hence considered as pain non-informative
3.2.3
Pain Sentiment
Pain sentiment is predicting the sentiment of patients pain at a given point of time. It can
be increasing, decreasing, neutral or not-determined. Pain sentiment is labeled as increase,
neutral or decrease by the increase, decrease or no change in pain scores in two consecutive
notes for a patient. Pain scores are recorded along with vital signs. Progress notes and vital
signs are time stamped when they are recorded, however the notes and vital signs were
never noted together as they were no identical timestamps identified in the two datasets
(notes and vital signs), hence it was difficult to record pain score for progress notes. To
address this issue, a two-hour window for the date and time in the progress notes and vital
signs is considered to identify pain score for a progress note. Some of the pain scores
were missing in vitals; therefore these missing scores were labeled as not-determined. It
is difficult to identify if the pain is increasing or decreasing for the first progress notes
recorded for individual patient, and therefore those progress notes were also labeled as
not-determined. The labelling was done in collaboration with a clinician.
For this case, pain informative data points are considered for labeling of sentiment.
It is intuitive to consider only Positive class because non-pain informative data points will
not provide information regarding sentiment, as they were unable to identify pain.
3.2.4
Pain score
Pain scores are accrued from the vital signs (self-reported pain scores) and identified for
each progress notes, they are categorized on a 0 10 pain scale, where 0 indicate no pain,
and pain level increases with the increase in pain scores and 10 indicate severe pain. Pain
score is classified into three categories namely:
1. Moderate (0-6 on a pain scale)
3. Not-determined
3.3
Preprocessing
Data collected is often inconsistent, incomplete and inaccurate. Preprocessing is essential
to eliminate noise, extract meaningful information, knowledge from raw data and prepare
for further processing. Data preprocessing techniques utilized in this study are stemming,
stop word removal, removing numbers, lower casing etc.
3.3.1
Stemming
Stemming [38] is a process of reducing inflected words to its base or root form. Its a process
that maps related words to the same stem. For instance, the words likes, likely, liked and
liking from the dataset are mapped to the root word like. Stemming addresses the issue of
adding new terms to the word lists when two words share same information.
3.3.2
Stop word and number removal
Stop words [39] are irrelevant words to the problem being solved, for a given purpose any
set of words can be considered as stop words. For our study filler words in the sentences
such as a, an, the, which, on, etc. are considered as stop words and eliminated from the
text, as they dont provide meaningful information. Numbers are further removed.
An example notes, following the stages of preprocessing is explained as follows.
Be-low is the sample notes.
Pt discharged home with mom. Pt afebrile, VSS, pain controlled with PRN PO oxy-codone/scheduled pain meds. Pt given oxycodone prior to d/c for pain 2/10 in chest. Mom and pt educated on d/c instructions. Parking pass given via nurse as couldn’t get in touch with social work. PIV removed. Care plan/education resolved. Mom and pt discharged
without any further questions/concerns.
Text follows preprocessing steps such as stemming, stop word and number removal,
the final text after preprocessing is below. Patient discharged home mom patient afebrile
vss pain controlled prn po oxycodone scheduled pain meds patient given oxycodone prior discharge pain chest mom patient educated discharge instructions parking pass given via nurse couldnt get touch social work piv removed care plan education resolved mom patient discharged without questions concerns
3.4 Feature Extraction
For our study we are using text data derived from progress notes and our goal is to build
a predictive model to make predictions using four different models. For a model to
per-form well it must be fed with resourceful and meaningful inper-formation extracted from data.
Feature extraction or feature engineering is a step towards building an accurate predictive
model by extracting knowledge from raw data. In feature extraction, features are extracted
from text data. There are various ways to extract features, however a simple approach is to
use bag of words. Bag of words technique represents each data point as a vector of all the
words in the dataset. Furthermore, for our study we have extracted features using Apache
cTAKES [40], a natural language processing system to extract knowledge from clinical
notes. Following are the features utilized for our study:
3.4.1
N-grams
N-grams [41] are the continuous sequence of n-words in a sentence, considering it as a
sin-gle unit. An n-gram of size 1 is referred to as unigram, size 2 as bigram, size 3 as trigrams.
The unigram and bigram generation for the sentencepatient is feeling well today, patient is
from bag of words and given to predictive models. Bag of words for the example after
preprocessing is patient, feeling, well, today, patient, discharged, today Different
weigh-ing factors can be used to convert text to feature vectors: Followweigh-ing are the two weightweigh-ing
factors adopted in out study:
Table 3.1: Unigrams and bigrams generated from text
Features Unigrams
Unigrams patient, feeling, well, today, patient, discharged, today Bigrams Patient feeling, feeling well, well today, today patient,
pa-tient discharged, discharged today
3.4.2
Count
In this technique, the frequency of the occurrence of the n-grams for each data point is
cal-culated and assigned to the extracted n-gram in the feature vector. For instance, a unigram
feature vector for the sentencepatient is feeling well today, patient is being discharged
to-dayis calculated by first converting the sentence into bag of words and then counting the
number of times each word occurs in the sentence, in the example sentence the term patient
occurs twice in the sentence hence the count for the term patient is 2. The bag of words
constructed for the sentence above looks like: Patient, feeling, today, discharged
Table 3.2: Count of unigram features generated from text
Features Count Patient 2 Feeling 1 Today 2 Discharged 1 Today 2
3.4.3
TF-IDF
In this technique each extracted n-gram is assigned a term frequency/ inverse document
frequency. TF-IDF is a statistic to evaluate how important a term is to a document in the
entire corpus. The importance of the term increases proportionally with the occurrence of
term in the document but is offset by the number of documents in the corpus that contains
the word.
3.4.3.1 Term frequency
TF [42] is the occurrence frequency of each n-gram in a given document. Since documents
vary in length, it is possible to have a term occurring many more times in longer documents
than in shorter ones. Therefore term frequency is normalized by the length of the document.
T F = Number of times term appears in a document total number of terms in the document
3.4.3.2 Inverse Document Frequency
Inverse document frequency [42] measures how rare a term is across documents in the
dataset. It is a measure to scale up the rare ones and weigh down the common occurring
words. The rarer the term is across the documents, more is the IDF score.
IDF = log of corpus size
occurrence frequency of the n-gram in the whole corpus
T F IDF =T F ∗IDF
For our study we are limiting the n-gram size to 2, as the size of the n-grams increases
the frequency of the terms in the text decreases and data preprocessing steps and elimination
using n-grams on text classification, using longer sequences (more than 2 and 3) reduces
classifiers performance [43].
3.4.4
Part of Speech (POS) tag features
Part of Speech tagging (POS tag) is often called by many names including grammatical
tagging and word category disambiguation. It is a process of marking the terms in the
sen-tence to a particular part of speech. There are eight main parts of speech [44] in English
namely nouns, verbs, adjectives, pronouns, interjection, preposition, adverb and
conjunc-tion. However most POS are divided into subclasses and for our study we are using 33
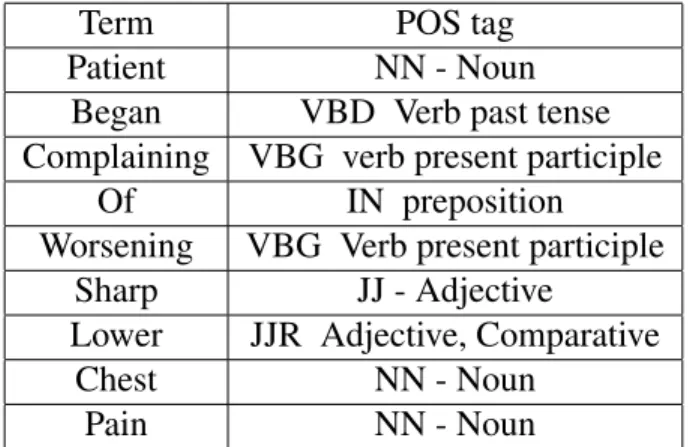
POS tags. For instance the POS tag [44] for the sentence patient began complaining of
worsening sharp lower chest pain.is detailed in the table3.3.
Table 3.3: POS tags generated for each term in the text
Term POS tag
Patient NN - Noun Began VBD Verb past tense Complaining VBG verb present participle
Of IN preposition Worsening VBG Verb present participle
Sharp JJ - Adjective
Lower JJR Adjective, Comparative
Chest NN - Noun
Pain NN - Noun
3.4.5
cTAKES Features
cTAKES (Clinical Text Analysis and Knowledge Extraction System) [40] is a Natural
Lan-guage Processing tool to extract information from EHR text notes. UIMA (Unstructured
Information Management Architecture) framework [45] and OpenNLP [46] toolkit was
dis-eases and disorder, signs and symptoms, anatomical sites, procedures, and medications. For
our study we are using all the five named entities as features to build predictive models. All
five attributes are self-explanatory, procedure represents procedures taken, signs/symptoms
are signs and symptoms identified for the patient during routine checkup, disease/disorder
is the disease patient is suffering, and medication extracts information regarding the drugs
prescribed for the patient. Clinical notes is the input to cTAKES system and the outputs
are the five attributes. For a given clinical note, cTAKES tags each term in the notes with
a named entity mentioned above, and outputs an XML file with all the terms in the clinical
notes tagged to one of the five entities discussed. The final dataset is obtained by passing
these XML files to a script to count the number of occurrences of each entity and create a
vector of counts for each clinical notes. Table3.4 demonstrates tagging of named entities
by cTAKES for a sample text.
Patient is a 15 year old with Asthma and Sickle Cell Disease type SC who presented to Duke Children’s Hospital with pain admitted with pain crisis. Hgb is 10.6 g/dL. C/O pain in right lower back and right thigh. Patient is afebrile. Blood culture is pending. Patient is receiving IV Dilaudid PCA/continuous and scheduled IV Toradol for pain management. Heat packs and Lidoderm patch to right thigh. Anticipate discharge home when afebrile, cultures negative at 48 hours and pain managed with po pain medications with MS Contin and Oxycodone.
Table 3.4: Named entities generated from cTAKES are tagged to 5 categories
cTAKES Named Entities Terms
Procedure Blood culture, PCA, pain management Anatomical site Lower back, right thigh, thigh, Sickle cell, cell Sign / Symptoms pain in right lower back, afebrile, po, patch, management Disease / Disorders Asthma, Sickle Cell Disease
Medication Packs, Oxycodone
ta-ble3.5below is the feature vector for progress notes for a patient.
Table 3.5: Feature vector representation generated from the text tagged by cTAKES
cTAKES Named Entities Terms
Procedure 3 Anatomical site 5 Sign / Symptoms 6 Disease / Disorders 2 Medication 2
3.5 Feature Selection
After extracting features from the data, the next step is feature selection. Feature selection
is the process of selecting subset of features from the vast set of feature set for model
con-struction. Feature selection is an essential step towards building a model for several reasons
firstly, features can be redundant and secondly, some features are irrelevant to the problem
being solved, therefore discarding these features would reduce complexity without loss of
information. Selecting informative features will increase the performance of the model, as
irrelevant features may affect the working of the model and decrease the overall accuracy.
Therefore, feature selection is crucial as it avoids the curse of dimensionality problem,
simplifies the classification model by eliminating redundant and irrelevant features, avoids
overfitting, helps in generalization, shortens training time as less number of features would
require less computation. The goal of feature selection is to identify minimum number of
features to build a high performing model without much loss of information. In our study,
3.5.1
Filter methods
Filter methods are feature selection techniques independent of the machine learning
algo-rithms utilized during the clinical decision-making. The method chooses subset of features
on the basics of scores in statistical measures between the independent variable and target
variable, and selects the ones with highest scores. The computational time of these
meth-ods is faster than other feature selection techniques, and can still capture the meaningful
information from the feature set [47]. It selects the relevant features using a univariate
statistic. This measure is helpful in exploring the relationship between the features and
doesnt include the assumption of the classifiers. A filter method using variance as
thresh-old, works by computing variances of all the features and selecting the feature set based on
a user defined threshold, or select the top k features with largest variance from the ranked
features. A study by Yang et. al. [48] assessed various feature selection techniques such
as document frequency, information gain [49] , Chi-square [50], mutual information [51]
for text classification and found that Chi-square and information gain is the most effective
feature selection technique reducing 98% of unique terms from the dictionary, with loss in
performance of the classification using KNN (K-nearest neighbours) and LLSF (linear least
square fit mapping) and therefore for our study the two feature selection methods employed
are Chi-squared and mutual information.
3.5.1.1 Chi-square
Chi-square test [50] is a statistical test to determine the dependency between the feature
variable and the target variable. It is a test of independence, and is calculated between each
of the feature variables in the dataset and the target variable and observes the existence of
a relationship between them. If the feature variable is independent of the target variable,
it indicates that the feature is irrelevant to the problem being solved and hence can be
dis-carded from the subset. If they are dependent, the feature variable is important in building
hy-pothesis that the observed frequency of the variable is equal to the expected frequency of
the target variable. It assumes that variables are random and drawn from a sample of
in-dependent variables. The test result is a test statistic having a chi-square distribution and
can be interpreted to either reject or accept the null hypothesis (expected and observed
fre-quencies are same). If the observed frequency of a feature and the expected frequency of
the target variable are same indicate that the two variables are independent of each other.
χ2 = 1 d n X k=1 (Ok−Ek)2 Ek
Oi =Number of observations in Class i
Ei =Number of Expected observations in Class i
3.5.1.2 Mutual Information
Mutual information [51] between two variables is a measure of dependence between the
feature variable and the target variable. It determines the amount of information obtained
from the feature variable about the target variable. Mutual information is a non-negative
value. If the mutual information between the two random variables is zero, indicates they
are independent of each other. The higher the mutual information, the higher is the
depen-dence between the two random variables and large reduction of uncertainty. The lower is
the mutual information then lower is the dependence and small reduction of uncertainty.
Entropy is closely related to mutual information, and quantifies the amount of information
in the random variable. Mutual Information is a useful measure because it maximizes the
information between the target variables and the joint distribution in a dataset with many
features. It is symmetrical and averaged. Mutual Information quantifies how much
random variables are independent then knowing X does not provide any information about
Y, therefore the mutual information between them is 0. If X is a deterministic function of
Y and vice versa then the information in X is also in Y, and knowing X will determine Y.
Therefore the mutual information is the information stored in X, which is entropy of X or
Y.
Mutual Information for two discrete random variables X and Y is defined as:
I(x, y) =X x,y
P(x, y) ln P(x, y)
P(x)P(y)
P(x,y) is the joint probability function of X and Y
P(x) and P(y) are the marginal probabilty functions of X and Y
Features having the highest mutual information are selected for building the prediction
model.
3.6 Prediction Models
For our study we implement machine-learning models to predict our outcomes. Machine
learning uses statistical techniques to allow a system to learn from the data without being
explicitly programmed. Supervised machine learning, a branch of machine learning is
employed in our study. Machine learning is about predicting the outcome based on the
inputs, supervised machine learning is a process of learning when the data provided for
learning consists of input and output pairs, it is supervised because the target or response
variable is given to the machine during the learning phase. In supervised machine learning
a labeled training dataset is fed to the learning model for training. A
map new data. In our scenario we our using supervised machine learning models to predict
for 4 scenarios including patient informative, pain informative, pain sentiment and pain
score.
Our problem is a classification problem, therefore we adopted four widely used
clas-sification models in text clasclas-sification namely Logistic Regression [52], [53], Multinomial
Naive Bayes [54], Support Vector machine [55], and Random Forest [56], [57] to predict
out outcomes. The former two are simple algorithms while the later two are complex and
Support Vector Machine is known to perform well in text classification. Below is the brief
discussion about the models used in the study.
3.6.1
Logistic Regression
Logistic Regression [52], [53] is a simple machine learning model implemented for binary
classification. It predicts the probability of an outcome. Logistic function is also called the
sigmoid function, it is an S-shaped curve that takes a real value number as input and maps
it into a value falling in the range 0 to 1, but never at 0 or 1. Binary logistic regression
predicts the odds of being a case for an input based on the independent variables. The odds
is defined as the probability of an outcome to be a case A divided by the probability that it
not a Case A.
p= 1
1 +exp(−(a+bx)) p is the probability
a and b are the parameters of the model
Logistic regression is a linear model, but the outputs are transformed using the logistic
function. The function estimates the probabilities between 0 and 1 based on one or more
features in the data, and uses a threshold to transform the output to either 1 or 0. The
![Figure 1.1: Sickled blood cells against normal blood cells [1]](https://thumb-us.123doks.com/thumbv2/123dok_us/9905640.2483845/11.918.356.617.116.541/figure-sickled-blood-cells-against-normal-blood-cells.webp)
![Figure 1.2: Blood clot due to sickling of red blood cells [9]](https://thumb-us.123doks.com/thumbv2/123dok_us/9905640.2483845/13.918.299.674.118.542/figure-blood-clot-sickling-red-blood-cells.webp)