Review of Business Management., São Paulo, Vol. 18, No. 60, p. 305-318, Apr./Jun. 2016
305
RBGN
REVIEw Of BuSINESS MANAGEMENT e-ISSN 1983-0807REVISTA BRASILEIRA DE GESTÃO DE NEGÓCIOS ISSN 1806-4892
Impairment losses: causes and
impacts
Joaquim Sant’Ana Fernandes¹
Cristina Gonçalves¹ Cristina
Guerreiro¹
Luis Nobre Pereira¹
¹University of Algarve & Centre for Spatial and Organizational Dynamics, Faro, Portugal
Abstract
Purpose – To analyze recognition of impairment losses in tangible and intangible assets, and their relevance to investors in companies listed in the Lisbon and Madrid Stock Exchange (2007-2011).
Methodology – Quantitative analysis of a panel data sample of 80 companies listed in the Lisbon and Madrid Stock Exchange (20072011) was carried out. Panel data linear and non-linear regression models were estimated.
Findings – We found that the amount of impairment losses showed an upward trend, and that these losses are most significant among intangibles, especially goodwill (GW). We also found that the probability of recognition of impairment losses is positively influenced by the dimension of entities and negatively by market value (p < 0.10). Portuguese export-oriented companies have a higher probability of not recognizing impairments. However, Portuguese companies with higher market values have greater probability of recognizing impairment losses, contrary to the sample as a whole, in which the relationship is negative (p < 0.10). The results also suggest that there is a smoothing effect on results because of impairments, especially in IBEX35 companies. As to the relevance of impairment losses to market value, we confirm a significant negative relationship, in line with conclusions from previous studies.
Originality/value – This study contributes to the introduction of the cultural factor in this analysis, highlighting the differentiated behaviors between Portuguese and Spanish companies.
Keywords – Tangible assets; intangible assets; impairment; market value.
305
Received on 12/17/2014 Approved on 05/31/2016
Responsible editor: Prof. Dr. Ivam Ricardo Peleias
Evaluation process: Double Blind Review
Review of Business Management
DOI: 10.7819/rbgn.v18i60.2300
1
Introduction
The definition of impairment is associated with historical cost, which establishes that an asset’s cost must be allocated to profits via depreciation/amortization. This process would allow annual
reflection of the use or loss of this investment’s value during its useful life. However, depreciation/amortization do not reflect changes in assets’ current values, and impairment accounting has emerged as a complement to depreciation/amortization.
Several studies show that recognition of impairment losses in noncurrent assets was carried out by entities before accounting standardization agencies established specific recognition and measurement criteria. In order to increase dissemination of practices for the recognition of impairment losses on assets and decrease management freedom, the Financial Accounting Standards Board (FASB) issued in 1995 the Statement of Financial Accounting for Standards (SFAS) n.º 121 – Accounting for impairment of long-lived assets, replaced in 2001 by SFAS n.º 144 – Accounting for impairment or disposal of long-lived
assets. In the same line, the International Accounting Standards Committee (IASC) prepared and approved International Accounting Standard (IAS) 36 – Impairment of assets, in 1998.
With regard to goodwill (GW), changes introduced to international reference accounting standards (SFAS 142 and International Financial Reporting Standards (IFRS) 3) in order to replace GW linear amortization by current annual (or more frequently, when there is evidence) impairment analysis led to different positions, whether subject to systematic amortization (associated with the definition of a useful life) or to impairment tests (with the subjectivity associated with future cash flow estimates), so that the adopted measure is consistent with market assessment (Brochet & Welch, 2011; Choi, Kwon, & Lobo, 2000; Jennings, Robinson, Thompson, & Duvall, 1996; Wines & Ferguson, 1993).
In this way, the topic of impairment reveals itself as a research issue associated not only to entity accounting practices and their dissemination, based on several theories supporting entity choices (institutional theory, agency theory, legitimacy theory, among others), but also, from a positivist research perspective, to assessment carried out by investors in regard to these losses and to the impact they have on the respective entities’ market values.
2
Impairment loss relevance and explanatory
factors
Explanatory factors concerning impairment loss recognition and its impact on company profits and value have been widely studied. Some of those studies are presented herein, and were performed before or after the publication specific standards about asset impairment in 1995, as mentioned above, with this standard supporting not only this investigation line, but also the main results obtained.
Among others, Strong and Meyer (1987) analyzed indicators associated with financial performance of entities, prior to impairment loss announcement, such as return for investors, market-to-book ratio and cash flow per share. In
general, the results obtained suggest a negative market reaction to impairment announcements, as well as a direct relationship between loss recognition and top management member changes. Financial performance, measured based on cash flow per share and overall return for investors, has also shown a negative impact on the market.
Elliott and Shaw (1988) analyzed accounting performance
and market return for 240 entities that recognized impairment losses (1982 to 1985). These authors found that large companies (sales and assets used as proxies) presented significant differences with regard to impairment losses when compared to smaller entities. In that same line, Kvaal (2005) confirmed that turnover is positively and significantly associated with total impairment recognition, while profits are negatively associated with total impairment recognition. Elliot and Shaw (1988) also found a negative market reaction to impairment loss recognition with negative daily return on disclosure week, which suggests that impairment losses have an impact on investors profit expectations. Zucca and Campbell (1992) analyzed 67 companies registered in NAARS (1978 to 1983) and found that companies showed an apparent discretion among assets subject to impairment, having shared results found by Elliot and Shaw (1988), who drew the conclusion about negative impact on markets. 306
Impairment losses: causes and impacts
Review of Business Management., São Paulo, Vol. 18, No. 60, p. 305-318, Apr./Jun. 2016
307 Francis, Hanna and Vincent (1996), and Elliot and Shaw (1988)
confirmed markets react to asset losses when discretion is smaller (inventory, buildings, equipment) and do not react to GW discretionary impairment.
Elliot and Hanna (1996), on the other hand, assumed that successive impairment recognition complicates entity recurrent profit market analysis. They performed a study with a sample of 2761 entities, from 1970 to 1994, applying a regression model as methodology. Results showed that successive impairment losses caused a decrease on investor confidence with regard to entity profit valorization.
For the French market, Feuilloley and Sentis (2006) also tested GW impairment relevance by observing market reaction to the announcement of impairment losses (2000-2004). Results showed a significant negative impact on market value, confirming this accounting practice negative impact. Li, Shroff, Venkatamaran and Zhang (2011) analyzed investors’ and financial analysts’ reaction to impairment loss announcements for the period of transition to SFAS 142 and concluded that there was a negative reaction and that impairment losses were followed by a decrease on subsequent company performance.
Yanamoto (2008) analyzed impairment losses on noncurrent assets, disclosed by 357 entities (2004 to 2006), and concluded that leverage ratio, Return On Assets and foreign investors participation are explanatory factors and are negatively associated with impairment recognition, while assets positively explain such recognition. This author has also concluded that the higher the leverage ratio, asset profitability and foreign participation are high, the lower the probability of impairment recognition by the entities. However, with regard to assets, impairment recognition probability increases with asset value. On the other hand, LapointeAntunes, Cormier and Magnan (2009) found a negative relationship between GW impairment and share price and concluded that reported losses are a reliable way to measure GW value decrease.
Albuquerque, Almeida and Quirós (2011) studied companies listed in the Portuguese stock exchange (for the year of 2008, excluding financial and insurance sectors) and found that the number of companies recognizing impairment (47.6% of the sample) was similar to the number of those not recognizing impairment (52.4%). They tested variables such as dimension, debt and profitability as explanatory factors for impairment recognition and concluded that dimension is the factor most significantly associated with impairment recognition. On the other hand, Fernandes and Gonçalves (2014), based on 42 companies listed in Euronext Lisbon (2005 to 2010), analyzed to what extent GW and its value losses are relevant for investors, reflecting themselves in companies’ market value, and concluded they are relevant, suggesting that this reaction is different for entities including PSI20 index when compared to the remaining entities. Castro (2012) analyzed 47 Portuguese companies picked from SABI database and based on the logistics regression model measured the contribution of a number of variables (GW, Sales, Assets and EBITDA) to impairment recognition on GW (dichotomous variable) and
demonstrated the existence of earnings manipulation practices in Portugal. This author also confirmed the relevance of GW and asset in this recognition.
AbuGhazaleh, Al-Hares, and Haddad (2012) examined a sample with 528 listed British companies (2005 and 2006) and assessed the relevance of GW impairment on these companies’ market value in the scope of the application of IFRS 3. They tested a hypothesis in which investors would assess such information as relevant and reflected in listing prices, or, in alternative, in which such information would be faced as a management instrument about future cash flows evolution. They concluded that such information is relevant, therefore confirming that GW impairment information is included in market prices (significant negative relationship between these two variables).
Although the above literature review does not comprehend all research performed in this field, it shows the diversity of drawn conclusions and the several factors analyzed as potentially explanatory in regards to entity accounting options concerning impairment and potential impacts on entity market value.
3
Study goals and
research hypothesis
This study’s main subject is the analysis of recognition of impairment losses on fixed and intangible assets by entities withsecurities subject to transition in Lisbon and Madrid stock Exchange. Literature review allows us to substantiate the hypothesis stating the existence of internal and external factors related to impairment recognition policy. In this sense, we seek to determine if there are any entities internal features and external factors influencing recognition of such losses. The following hypothesis was established and formulated in a positive way:
H1: Impairment loss recognition is associated with entities internal and external factors.
Impairment loss recognition reflects nonrecoverability expectations as for the totality or part of an investment, both for a cash-generating unit and for an individual asset, which is necessarily reflected in estimated future economic benefit flows. In this sense, we would expect investors to reflect such assessment on entity market value, penalizing entities depending on that same assessment. The following hypothesis is therefore positively formulated:
H2: Entity market value is negatively influenced by impairment loss and other internal and external factors.
4
Methodology
This study reflects a positivist perspective in the sense that we intend to analyze not only factors influencing accounting options related to impairment loss recognition, but also its impacts on entity market value. This is a quantitative research, using Reports and Accounts as primary information sources and parametric methods for panel data and to test hypothesis based on related theories and empiric studies.
4.1
Data
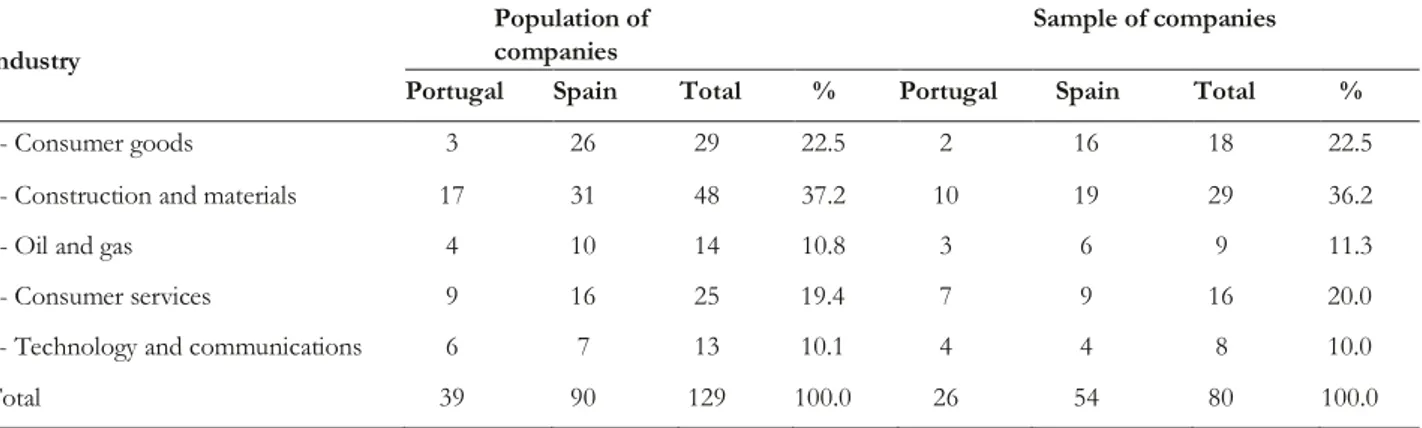
This study focuses on Portuguese and Spanish companies with securities listed in Lisbon and Madrid stock exchange. There were 49 entities with securities subject to transaction in the Euronext Lisbon stock market on 31/12/2011. Seven financial entities and three sports societies were excluded, as the former was subject to applicable sector-specific standards and the latter presented a financial year not matching the civil year. As for the Spanish market, the study included 114 companies listed in the Spanish stock exchange (continuous market). In this case, 24 financial companies were excluded for the same reasons. A group of 80 companies (62% of the total of companies with securities listed in the above mentioned stock exchanges), formed by 26 Portuguese companies and 54 Spanish companies (Table 1) was studied. Next, we decided to study a group of companies which would represent population in terms of country and industry. Company selection with regard to this study group
(sample) was carried out by a simple random sampling method for each subpopulation.
Impairment losses: causes and impacts
Review of Business Management., São Paulo, Vol. 18, No. 60, p. 305-318, Apr./Jun. 2016
309 Table 1
Data collected for this study essentially concerns elements included on Reports and Accounts
and security prices for each entity during the study period (2007 to 2011). Data is presented as panel data, combining cross-sectional data (studied companies) and time data (years studied); the number of studies is 400 (balanced panel).
4.2
Econometric models
Bearing goals in mind, an econometric modelling exploratory study was performed in order to identify the best model specifications. Specifications considered best are those in which independent variables have a significant statistic explanatory ability, goodness of fit is good and all model assumptions are verified. Alternative specifications were explored, but only the best models are presents. After this exploratory study, the following model was considered the best model to evaluate hypothesis 1:
Logit (πit) =F(a+ 1ATit+ 2ln_VNit+ 3P_
MEit+ 4I_Passit+ 5MVit+ 6P_MVit+υi), Eq. 1
in which i = 1, …, 80, t = 2007, ..., 2011, πit = P
(Imp_bin=1|Xit), υi measures the non-observed effect
(varies from case to case, but is constant in time); this effect is random or fixed, Xit is the explanatory variable
vector and F(.) represents logistic distribution function, F(z)=ez/(1+ez). Note that, since we are working with a
logit model (binary dependent variable), estimated value indicates the probability of dependent variable
Distribution of companies, by country and industry industry
Population of companies
Sample of companies
Portugal Spain Total % Portugal Spain Total %
1- Consumer goods 3 26 29 22.5 2 16 18 22.5
2-Construction and materials 17 31 48 37.2 10 19 29 36.2
3- Oil and gas 4 10 14 10.8 3 6 9 11.3
4- Consumer services 9 16 25 19.4 7 9 16 20.0
5-Technology and communications 6 7 13 10.1 4 4 8 10.0
Total 39 90 129 100.0 26 54 80 100.0
Table 2 shows that the sample and the shows that the sample represents the population population include approximately the same in terms of indexes number of entities included in the indexes which
Table 2
Distribution of companies, by country and inclusion in the main stock market indexes Inclusion in the PSI20/ IBEX35
Population of companies Sample of companies
Portugal Spain Total % Portugal Spain Total %
Yes 16 39 30.2 10 15 25 31.2
No 23 90 69.8 16 39 55 68.8
Table 3 Variables used in the logit model
being equal to one, i.e., of recognizing impairment losses. All variables included in this model are shown in Table 3, as well as its coefficient’s expected signal.
Variable Description Expected signal References
imp_bin Is 1 if the company recognizes impairment; otherwise, is zero - Francis et al. (1996), Kvaal (2005) and Yanamoto (2008) AT Total company assets + Elliott and Shaw (1988), Kvaal (2005), Yanamoto (2008) and Li et al. (2011)
ln_VN Natural logarithm of Turnover variable +
Francis et al. (1996), Elliott and Shaw (1988), Kvaal (2005) and Albuquerque et
al. (2011)
MV Market price on the last day of the year - Francis et al. (1996) and Li et al. (2011)
P_ME Interaction between Country*External Market (External market turnover) - Exploratory variable P_MV Interaction between Country*Market price - Exploratory variable I_Pass Interaction between Stock exchange index*Total Liability - Exploratory variable Note: Dependent variable typed in italic.
In order to test hypothesis 2, the following linear model was specified:
MVit = a+ 1Divit+ 2ATit+ 3Imp_Tit+ 4RLit+ 5Pass it+ 6MIit6+ it, Eq. 2
in which i = 1, …, 80, t = 2007, ..., 2011 and μit represents
idiosyncratic error, because it varies
with i and t. Variables included in this model are shown in Table 4.
Table 4
Variables used in linear model
Variable Description Expected signal References mV Div AT Imp_T RL Pass MI
market price on the last day of the year Distributed dividends
Company total asset
Total impairment (Fixed assets + Intangible assets)
Financial year net profit
Company total liability Local market turnover
-+ -+
-Strong and Meyer (1987), Albuquerque et al. (2011) and Fernandes and Gonçalves (2014) Campbell and Shiller (1998) and Shen (2000) Francis et. al. (1996), Yanamoto (2008) and
Li et al. (2011)
Francis et al. (1996)
Oliveira, Rodrigues, and Craig (2010), Xu, Anandarajan, and Curatola (2011) and AbuGhazaleh, et al. (2012)
Albuquerque et al. (2011) Exploratory variable Note: Dependent variable typed in italic.
Impairment losses: causes and impacts
Review of Business Management., São Paulo, Vol. 18, No. 60, p. 305-318, Apr./Jun. 2016
311 All panel data models were estimated using
STATA software, v.11. All hypothesis tests involved a maximum significance level of 10%.
5
Results
5.1
Impairment losses
The total amount of recognized impairment losses presents variations that have
Impairment losses: causes and impacts
Review of Business Management., São Paulo, Vol. 18, No. 60, p. 305-318, Apr./Jun. 2016
313
Tangibles 256.15 48% 36% 33% 59% 17%
Intangibles (total) 274.83 52% 399.28 64% 403.62 67% 259.11 41% 1370.89 83%
GW 64.07 23% 251.54 63% 282.70 70% 223.70 86% 942.65 69%
Total/ Change 530.98 --- 627.95 +18% 598.95 -5% 628.23 +5% 1645.11 +162%
Note: Unit=106 Euros.
We observed that 22 entities (27.5%) never recognized impairment losses during the study period, and that the percentage of Spanish companies which recognized impairment losses, in any of the study years, is higher than the percentage of Portuguese companies in about 12.5%. In the test of independence between Table 6
Impairment loss recognition by country
impairment loss recognition and entities’ countries, we observed that impairment loss recognition (or no recognition) depends on the country (χ2 = 5.524; p = Spanish companies presenting higher recognition percentages (Table 6). 0.019), with Impairments 2007 Impairment recognition 143 Spain 53,0% 127 270 47,0% 100,0% 85 Portugal 65,4% 45 130 34,6% 100,0% 228 Total 57,0% Note: 400 observations (80 companies × 5 years)
172 400
43,0% 100,0%
A test of independence between impairment loss recognition and the fact that entities are included in respective stock exchange indexes was performed (chi-square test). The
independence hypothesis was rejected (χ2 = 6.009; p = 0.014). We concluded that impairment loss recognition (or no recognition) also depends on the index, so that companies included on PSI20/
No Yes
little significance between 2007 and 2010. Those variations have however increased exponentially along 2011, more than doubling the amount of 2007, a fact which is associated with the higher impact of the financial crisis. This major increase was due to the aggravation in impairment recognition on intangible assets, especially for GW. Note that there was also a change in the composition of such losses: intangible assets assumed a predominant role, except for year 2010 (Table 5).
Impairment losses: causes and impacts
Review of Business Management., São Paulo, Vol. 18, No. 60, p. 305-318, Apr./Jun. 2016
315 IBEX35 present higher percentages of impairment loss
recognition. By analyzing the relationship between market value and impairment loss recognition, we also observed that, on average, entities recognizing impairment loss are also those with a higher market value. This difference is also statistically significant (Wilcoxon-MannWhitney test: p < 0.05). As to impairment amounts recognized as losses (per tangible and intangible asset unit), there was no significant difference both between countries and between indexes, suggesting that applying standards leads to measurement criteria and amounts with similar impacts.
A moderately positive correlation (r = 0.4346, p < 0.01) between profits (before impairment) and impairment recognition was also confirmed, suggesting a discretionary impairment recognition which is higher or lower depending on the profits. A country analysis reveals that his behavior on results fit is only significant for Spanish companies (r = 0.4779; p < 0.05) and, among these, those included in IBEX35 (r = 0.5272; p < 0.05).
5.2
Estimated econometric models
With regard to logit model estimation, we initially observed that the dependent variable
Table 7 Logit estimations
does not vary for some companies in the study period (some companies have always recognized or never recognized impairment). This fact led to the exclusion of the possibility of estimating a panel data logit model using a fixed-effects model, because such method would eliminate 22 companies. Therefore, we considered the possibility of estimating a logit model with random effects, because this model would not eliminate companies with no internal variability. Estimation of a model of this kind led to correlation estimate for the single error term near zero (ρu = 0.08), reason by which
the use of a model with random effects is not viable due to the lack of accentuated variability in υi between
companies. Nevertheless, the Hausman test (χ2 = 13.95; p = 0.030) was performed, leading to the conclusion that estimation using a fixedeffects model would be preferable. As mentioned above, this would however lead to the loss of observations. Thus, as there is no need to monitor specific company effects, and no observations should be wasted, the solution was to use a combined logit model. Model estimation results are shown in Table 7. Goodness of fit was assessed by Pearson’s Chi-Square test (χ2 = 411.39; p = 0.252) and Hosmer-Lemeshow test (χ2 = 18.98; p = 0.061). Both results show a reasonable fit.
Note that the majority of explanatory variables presents a statistical significance lower that 5%, namely
Variable Coef. Odds ratio Std. err. p-value
AT 0,000237 * 1,0002368 0,0000957 0,013 ln_VN 0,356412 *** 1,4281958 0,0861811 <0,001 P_ME -0,000682 * 0,9993180 0,0002810 0,015 I_Pass -0,000246 * 0,9997541 0,0001056 0,020 MV - 0,000091 0,9999093 0,0000529 0,087 P_MV 0,000256 1,0002565 0,0001361 0,060 Constant -2,665104*** 0,5159843 <0,001 Note: * p<0,05; ** p<0,01; ***p<0,001 312
AT, ln_VN, P_ME and I_Pass, which confirm that they have the power to explain the probability of impairment loss recognition for a company. Variables MV and P_MV were also included in the model, not only because they are statistically significant at 10%, but mainly because they were expected to have some explanatory power, as explained when the variables were presented. From the referred studies, only Castro (2012) presents similarities with this study; however, its goal and methodology and with obtained results interpretation are different, which are a consequence of theoretical assumptions claimed when choosing the variables.
As expected, dimension, asset and turnover variables have a positive and statistically significant relationship with the probability of a company recognizing impairment losses. This relationship is understandable in the light of several theories and studies (e.g. Francis et al., 1996; Li et al., 2011; Yanamoto, 2008) which associate company dimension to a higher visibility and consequently a higher exposure to scrutiny by several entities. On the other hand, a higher asset volume increases the probability of some of those investments becoming impaired.
The negative signal of the I_Pass variable indicates that the higher the liability, the lower the probabilities of impairment loss recognition by companies. This result is supported by the positive accounting theory (Watts & Zimmermann, 1986) which claims that managers with higher debt levels will tend to take actions that result in increased profits.
Although it is possible to relativize gross liability, depending on assets of its own constitution in terms of collectability and risk, we confirmed that it may induce prudent behavior with regard to impairment recognition to the extent that companies may be affected by impacts, both in profits and leverage ratios.
The influence of companies being exposed to several markets that differ from their national markets, according to initial expectations, created higher visibility with regard to wider groups, possibly leading to prudent management behavior concerning risks associated to impairment loss recognition. In this light, the negative and statistically significant sense of P_ME variable is explained. As this is a variable describing the interaction between the origin country and external market variable,
we verified that national companies are more intensely exposed to such influence, therefore distinguishing themselves from Spanish entities.
The country factor also seems to matter when we consider the influence of market value on impairment loss recognition or nonrecognition options. We observed that for a = 10%, Portuguese entities are more likely to recognize impairment when its market price is higher. This contradicts the behavior for entities which present a negative relationship between market value and impairment recognition (p = 0.087); this result is in accordance with initial expectations. This dissimilar behavior may suggest Portuguese entities with better market performance would feel more pressure to comply with accounting standards, therefore avoiding reserves and other references from analysts who may hinder their public image.
Results of comparative analysis between Portuguese and Spanish entities suggest that there can be constraints when it comes to Portuguese entities recognizing impairment. The negative impacts of impairment on company profits and value, as well as management of investors’ return expectations (and eventual administration remuneration), are some of the reasons claimed to inhibit administrations when it comes to impairment recognition (Balsam, 1998; Bartov, 1993; Cormier, Magnan and Morard, 2000; Scott, 2003). As observed, higher impairment recognition is related to better profits (before impairment), therefore minimizing its impact and suggesting a discretionary management of such profits; this effect is more significant for Spanish entities. This evidence of discretionary impairment use is described by several authors, namely Healy and Wahlen (1999), Dechow, Sloan, and Sweeney (1995) and Li et al. (2011).
Impairment losses: causes and impacts
Review of Business Management., São Paulo, Vol. 18, No. 60, p. 305-318, Apr./Jun. 2016
317 Entities integrating stock exchange indexes, are
apparently led to more conservative behavior
concerning loss recognition, because the “robust”
option in order to accommodate the resolutions for these problems. The estimation is shown in Table 8. they are subject to a higher scrutiny by the general
public, both investors and analysts, and they will avoid exposing themselves to adverse opinions as to the quality of their financial statement. However, these are the companies, especially those included in IBEX35, in which there are the highest levels of dependence between profits and impairment, suggesting these is a profit smoothing instrument.
The relationship between profits after impairment and impairment is also significant for Spanish entities. However, for entities included on IBEX35, this relationship is positive, suggesting impairment recognition is not depending on profit volume only and that we should avoid that such recognition contributes for its decrease. For the remaining Spanish entities, this relationship is negative (r = -0.5332; p < 0.05) reflecting the behavior expected for a decrease in function of impairment losses. For Portuguese entities, this relationship is not significant.
Regarding the linear model (hypothesis 2), population-averaged model was the used model. This choice is based on the fact that we expected variables to present autocorrelation over periods, with the use a model that allowed the specification of a correlation structure suited to each company’s level being preferable. In addition, we must note that regression coefficient estimates for the population-averaged model are interpreted as population-averaged effects and are valid even when the correlation structure is not entirely well specified, mainly when estimation is made using robust models (Cameron & Trivedi, 2010). These diagnostic tests showed the presence of heteroscedasticity (modified Wald test: p < 0.001) and residuals autocorrelation (Breusch-Pagan test: p < 0.001), with this estimation including
Variable Coef. Standard error p-value Imp_T Div AT Pass RL MI Constant -8,709 ** 1,209 *** 0,510*** -0,404 * 0,863 ** 0,169 776,12 3,053 0,231 0,151 0,181 0,301 0,247 194,745 0,004 <0,001 0,001 0,026 0,004 0,492 <0,001 Note:. * p < 0,05; ** p < 0,01; *** p < 0,001
Overall explanatory variables present a statistical significance lower than 5%, with the exception of the MI variable, which has no statistical significance whatsoever at such level. This variable was kept in the model, however, because its inclusion leads to a better overall model fit.
The negative signal of Imp_T variables, the main study object, confirms results obtained in several studies and mentioned in the literature review, namely Strong and Meyer (1987), Elliot and Shaw (1988) and Zucca and Campbell (1992), Fernandes and Gonçalves (2014), among others. This study confirms that impairment presentation is one of the significant factors influencing entity market value decrease. References are made to the nature of this loss, whose effects are not confined to the period of recognition, signaling a decrease on the ability of some investments to generate future economic benefit and this way reduce expectations about the referred entities’ value.
This study also confirms a statistically positive relation between dividends and market value, however with a signal contradicting initial expectations and the referred authors. Apparently, dividends policy positively signals investors who see in such signal the capacity of future return supported by entity market value.
Table 8 Population-averaged estimation
Impairment losses: causes and impacts
Review of Business Management., São Paulo, Vol. 18, No. 60, p. 305-318, Apr./Jun. 2016
319 Positive relationship between explanatory
variables AT and RL and market value were also expected and supported by the referred studies, namely by Li et al. (2011) and Oliveira et al. (2010). This study confirms company dimension measured by means of its assets creates positive expectations with regard to income generation ability, which reflect themselves in company market value. Company income reflects profits for each year and on its history, relating in a positive way to company value.
Liability value is negatively and statistically significantly related to entity market value in the line of expectations regarding this variable. This variable is not part of many studies related to this subject. The use of leverage ratio is more common, and this is also expected to present a negative relationship.
6
Conclusions
All 80 entities with securities subject to transaction in the Portuguese and Spanish stock markets analyzed in this study are obligated to apply the same accounting standards – IAS adopted by the European Union. This fact ensures financial statement comparability between entities in both countries with regard to impairment loss recognition, both for procedures and measurement and disclosure criteria.
This impairment issue was investigated in the study period, 2007 to 2011 and the analysis was limited to fixed and intangible assets. Impairment value for this period was relatively constant, except for 2011, in which there was an exponential increase, particularly explained by GW impairment increase. Comparative analysis between both Iberian Peninsula countries showed that impairment recognition, in terms of percentage (and also on average), is higher in Spain; this difference is statistically significant. However, although the recognized value (per tangible and intangible asset unit) is lower for Portuguese companies, statistical differences are not significant.
It was possible to infer different behavior for Spanish entities in terms of recognition frequency; however, their motivations were not identified by this study, suggesting accounting options such as profit
management instruments. Companies included in PSI20 and IBEX35 indexes were found to present higher recognition percentages and a positive relationship between impairment recognition and profits suggesting that these are a smoothing instrument. This effect is more significant for IBEX35 companies, which, on average, presented not only a higher impairment average volume (potentially also justified by its larger dimension), but also a higher positive correlation between impairment and profit.
Results obtained by applying the logit model globally validate the hypotheses of existence of explanatory factors for impairment recognition. AT (total assets) and In_VN (natural logarithm for Turnover) are validated as positively associated to impairment loss recognition probability; it is possible to conclude that the dimension factor was found to enhance the most frequent recognition policies.
Market value, country external market and liability variables (concerning the fact the entity is or is not included on PSI20/IBEX35) are negatively related with the recognition option and may indicate that these exposure factors are limiting this option. Managers are deemed to take impairment losses as a negative signal, both in the stock market and in geographical markets where they operate. With regard to its relation with liability, impairment loss recognition may affect owners’ equity decreases (via profits or directly on revaluation surpluses), which combine with high liability values lead to a worse financial image for these entities, namely by means of some financial and economic indicators such as financial autonomy, solvability and the several profitability ratios.
The second hypothesis related market value with several variables, and one of them is impairment recognition. Evidence of a relationship can be inferred in several studies: impairment loss in conjunction with other internal and external factors is negative explanatory factor of the market value.
This negative relationship between impairment and market value can be explained by the possible market suspicion regarding companies that recognize impairment, because, in addition to the previously mentioned immediate effects, these companies indicate a decrease on the ability to generate future economic
benefit and consequently a decrease on its future performance. These results are also in accordance with the conclusions of studies stating that market stays ahead of impairment recognition by using several information sources, this way recognizing the loss of asset economic value.
Other variables such as total assets, financial year net profits and dividends also show a significant positive relationship. Among these variables, only dividends show a relationship that is different from what was initially expected, thus signaling investors’ preference towards short-term returns rather than future returns.
The relationship between assets and liability and market value is negative and statistically significant, as expected, therefore confirming that this indicator is significant for those who assess the inherent risks of entities.
This study is considered a contribution to knowledge in the accounting field, since it introduces the cultural component as a justification for the permanence of different accounting practices, in a context of accounting standardization around international accounting standards.
This study presents some limitations, namely the fact that it relies only on a group of companies listed in the Lisbon and Madrid stock exchanges. This fact led to sectorial analysis, because of the small number of elements regarding certain sectors, possibly creating bias
in results and leading to less robust conclusions; this is why this study has not gone further with regard to this influence.
References
AbuGhazaleh, N. M., Al-Hares, O. M., & Haddad, A. E. (2012). The value relevance of goodwill impairments: UK evidence. International Journal of Economics and Finance, 4(4), 206-216.
Albuquerque, F., Almeida, C. A., & Quirós, J. (2011). The impairment losses in non-financial assets: evidence from the Portuguese stock Exchange. International Journal of Business Research, 11(2), 42-52.
Balsam, S. (1998). Discretionary Accounting Choices and CEO Compensation. Contemporary Accounting Research, 15(3), 229-252.
Bartov, E. (1993). The Timing of Asset Sales and Earnings Manipulation. The Accounting Review, 68(4), 840-855.
Brochet, F., & Welch, K. (2011). Top Executive Background and Financial Reporting Choice: The Case of Goodwill Impairment (Working Paper No. 11-088). Harvard Business School. Acedido de http://www.hbs.edu/faculty/Publication%20 Files/11-088.pdf
Cameron, A. C., & Trivedi, P. K. (2010). microeconomics using Stata. College Station: Stata Press.
Campbell, J. Y., & Shiller, R. J. (1998). Valuation Ratios and the Long-Run Stock Market Outlook. The Journal of Portfolio management, 24(2), 11-26.
Castro, E. N. (2012). A manipulação de Resultados em Portugal através do Goodwill, Dissertação de Mestrado, Instituto Politécnico do Porto.
Choi, W.W., Kwon, S. S., & Lobo, G. J. (2000). Market valuation of intangible assets. Journal of Business Research, 49(1), 35–45.
Cormier, D., Magnan, M., & Morard, B. (2000). The Contratual and Value Relevance of Reported Earnings in a Dividend-Focused Environment.
The European Accounting Review, 9(3), 387-417.
Dechow, P. M., Sloan, R. G., & Sweeney, A. P. (1995). Detecting earnings management. The Accounting Review,
70(2), 193–225.
Elliott, J., & Hanna, J. (1996). Repeated accounting write-offs and the information content of earnings. Journal of Accounting Research, 34(Suppl.), 135-155. Elliott, J., & Shaw, W. (1988). Write-downs as accounting procedures to manage perceptions. Journal of Accounting Research, 26(Suppl.), 91-119.
Impairment losses: causes and impacts
Review of Business Management., São Paulo, Vol. 18, No. 60, p. 305-318, Apr./Jun. 2016
321 Fernandes, J. S., & Gonçalves, C. I. (2014). A relevância
do goodwill e respetivas imparidades para o valor de mercado das empresas com títulos cotados: O caso da
Euronext Lisbon. Revista Contabilidade e Gestão, 15,
117-150.
Feuilloley, M., & Sentis, P. (2006). Pertinence économique de la norme IFRS 3 – phase 1 - Une analyse des dépréciations du goodwill par les entreprises françaises sur la période 2000-2004. Comptabilite, Controle, Audit et Institution(s). Acedido de https://halshs.archives-ouvertes.fr/ halshs-00548081/document
Francis, J., Hanna, J. D., & Vincent, L. (1996). Causes and effects of discretionary asset writeoffs. Journal of Accounting Research, 34(Suppl.), 117-134.
Jennings, R., Robinson, J., Thompson, R., & Duvall, L. (1996). The relationship between accounting goodwill numbers and equity values. Journal of Business, Finance & Accounting, 23(4), 513-533.
Healy, P. M., & Wahlen, J. M. (1999). A review of the earnings management literature and its implications for standard setting. Accounting Horizons, 13(4), 365–383. Kvaal, E. (2005). Topics in accounting for impairment of fixed assets (Series of Dissertations 3/2005). BI Norwegian School of management.
Acedido de http://web.bi.no/forskning/papers. nsf/0/6f69655decead80cc125705e0049b44b/$
FILE/05-03-kvaal.pdf
Lapointe-Antunes, P., Cormier, D., & Magnan, M. (2009). Value relevance and timeliness of transitional goodwill-impairment losses: Evidence from Canada. The International Journal of Accounting, 44(1), 56–78.
Li, Z., Shroff, P. K., Venkatamaran, R., & Zhang, I. X. (2011). Causes and consequences of goodwill impairment losses. Review of Accounting Studies, 16(4), 745-778.
Oliveira, L., Rodrigues, L. L., & Craig, R. (2010). Intangible assets and value relevance: Evidence from the Portuguese stock exchange. The British Accounting
Review, 42(4), 241-252.
Scott, W. R. (2003). Financial Accounting Theory. New Jersey: Prentice Hall.
Shen, P. (2000). The P/E Ratio and Stock Market Performance (Federal Reserve Bank of Kansas City). Economic Review, Fourth Quarter, 23-36.
Strong, J. S., & Meyer, J. R. (1987). Asset writedowns: managerial incentives and security returns. The Journal of Finance, 42(3), 643-661.
Yanamoto, T. (2008). Assets Impairment Accounting and Appraisers: Evidence from Japan. The Appraisal Journal, 76(2), 179-188.
Watts, L., & Zimmerman, L. (1986). Positive accounting theory. New Jersey: Prentice-Hall.
Wines, G., & Ferguson, C. (1993). An Empirical Investigation of Accounting Methods for Goodwill and Identifiable Intangible Assets: 1985 to 1989. Abacus, 29(1), 90-105.
Xu, W., Anandarajan, A., & Curatola, A. (2011). The value relevance of goodwill impairment. Research in Accounting Regulation, 23(2), 145-148.
Zucca, L. J., & Campbell, D. R. (1992). A closer look at discretionary writedowns of impaired assets. Accounting Horizons, 6(3), 30-41.
Supporting Agencies:
This paper is financed by National Funds provided by FCT- Foundation for Science and Technology through project UID/SOC/04020/2013.
About the authors:
1. Joaquim Sant’Ana Fernandes, PhD in Management, University of Huelva, Spain. E-mail: jsfer@ualg.pt. 2. Cristina Gonçalves, MSc in Management, University of Algarve, Portugal. E-mail: cjesus@ualg.pt.
3. Cristina Guerreiro, MSc in Accounting, University of Algarve, Portugal. E-mail:guerreirocris@hotmail.com. 318
4. Luis Nobre Pereira, PhD in Quantitative Methods Applied to Economics and Management, University of Algarve, Portugal. E-mail: lmper@ualg.pt.
Contribution of each author:
Contribution FernandesJoaquim GonçalvesCristina GuerreiroCristina Luís Pereira
1. Definition of research problem √ √ √
2. Development of hypotheses or research questions (empirical
studies ) √ √
3. Development of theoretical propositions (theoretical Work) √
4. Theoretical foundation/ Literature review √ √
5. Definition of methodological procedures √
6. Data collection √
7. Statistical analysis √ √ √
8. Analysis and interpretation of data √ √
9. Critical revision of the manuscript √ 10. Manuscript Writing
11. Other (please specify which)