Improving the Patient Flow at an Academic
Primary Care Teaching Clinic
Serving African American Patients
D. Babalola, Y. X. Meng, M. Nichols, F. Omole, C. Sow and V. Perkins
Corresponding Author: D. Babalola
Morehouse School of Medicine, Department of Family Medicine
1513 East Cleveland Avenue, Building 100, Suite 300A
East Point, GA 30344, USA
[email protected]
Copyright
©
2013 D. Babalola et al. This is an open access article distributed under the
Creative Commons Attribution License, which permits unrestricted use, distribution, and
reproduction in any medium, provided the original work is properly cited.
Research was sponsored by HRSA Title VII Residency Training in Family Medicine.
D58HP08294 “Integrating Complementary and Alternative Medicine into the Chronic Care
Model (Diabetes).”
Research topic was presented at the Conference on Practice Improvement: Constructing the
Medical Home, November 5-8, 2009 in Kansas City, MO.
Abstract.
Background and Objectives: Patients express their long wait time as an ineffective
patient flow pattern and subsequently patient dissatisfaction. We embarked on this study to
ensure an efficient clinic. We used findings from a pilot time-flow study at an academic
family practice to identify operational problems that led to excessive patients’ wait time and
repeated the study after the practice has been restructured with the goal to re-evaluate
consequent changes in patient waiting times, clinical process efficiency, and patient
satisfaction.
Method: A before-and-after time-flow evaluation of patient waiting times and patient satisfaction survey was conducted in an inner-city academic family medicine practice. All patients visiting the family medicine practice during the weeks of October 12nd through 23rd, 2007 participated in the pilot study and October 12th through 24th, 2008 in the post interventional study.
Results: After implementing the practice changes, data from the patients’ time-flow study were analyzed using the Define-Measure-Analysis-Improve-Control (DMAIC) method. The post-intervention analysis showed an improvement in patient flow reflected by the decreased total wait time from 122 minutes in the pre-intervention study to 98 minutes in the post intervention study. This demonstrated a 20% improvement over two week time block within a 12 months interval. Room and nursing time usage rates, patient satisfaction, and quality-of-care indicators largely improved.
Conclusions:
The main factors leading to long wait time were identified and changes were made to improve the Patient Flow process at the CFHC, which was directly evidenced by the reduced patient wait-time and increased patient satisfaction.
BACKGROUND
It is paramount to facilitate a collaborative approach to implement an interdisciplinary process that would ensure improved delivery of preventive, diagnostic and therapeutic measures in order to improve health outcomes of individuals and improve patient flow to maximize clinical efficiency. Long wait time gives a negative perception of the quality of services received in a clinic and this was a major challenge experienced in the outpatient clinic at Comprehensive Family Health Care Center (CFHC). This eventually led to patients’ dissatisfaction then increased loss of revenue from patient walk outs, and its indirect effect on clinical efficiency. CFHC is the primary clinic for the Family Medicine Residency program, Morehouse School of Medicine. Two studies were performed at the CFHC with the focus on the patients’ waiting time in the clinic pre and post intervention.
This study was conducted to promote efficiency so as to ensure patients’ satisfaction, retention of patients, decrease overhead, increase revenue and enhance patient/physician relationships. Patients’ wait time has been defined as “the length of time from when the patient enters the outpatient clinic to the time the patient checks out. Several studies have been carried out on patient wait time such as the study on outpatients waiting time in Hospital University Kebangsaan Malaysia through the six sigma approach which revealed a few problems, to mention a few: registration time and insufficient number of doctors.1
To perform this study, we had to identify the different problems resulting in prolonged patient wait time with the main objectives of: (i) to identify the factors that affected wait time and recommend ways of minimizing the delay; (ii) to evaluate the improvement in patient wait time after intervention; (iii) and to improve patient flow processes and clinical efficiency.
METHODS Clinic Site
The site for this project was the Morehouse Medical Associates Comprehensive Family Health Center (CFHC), a community-based clinic in urban and metropolitan Atlanta, Georgia, providing over 10,000 patient visits per year and serving over 5,000 patients annually. CFHC is the clinical site for both Residency training and a faculty private practice. The operational hours at this site are from 9 AM to 5 PM 4 days a week and from 9 AM to 12.30 PM 1 day per week for residents. Over 90% of the clients are insured African Americans; the majority of the clinical staff are also African Americans. The clinic offers a wide range of services, including adult medicine, pediatrics, geriatrics, obstetrics, gynecology, sports medicine, behavioral medicine/mental health, nutrition counseling and acupuncture. The electronic health record (EHR) was implemented since 2001.The facility includes 23 exam rooms, 4 procedure rooms, and a behavioral medicine wing, There are 20 attending physician providers, 15 resident physicians and 21 clinical staff employees composed of 1 RN, 4 LPN’s, 4 medical assistants, 2 operators, 4 front patient service representatives, 1 coder and 2 charge coordinators, 2 medical records staff, and medical director and practice manager.
Patient Care Flow
Following exemption under the federal regulation by the Institutional Review Board, we prepared for this study by outlining the flow of patients through the practice diagrammatically (Figure 1).
Initial Data Collection, Pilot Study
The first phase of the time-flow study was exploratory and aimed to identify the problems and the duration of patient wait time. Study participants were patients, clinical staffs and physicians at the CFHC.
The sample size and procedures were as follows; there were total 347 patients included in this phase of the study and was conducted in two weeks from October 12nd through 23rd, 2007 using a time tracking form (Figure 2).
The patient’s total waiting time was defined as the time from when the patient walked into the clinic to check-out. The time was tracked by clinical staff and physicians for each station as illustrated in the time tracking form. The first station was when the patient checked-in at front desk to when the nurse was notified of the patient’s presence; this was followed by when the nurse took the patient for vitals and subsequently placed in the physician’s room to be seen by the physician. The physician time was allotted for on how long it took them to see the patient and let the patient out of the room. If the physician was a resident, they would discuss the patients’ management with the preceptors before dismissing the patient for discharge if laboratory testing was not required.
After the results were analyzed the leverage point revealed that the longest waiting time was from when the patient was placed in the exam room until when the physician saw and completed the visit. The contributing factors for the prolonged patients’ waiting time were the following; physicians’ punctuality in the clinic, physicians’ no show to clinic, staff shortage and new resident physicians’ were not up-speed of practice skills and time management at the beginning of the academic year.
We report the results of a coordinated effort to exploit these findings by reconfiguring the training and clinical activities over a twelve month period at the practice to reduce visit time while maintaining resident satisfaction and improving quality. Such interventions included installation of magnetic timers on exam room doors (set @ 30 min intervals) to remind physicians that patients ‘are waiting to be seen in the exam room and how long they have waited, a printer was placed in the residents’ work station, a physician was assigned for walk-in patients, physicians’ arrival time to clinic was logged in at a center location by a charged nurse to ensure punctuality and last but not the least, we re-established the pertinent of standing orders written by the providers such as immunizations and respiratory (by nebulizer) treatment to be carried out by the nurses.
Post Intervention Study Data Collection:
The second phase of the time-flow study was performed at CFHC 12 months after the pilot study. This ran for two weeks from October 13th through 24th, 2008 with the attempt to decrease patient wait time by 5-10%. The sample size for this study was 221 patients.
Three major collection methods were used in this study. (1) In ensuring proper generation of data, the lead researcher directly observed the working processes at the CFHC and the data was entered by the clinical staff and physicians into a modified time-tracking form (Figure 3) which involved measurements of the patient waiting time from check in to check out. Variables monitored in this study were patient’s waiting time, work process, number of physicians available (both preceptors and providers) and number of staff at the registration counter.
(2) Moreover, in carrying out this research, some of the patients, office staff and doctors were interviewed to obtain information on the working process in the clinic. Patients were also interviewed to find out their problems with the clinical processes and needs. A reminder and encouragement messages were sent at the beginning and end of the work week concerning the ongoing study.
(3) The third method involved collecting data from patients through questionnaires to obtain their level of satisfaction of the patient flow processes.
RESULTS
Statistical Analysis (Table 1)
Data were entered into an Excel (Microsoft Corp, Redmond, Wash) spreadsheet and then analyzed with Stata software (Stata Corp, College Station, Tex). The t tests were used to detect differences in means for continuous variables, and χ 2 tests were used to analyze differences in categorical variables. Wilcoxon–Mann-Whitney rank sum tests were used for nonparametric estimations. Multivariate ordinary least-squares regression analysis was used to estimate coefficients for the amount of visit time accounted for by specific characteristics of the visit. By including weeks in these regressions, we could determine how much total visit time decreased from pilot study to post intervention study holding other visit characteristics constant.
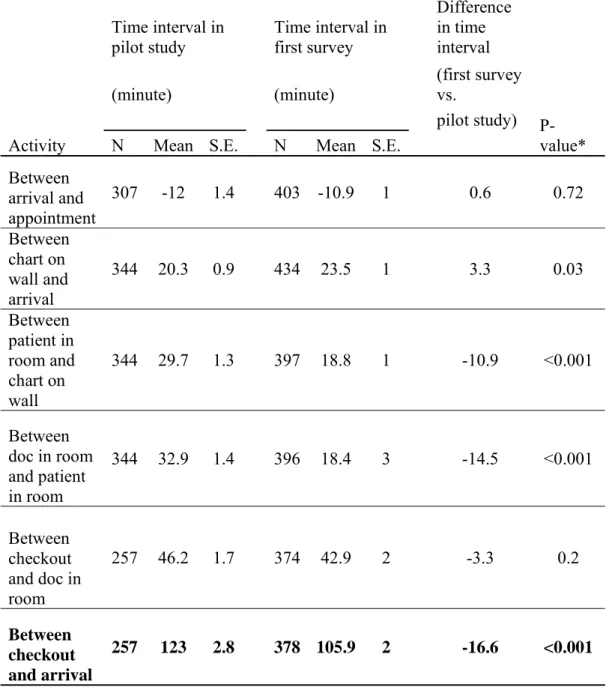
Table 2 (the left side) documents the distribution of patients’ waiting time across the different stations entered by the clinical staff and physicians over the course of the two weeks pilot study. The longest waiting time was evident when the provider went in to see the patient to when the patient was allowed to leave the room. This was attributed to the fact that it is a residency program for which the residents have to present their patients to the preceptor first and most cases, the provider accompanies them to re-evaluate the patients particularly if it is a PGY-1, whom at the time of the study were three months old in the program. All these are done before a patient can be discharged. It was important to note that patients spent the next longest time in the examining room after the nurses took their vitals. This was attributed to the possibility of more residents ratio to preceptors in the clinic hence the residents waiting their turn to present a prior patient and the likely hood of them loosing track of how long the next patient has been waiting to be seen. The total wait time was a total of 122 minutes from when they checked in to check out.
After an analysis of the data from the initial flow study and in collaboration of interviews with clinical staff and providers, several areas potential improvements were deemed possible. These included the following: (1) Physicians punctuality to the clinic (2) preceptors’ late or no show to clinic (3) new PGY-1 residents each year exposed to an unfamiliar environment (4) no printers in the residents’ work place leaving them to be less efficient with time management and (5) front desk staff shortage.
After reviewing these results with physicians, nurses, administrators, and clerical staff, several changes were instituted: installation of magnetic timers on exam room doors (set @ 30 min intervals) to remind physicians that patients ‘are waiting to be seen in the exam room and how long they have waited, a printer was placed in the residents’ work station, a physician was assigned for walk-in patients, physicians’ arrival time to clinic was logged in at a center location by a charged nurse to ensure punctuality and last but not the least, we re-established the pertinent of standing orders written by the providers such as immunizations and respiratory (nebulizer) treatment to be carried out by the nurses.
Repeating the flow study in 2008 identified changes in time intervals that occurred at different points during the visit. Table 2 (right side) records these changes. Generally there were significant improvements in the patients’ waiting time in all the illustrated station in Figure 3; when the patient was placed in the room to when seen by the physician with a waiting time going from 29.5 to 20.7 minutes and when the provider entered the room to when the patients’ visit was completed with a waiting time going from 46.3 to 40.2 minutes. Most patients were noticed to have arrived 8-10minutes earlier than their scheduled appointments. The total patients’ waiting time after the intervention went from 122 minutes to 98 minutes, signifying a 20 % reduction which reflected in a more efficient clinic and patient satisfaction survey.
In addition, the busiest days at the CFHC are usually Fridays with more residents, one to two preceptors, and increase patients numbers due to the weekend rush. The waiting time on both Fridays during the study period (October 17th and 24th, 2008) were 129 and 108 minutes respectively. The total average wait time for post intervention study during the ten days was 95 minutes to 129 minutes.
DISCUSSION
We have shown that clinical intervention methods in a busy inner-city academic family practice not only is realistic but can be a useful instrument to both analyze and develop potential efficiency gains in practice patterns. The usefulness of the clinical interventions resided in the transparency with which it identified portions of the visit where excessive waits appeared to occur. With the results of the first pilot study as used as a guide, the medical, nursing, and administrative cadres at the practice were able to concentrate on problematic portions of the visit in the building of potential solutions. Conducting the second study then enabled the practice to test whether the implementation of these solutions resulted in improved waiting times. To avoid causing problems in other areas by improving one aspect of the practice at the expense of either the quality of training or patient care, the exercise also monitored changes in clinical staff and providers’ satisfaction and quality-of-care indicators through weekly meetings and evaluation.
It cannot be overemphasized that the ability to conduct both time-flow studies, to generate appropriate solutions, and to successfully implement the solutions depended critically on the cooperation of each segment of the health care team. The work to improve patient waiting times demonstrated to medical personnel how multifaceted an undertaking the ambulatory practice of family medicine can be in a busy academic facility, yet how important a series of small changes can prove when derived collectively and linked together.
Several potential limitations of this analysis must be kept in mind when the results are interpreted. The data on time intervals were self-reported by the clinical staff and providers at the practice. Although clocks throughout the practice were synchronized, there was some
room for inaccuracy in the estimation of time intervals or for some the time entered by the physician was when the chart was picked up and not when they entered the examining room to see the patients. These initial entries were discarded when noticed and resumes when clarification to the entries were made.
A previous study that compared direct observation of time intervals with self reports among nurses found the former to be more accurate for certain types of nursing activity.2 Unlike the previous study, however, in the present analysis different individuals performed specific activities sequentially throughout the visit. With this design, each successive observer acted, in a sense, as a direct independent observer of the timing of the previous interval. Moreover, a previous time-and-motion study conducted in a family practice residency teaching clinic observed similar waiting times.3 In that study, the authors documented a mean visit time of 80.5 minutes, of which 25 minutes was accounted for by registration and triage time, 19 minutes was spent waiting for a provider to begin, and a mean of 27 minutes was spent with a provider and preceptor.
The possibility must still be considered that the subjects’ awareness of the study may itself have affected the outcomes we observed. This eponymous Hawthorne effect11 might account for some of the distribution of times within each visit as a given participant attempted to minimize the time associated with his or her interaction.
A patient’s experience while waiting and the time taken to see the physician will fundamentally influence their perceptions on the quality of the medical service and efficiency of the clinic. When patients come to our practices, they're usually looking for reassurance, and they want us to help them get well. In the process of so doing, they are expected to go through a series of patient flow processes such as sign-in at the front desk, vitals taken by the nurses, waitsign-ing sign-in the exam room, laboratory if necessary and eventually checkout. We have to look not at what we're doing to serve ourselves but what we are doing to serve our patients.
Generally, there are four major elements that influences the wait time at an outpatient clinic such as availability of facilities and equipment, human resources, patients and registration process. 4 The relevant applicability of our findings lies not in the specific inefficiencies uncovered in the practice we evaluated, but rather in the technique used to discover those inefficiencies. If, as has been suggested elsewhere, ambulatory sites with teaching components have higher operating costs than nonteaching sites,5, 6 then the motivation to uncover and exploit potential inefficiencies may be greater for ambulatory academic programs than for comparable nonteaching entities.
From the analysis of our time-flow studies, the three main problems which accounted for 80% of long wait time were: registration time, insufficient physicians and insufficient Counter Staff.
The origin and consequences of registration is the main cause of the long waiting time. It is recommended that few processes need to be carried out by the front office staff during registration to improve wait times. To mention a few; work process involving record keeping would also affect registration time and unifying assignments based on importance and avoiding work that could lengthen registration time will improve the registration process.
The origin and consequences of in short supply of doctors can increase patients’ waiting time. Unequal number of doctors and patients would cause a bottleneck in the queue for service. Therefore, a well-planned schedule should be in place so that patient care is not adversely affected. The use of use of pre-standing orders also assisted in reducing the wait time.
The origin and consequences of in short supply of front desk staffs. This leads to a long waiting time for service. Proper organization of work and division of tasks among our staff greatly reduced patients waiting time. A better working shift schedule and cross training was made to balance workload among staff. There should be at least one staff assign to provide information to patients while others handle new cases.
CONCLUSION
Improving patient flow has to be a group effort, with the entire staff and focused leadership from physicians in the group. Patient flow is not a one man show, it is multifactorial which involves the physicians, front office, the nurses, etc. It's up to the practice. Our initial patient satisfaction survey prior to the time-flow study, patients expressed the long wait time as an ineffective patient flow pattern and subsequently patient dissatisfaction. We embarked on these studies to become more efficient and effective. Our finding was very encouraging; it is our goal to continue to enhance this process with ongoing clinical improvement as the results of our studies shows that with the collaboration of clerical, nursing, and medical personnel we can provide useful interventions with which to improve the ability of ambulatory academic sites to deliver more efficient care.
REFERENCES
1. Mohamad Hanaffi Abdullah. (2005). Study on Outpatients’ Waiting Time in Hospital
University Kebangsaan Malaysia (HUKM) Through the Six Sigma Approach. The Journal of the Department of Statistics, Malaysia. Volume 1
2. Burke TA, McKee JR, Wilson HC, Donahue RMJ, Batenhorst AS, Pathak DS. A comparison of time-and-motion and
self-reporting methods of work measurement. J Nurs Adm. 2000;30:118-125.
3. Xakellis GC Jr, Bennett A. Improving clinic efficiency of a family medicine teaching clinic. Fam Med. 2001;33:533-538. 4. Jamaiah Hj Mohd Sharif and Suriani Sukeri. (2003). Study on waiting time at the paediatric dental clinic, Kuala Lumpur Hospital. Journal of Quality Improvement, 7(1), 19 – 23.
5. Hogan AJ, Franzini L, Boex JR. Estimating the costs of primary care training in ambulatory settings. Health Econ. 2000;9:715-726.
6. Linna M, Hakkinen U, Linnakko E. An econometric study of costs of teaching and research in Finnish hospitals. Health Econ. 1998;7:291-305.
Patient Clinic Flow
Patient Sign-in
Patient check in Nurse notified
Patient triaged
No Yes
Patient returns to waiting area Patient placed in the exam room
Doctor sees the patient
Residents Faculty
Discussed with preceptors
Lab check-in Patient check-out
Lab check-in Patient check-out
Pilot Time-Tracking log
Appointment Time: __ ___ __
Patient Check-In: _ _ _ _ _ _ _
Encounter On Wall: _ _ _ _ _ _
Patient in room: _________
Doctor in room: _ _ _ _ _ _ _ _ _
Lab check in: ___________
Patient Check Out:
______
Figure 2
Modified Time-Tracking form
Clinic Day: Mon_ Tue_ Wed_ Thu_ Fri_ Date --
--Please check the appropriate boxes Completed by the front office
PGY 1 ____PGY 2 _____PGY 3___Faculty_______Student_______ .
Est. Pt. ____New Pt. ________Walk-in _________
Arrival Time: ______________
Appointment Time: __________________
Chart on the wall_______________
Completed by MA .
Time patient is placed in the room (triage time) ______________ Completed by MD
Time MD enters the room_______________________ Time MD finish seeing the patient
Completed by Lab personnel Time in the Lab_________
Comple.ted by the front office
Time patient completes check out___________ To be completed by site supervisor
# of nurses _
# of residents in clinic PGY 1---PGY 2 PGY 3_________
# of Faculty _
# of Preceptors